A belt for the cell: cellulosic wall thickenings and their role in morphogenesis of the 3D puzzle cells in walnut shells
←
→
Page content transcription
If your browser does not render page correctly, please read the page content below
Journal of Experimental Botany, Vol. 72, No. 13 pp. 4744–4756, 2021
doi:10.1093/jxb/erab197 Advance Access Publication 8 May 2021
This paper is available online free of all access charges (see https://academic.oup.com/jxb/pages/openaccess for further details)

RESEARCH PAPER

A belt for the cell: cellulosic wall thickenings and their role in
morphogenesis of the 3D puzzle cells in walnut shells
Sebastian J. Antreich*, , Nannan Xiao , Jessica C. Huss                                 and Notburga Gierlinger*,

                                                                                                                                                                   Downloaded from https://academic.oup.com/jxb/article/72/13/4744/6272295 by guest on 24 December 2021
Department of Nanobiotechnology, Institute of Biophysics, University of Natural Resources and Life Sciences, 1190 Vienna, Austria

* Correspondence: sebastian.antreich@boku.ac.at or burgi.gierlinger@boku.ac.at

Received 22 January 2021; Editorial decision 28 April 2021; Accepted 3 May 2021

Editor: James Murray, Cardiff University, UK

Abstract
Walnut (Juglans regia) kernels are protected by a tough shell consisting of polylobate sclereids that interlock into a
3D puzzle. The shape transformations from isodiametric to lobed cells is well documented for 2D pavement cells,
but not for 3D puzzle sclereids. Here, we study the morphogenesis of these cells by using a combination of different
imaging techniques. Serial face-microtomy enabled us to reconstruct tissue growth of whole walnut fruits in 3D,
and serial block face-scanning electron microscopy exposed cell shapes and their transformation in 3D during shell
tissue development. In combination with Raman and fluorescence microscopy, we revealed multiple loops of cellu-
losic thickenings in cell walls, acting as stiff restrictions during cell growth and leading to the lobed cell shape. Our
findings contribute to a better understanding of the 3D shape transformation of polylobate sclereids and the role of
pectin and cellulose within this process.

Keywords: 3D imaging, 3D puzzle cells, interlocking, Juglandaceae, morphogenesis, nutshell, primary cell wall, Raman,
SBF-SEM, sclerenchyma.

Introduction
Fruits of the Persian walnut (Juglans regia) are composed of a                       In general, cells of plant tissues divide first and expand later
green and fleshy husk (fused bract and bracteoles), a dry and                     during the fast growth phase of the plant organ (Gonzalez
hard shell (pericarp), and a tasty and healthy kernel protected                   et al., 2012). During expansion, hydrostatic pressure (turgor)
by those two envelopes. A closer look into the shell reveals                      expands the whole cell, stretches the cell wall and forces it to
polylobate sclereid cells tightly interlocked in 3D with their                    loosen some parts, followed by adding new materials to grow
neighbours, which leads to a higher contact area between cells                    (for a review, see Cosgrove, 2018). Root and stem cells expand
and superior mechanical properties compared with tissues                          mainly in one axis to push the root down into the ground
with isodiametric cells as in pine seed coats (Antreich et al.,                   or the stem up into the air (Baskin, 2005; Daher et al., 2018).
2019). Furthermore, the irregularly shaped cells are also found                   Nevertheless, there are tissues where the cells start to expand
in shells of pecan and pistachio (Huss et al., 2020).                             irregularly, forming lobes as in epidermal cells of leaves (Vöfély

Abbreviations: EM, endmember; ICS, intercellular space; NMF, non-negative matrix factorization; SF-M, serial face-microtomy; SBF-SEM, serial block face-
scanning electron microscopy; WAC, weeks after catkin formation.
© The Author(s) 2021. Published by Oxford University Press on behalf of the Society for Experimental Biology.
This is an Open Access article distributed under the terms of the Creative Commons Attribution License (http://creativecommons.org/licenses/by/4.0/), which per-
mits unrestricted reuse, distribution, and reproduction in any medium, provided the original work is properly cited.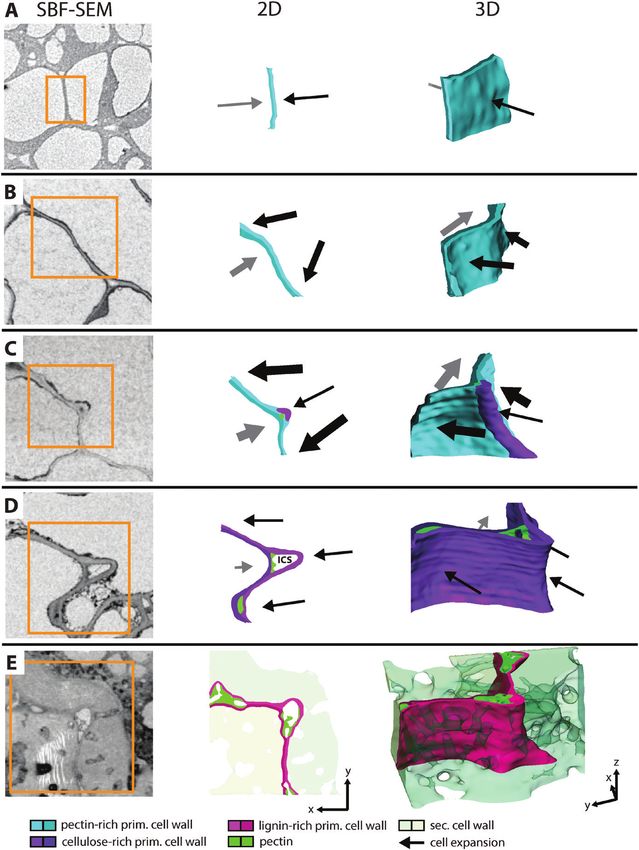
Morphogenesis of the 3D puzzle cells in walnut shells | 4745

et al., 2019). The irregular shape of the cell helps to reduce        Materials and methods
mechanical stress on the cell wall caused by high turgor pres-
sure. For example, in growing epidermal cells of Arabidopsis          Sampling
thaliana, lobes reduce the overall mechanical stresses at the cell    We collected walnuts at 1 week intervals throughout 2019, starting from
                                                                      April 30th until September 30th, from the horticulture garden of BOKU,
and tissue level when cell size increases; however, high stress       Vienna. Walnuts grew on a >40-year-old tree of the cultivar ‘Geisenheim
values become visible at the indents between the lobes (neck          120’. Five nuts were always collected from the sunny side of the tree, put
regions) (Sapala et al., 2018).                                       into plastic bags, and immediately brought to the laboratory for further
   These irregular cell shapes generate certain stress patterns       investigation.
which are clearly interlinked with cell wall composition and
its mechanical properties (Kierzkowski et al., 2019). The pri-        Fresh weight, size, and serial face-microtomy
mary cell wall is composed mainly of polysaccharides such as          Each week the fresh weight, length, and diameter of each nut were

                                                                                                                                                    Downloaded from https://academic.oup.com/jxb/article/72/13/4744/6272295 by guest on 24 December 2021
cellulose, which is the main load-bearing component; pectin,          measured. Every 2 weeks (from week 4 to 12), one of the five wal-
which is important for cell wall flexibility; and hemicellu-          nuts was used for the serial face-microtomy (SF-M). Another walnut
loses, which cross-link cellulose microfibrils (Lampugnani            was used for the SBF-SEM, calcofluor white staining, and Raman mi-
et al., 2018). Cellulose is typically the stiffer part of the cell    croscopy analysis. All other nuts were frozen at –20 °C for later use. For
                                                                      the SF-M, the walnut was kept in the cryostat microtome (CM3050
wall due to its crystalline structure, and the arrangement of         S, Leica Biosystems, Nussloch, Germany) for 1–4 h (depending on the
the microfibrils is linked to the cortical microtubule distri-        nut size) at –20 °C until all liquids in the walnut were frozen. A camera
bution in the cell (Paredez et al., 2006; Gutierrez et al., 2009;     was mounted in front of the walnut and after each 30–100 µm cut (de-
Bidhendi and Geitmann, 2016). These cortical microtubules             pending on the walnut size) with the microtome knife a photo was
tend to orient along more highly stressed cell wall regions,          taken. As the sample holder moves toward the knife, the camera position
                                                                      did not need changing during the cutting.The acquired picture stacks of
where more cellulose microfibrils become deposited in parallel        the whole nuts were processed and registered in ImageJ (NIH, Bethesda,
to the microtubules, thus increasing the stiffness of the cell wall   MD, USA) with the plugin ‘Linear stack alignment with SWIFT’ using
(Sampathkumar et al., 2014). Pectin plays a central role not only     the standard settings (Rueden et al., 2017). Then the aligned stack was
in cell–cell adhesion in the middle lamella (Marry et al., 2006),     segmented in the Software Amira (Thermo Fisher Scientific, Waltham,
but also in lobe initialization by changing the stiffness of the      MA, USA) into seed, soft shell, hard shell, and husk, followed by 3D
                                                                      reconstruction.
cell wall (Peaucelle et al., 2015; Majda et al., 2017; Haas et al.,
2020). Recently, a two-step mechanism for lobe formation has
been proposed, where de-methylated pectin increases stiffness         Serial block face-scanning electron microscopy
at the future indent, which leads to cell wall undulation as-         Small pieces of walnut shell of ~1 mm×1 mm×1 mm were trimmed with
sociated with more highly stressed regions. This furthermore          a razor blade, always from the mid region of the nut close to the suture.
                                                                      Trimmed pieces were immersed immediately in fixation solution con-
favours the alignment of microtubules and increased accumu-           taining 3% glutaraldehyde in 100 mM sodium cacodylate (pH 7.4) and
lation of cellulose fibrils at the indent, which slows down ex-       stored at 4 °C overnight. Samples were rinsed three times with 150 mM
pansion at this location during growth (Altartouri et al., 2019;      cacodylate buffer and post-fixed with 2% osmium tetroxide and 0.2% ru-
Bidhendi et al., 2019).                                               thenium red in 150 mM cacodylate buffer for 1 h at room temperature.
   Most studies on irregular cell shapes focus on the epidermal       After washing five times with cacodylate buffer, samples were incubated
                                                                      in freshly prepared thiocarbohydrazide solution (1% w/v in dH2O) for
pavement cells of A. thaliana or on epidermal cells of other          45 min, followed by washing three times with dH2O and post-fixing a
dicotyledons, monocotyledons, and ferns (Sotiriou et al., 2018;       second time with a 2% osmium solution for 1 h. Samples were washed
Vöfély et al., 2019). In the epidermis, mainly the anticlinal walls   again four times with dH2O, immersed in 0.5% uranyl acetate, and stored
undulate, while the periclinal walls are straight, which makes        overnight at 4 °C. Again, samples were washed five times in dH2O and
it easy to measure with confocal laser scanning microscopes in        then transferred in Waltron’s lead aspartate solution for 30 min at 65 °C,
                                                                      followed by washing five times in dH2O. Dehydration was performed in
2D. Based on that, shape descriptors are also established in 2D       30, 50, 70, 90, 100, and 100% ethanol in water, followed by 100% and
(Sapala et al., 2018; Altartouri et al., 2019; Vöfély et al., 2019;   100% acetone; 30 min each at room temperature. Samples were then in-
Poeschl et al., 2020). However, it is not known how the sclereid      filtrated by 25% low-viscosity resin in acetone and left at 4 °C overnight.
puzzle cells form in 3D in walnut shells.                             Then samples were transferred into 50% and further into 75% resin, for
   The challenge in walnut is that the husk covers the shell          4 h each, and then in 100% resin overnight at 4 °C, followed by a second
                                                                      round of 100% resin for 6 h at room temperature. Samples were then
tissue during fruit growth and cells in the shell expand ir-          embedded in flat embedding moulds and polymerized at 65 °C for 48 h.
regularly in all directions. In this study, we uncover this mor-      Resin blocks were trimmed with a glass knife on a UC-7 ultramicrotome
phogenesis for the first time in 3D by using a serial block           (Leica Microsystems, Vienna, Austria) to 0.5 mm3 and glued with silver
face-scanning electron microscopy (SBF-SEM). Based on the             cement on a stub. They were coated with a 10 nm gold layer in an EM
3D reconstructions, we characterize cell shapes with different        SCD005 sputter coater (Leica Microsystems) and mounted on the micro-
                                                                      tome of the Apreo SEM (Thermo Fisher Scientific). Scans of 100 µm2
shape descriptors. We also investigate the developing sclereids       were acquired with 1.18 kV, 100 pA, and 3 µs dwell time. Approximately
with Raman spectroscopy to understand the chemical contri-            1000 slices with a slicing depth of 100 nm were made, controlled by the
butions to lobe formation. Finally, we suggest a possible mech-       software Maps 3.4 VS (Thermo Fisher Scientific). The resulting stacks
anism for shaping walnut puzzle sclereids in 3D.                      were scaled to a useable size (~1000×1000×100 pixels) for the Amira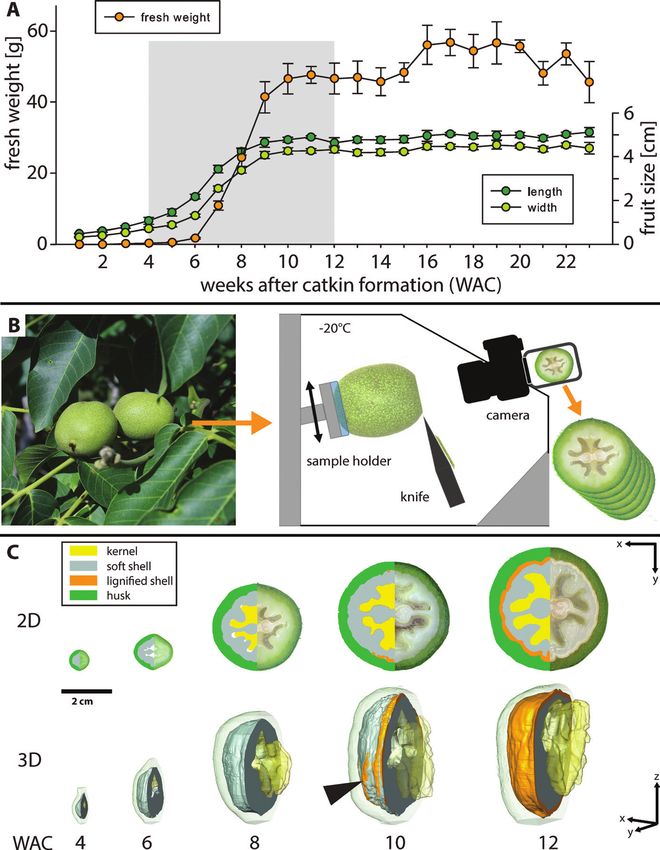
4746 | Antreich et al.

software and registered in ImageJ with the plugin ‘Linear stack align-        Results
ment with SWIFT’ using the standard settings. All whole cells, which
were not cut off by the border, were segmented manually. From each            Walnut and tissue growth
segmented cell surface/volume, convex hull surface/volume and contact
surfaces between each neighbouring cell were calculated in the software       Our first step to track lobe formation in walnuts was a detailed
Amira. Additionally, lobe number was calculated by the centreline tree        monitoring of the growth and tissue development during
function (tube parameter: slope 1.2, zeroVal 3.5). This made a skeleton of    2019. The highest increase in weight and size occurred be-
the cells in 3D but was very sensitive to rough cell shape. Therefore, the
segmented cells were smoothed to eliminate selection artefacts, so that       tween 6 and 10 weeks after catkin formation (WAC), corres-
only main lobes were counted. Finally, the largest empty sphere (LES)         ponding to June 3rd to July 1st, when walnut weight increased
of each cell was calculated with the ‘Thickness’ function of the ImageJ       27 times (from 1.7±0.2 g to 47±4 g) together with length and
plugin BoneJ (Dougherty and Kunzelmann, 2007). 3D reconstruction of           width (Fig. 1A). From WAC 4 to WAC 12, tissue development
all cells (including cell shape descriptors) was done using Amira software    was reconstructed from picture stacks made by SF-M (Fig. 1B;

                                                                                                                                                     Downloaded from https://academic.oup.com/jxb/article/72/13/4744/6272295 by guest on 24 December 2021
(Thermo Fisher Scientific).
                                                                              Supplementary Video S1), which revealed a drastic increase of
                                                                              shell volume in this period (Fig. 1C). In the beginning (WAC
Confocal laser scanning microscopy                                            4–6), the kernel was only present as a small embryo, which ex-
Small pieces of shell tissue were cut out close to the suture and fixed       panded rapidly into the already formed cavity (locule) shaped
and de-coloured according to Pasternak et al. (2015), with minor              by the inner part of the shell (Supplementary Fig. S1), until it
changes to stain cellulose with calcofluor white. Samples were put into
an Eppendorf tube with 1.5 ml of pure MeOH for 20 min at 37 °C.
                                                                              filled this space at WAC 10. In the same week, the shell reached
Afterwards the sample was transferred into 0.8 ml of fresh pure MeOH          its final size and lignification started, initially along the suture
for another 3 min, then 200 µl of dH2O was added in 2 min intervals           from tip to base (Fig. 1C at WAC 10; Fig. 2A).
until reaching 2 ml in total. Following this, samples were washed twice
with dH2O for 5 min each. Samples were then transferred on a glass
slide, stained with one drop of a ready-to-use calcofluor white stain         Cell size and shape changes
solution (Sigma-Aldrich) containing 1 g l–1 calcofluor white M2R and
0.5 g l–1 Evans blue, and then mounted on a TCS SP5 II CLSM (Leica            During the 8 weeks of tissue growth, the cell shapes were ana-
Microsystems). As emission source, a 405 nm UV diode was used, and            lysed by SBF-SEM followed by 3D reconstructions (Fig. 2A,
the detection range was set from 450 nm to 500 nm. Pictures were made         C). This detailed investigation showed a high increase in cell
with the same magnification using a ×40/0.85 objective and a resolution
of 0.2 µm.
                                                                              size during the expansion phase of the walnut (Fig. 2B). Mainly
                                                                              from WAC 6 to WAC 10, cell size increased 13-fold. Cell sur-
                                                                              face area expanded in the same period 8-fold (Supplementary
Confocal Raman microscopy                                                     Fig. S2). According to reconstructions of the SBF-SEM stacks
From small blocks of frozen walnut shells, 20–30 µm thin sections were        (Fig. 2C), cell shape descriptors for 3D development were
cut in the cryostat microtome and transferred on a standard glass slide.      introduced to characterize the transition from small isodia-
Samples were washed several times with dH2O, followed by D2O, and
sealed with nail polish for Raman microscopic measurements. Spectra           metric cells to large polylobate cells.
were acquired from microsections using a confocal Raman microscope               Shape descriptors such as circularity (form factor), solidity,
(alpha300RA, WITec, Ulm, Germany) equipped with a ×100 oil immer-             or convexity exist for 2D pavement cells of A. thaliana (Poeschl
sion objective (NA 1.4, Carl Zeiss, Jena, Germany) and a piezoelectric scan   et al., 2020). To describe the changes of the walnut cells during
stage. A laser (λ=532 nm) was passed through a polarization-preserving        development, we used solidity, which represents the ratio be-
single-mode optical fibre and focused through the objective with a spatial
resolution of 0.3 μm on the sample. The Raman scattering signal was de-       tween cell volume and convex hull volume (Fig. 3A). The so-
tected by a CCD camera (Andor DV401 BV, Belfast, UK) behind a spec-           lidity was 0.84±0.05 at WAC 4 and dropped to 0.61±0.06 at
trometer (600 g mm−1 grating, UHTS 300 WITec, Ulm, Germany). The              WAC 12.
laser power was 40 mW. For measurement set-up, the software Control              Another tool to describe cell shape changes in 2D and 3D is
Four (WITec) was used. Raman analysis was performed with Project              the skeleton of the cell.The cell shape of the 3D model was re-
FOUR (WITec) and Opus 7.5 software (Bruker Optik GmbH, Ettlingen,
Germany). After applying cosmic ray spike removal, Raman chemical im-         duced by the software to the innermost line, and the resulting
ages were generated based on the integration of relevant wavenumber           skeleton endpoints corresponded to the number of main lobes
regions (e.g. CH stretching). The indent was selected, and a non-negative     (Fig. 3B). During morphogenesis, the main lobe number in-
matrix factorization (NMF) was performed in Project FOUR with six             creased steadily from isodiametric cells (2 lobes) to polylobate
basic spectra.                                                                cells with 12±3 lobes.
                                                                                 Turgor pressure causes the cell wall to bulge outwards,
Statistics                                                                    leading to mechanical stress on the cell wall (Cosgrove, 2018).
Data were analysed with the software SigmaPlot 12 (Systat Software, San       In pavement cells of A. thaliana, the largest empty circle (LEC)
Jose, CA, USA) for significant differences between each development           that fits into the cells is used as a proxy for the maximal stress
stage. On all data from the cell segmentation, a Kruskal–Wallis one-way
ANOVA on ranks was performed, followed by Dunn’s method to com-               on the cell wall (Sapala et al., 2018). However, these cells have a
pare all ranks. Significant differences (P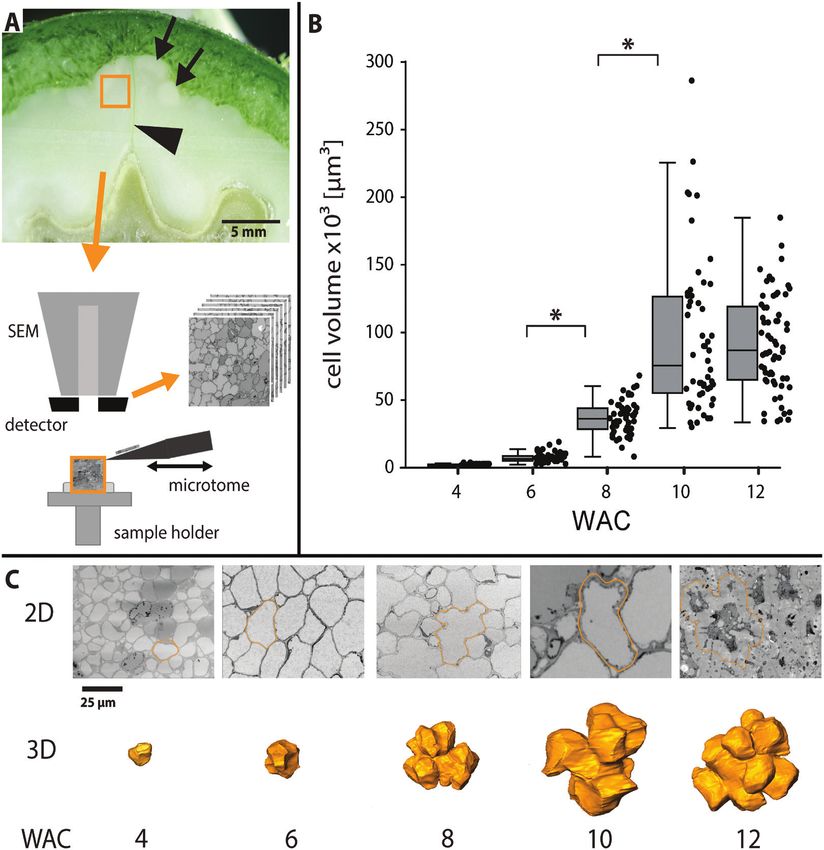
Morphogenesis of the 3D puzzle cells in walnut shells | 4747

                                                                                                                                                              Downloaded from https://academic.oup.com/jxb/article/72/13/4744/6272295 by guest on 24 December 2021

Fig. 1. Walnut fruit development and tissue growth. (A) Fresh weight, length, and width of walnuts sampled from April 30th to September 30th in 1 week
intervals corresponding to 1–23 weeks after catkin formation (WAC). The grey area shows the period chosen for serial face-microtomy (SF-M) (n=5, mean
±SD). (B) Freshly collected walnuts were transferred into the cryostat microtome chamber, sequentially cut, and photographed. (C) 2D segmentation and
3D reconstructions from SF-M cuts showed the development of the kernel, soft shell, lignified shell, and husk. For better visualization, only the area (2D)
and the volume (3D, excluding the kernel) left of the suture are shown. Lignification (orange) started along the suture but also appeared in some areas
away from the suture (arrowhead).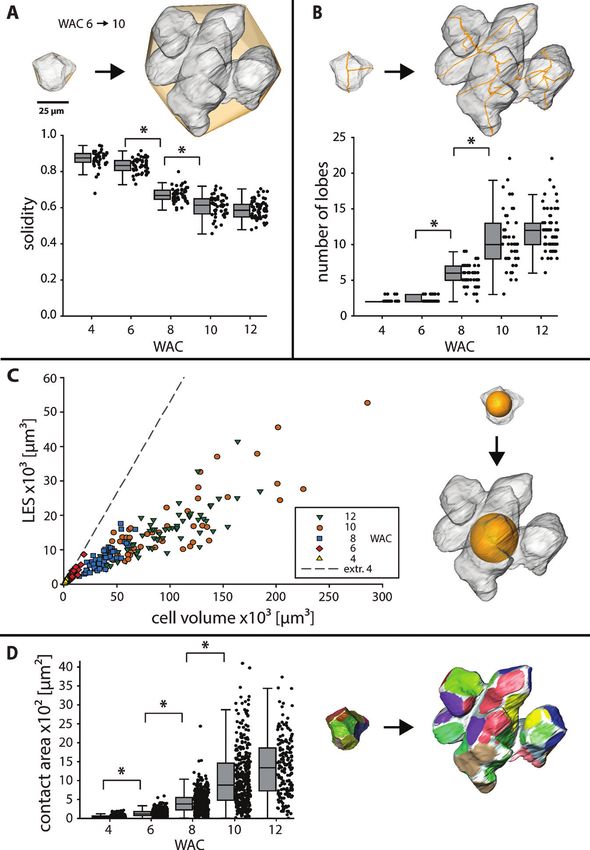
4748 | Antreich et al.

this factor into 3D, we introduced the LES, which describes           acquired from carbohydrates (Supplementary Table S1) using
the biggest sphere that fits into the cell volume (Fig. 3C). With     the orthogonal matching pursuit (Pati et al., 1993). All three
growing cell volume, the LES of the growing walnut cells in-          cell wall components, cellulose, hemicellulose, and pectin, were
creased around three times less by the formation of lobes com-        found to contribute to the cell wall spectra (Supplementary
pared with a hypothetical cell with similar volume but no lobes       Fig. S5A, B).While hemicellulose was modelled in both spectra
(represented by an extrapolation of the cells from WAC 4).            to a similar extent, the first one was strongly influenced by
   With decreasing solidity, the cell became more lobed, which        cellulose (blue, Supplementary Fig. S5A), while in the second
resulted in an increase of the cell surface area per volume.          one pectin was the main contributor (green, Supplementary
Together with the fact that the number of cell neighbours             Fig. S5B). So, the cell wall was more cellulosic in the tip of the
stayed constant during development (Supplementary Fig. S3),           indents whereas the sides of the ICS were pectin rich. From the
cell contact area between neighbouring cells increased steadily       three pectin references with different degrees of esterification

                                                                                                                                             Downloaded from https://academic.oup.com/jxb/article/72/13/4744/6272295 by guest on 24 December 2021
(8-fold) from WAC 6 to WAC 10 (Fig. 3D). 3D reconstruction            (Supplementary Fig. S5C), the one with >85% esterification
of single cells revealed that contact areas became separated by       was chosen by the algorithm. The higher the esterification
intercellular space (ICS), resulting in more but smaller single       the lower the wavenumber of the marker band (856 cm−1 for
areas.                                                                10–34%, 853 cm−1 for >85%, Supplementary Fig. S5C, inset).
                                                                      In the walnut cell wall spectra, the band is at an even lower
                                                                      position at 843 cm−1. On sections collected at WAC 10, higher
Cell wall thickening and cellulose deposition                         pectin accumulation was also found at the corners of the ICS
                                                                      and a high cellulose signal at the indent and along the cell walls
The changes in cellulose deposition were followed during
                                                                      (Supplementary Fig. S4B, C).
the developmental period by staining microsections with
calcofluor white (Fig. 4A). At WAC 8 and 10, loops of cellulose
became visible, also seen by light microscopy before staining
(Supplementary Video S2). Additionally, cell wall thickness of
                                                                      Discussion
single cells in WAC 8 was analysed in detail in SBF-SEM re-           Walnut fruits showed the highest increase in fresh weight be-
constructions. The average thickness was 0.9±0.2 µm, with             tween the end of May and the middle of July (WAC 4–12),
clearly thicker sites at the cell indents (Fig. 4B). By visualizing   which was comparable with other studies on walnut fruit de-
the parts which were thicker than the average cell wall thick-        velopment (Pinney and Polito, 1983; Drossopoulos et al., 1996).
ness (values >0.9 µm), loops of thicker cell wall became vis-         Our investigation focusing on shell development during this
ible (Supplementary Video S3). In WAC 10, the average cell            period revealed distinct changes in cell shape—from small iso-
wall thickness doubled (1.6±0.4 µm); the loops remained, but          diametric cells to large polylobate cells. Between WAC 6 and
were less pronounced due to the thicker walls near the indents        WAC 10, in particular, the cells had the largest volume and
(values >1.6 µm) (Supplementary Fig. S4A; Supplementary               surface increase and formed the lobes.
Video S4).
   To reveal the chemical composition of the native growing           Lobe formation of cells of walnut shell tissue
cell wall, Raman imaging was performed (Gierlinger, 2018).
On freshly cut cross-sections from WAC 8, areas including the         The formation of irregular cell shapes is well studied in model
cell wall of the indents were scanned and, by integrating the         organisms such as A. thaliana (Sampathkumar et al., 2014;
CH stretching region from 2831 cm−1 to 3009 cm−1, all or-             Sapala et al., 2018; Altartouri et al., 2019; Bidhendi et al., 2019)
ganic compounds were visualized (Fig. 4C).To elucidate details        or Zea mays (Apostolakos et al., 1991; Giannoutsou et al., 2013).
on cell wall chemistry, we cropped the region of interest (Fig.       Our findings in walnuts derived from SBF-SEM and Raman
4C, inset) and performed an NMF: an algorithm that finds the          spectroscopy showed features comparable with those found in
spectra of the ‘purest’ components (called endmembers, EMs)           A. thaliana during cell development (Fig. 5A–E). At the be-
and fits the hyperspectral dataset to finally track each compo-       ginning of development, the cell walls between two freshly
nent within the region of interest (Prats-Mateu et al., 2018).        divided cells were straight (Fig. 5A). With advancing age and
The first component (blue) was mainly found in the tips of            size, the cell wall started to undulate, which led to a wavy ap-
the indents, and the second one (green) more on the sides of          pearance of some contact faces to neighbouring cells (Fig. 5B).
the ICS (where the middle lamella is located, Fig. 4C). The           The reason for this undulation could be changes in stiffness of
endmember spectrum of the first component showed bands                the cell wall or changes in pectin composition, as shown by
typical for cellulose at 378, 1095, and 1380 cm−1 (EM1, blue          other authors (Majda et al., 2017; Altartouri et al., 2019; Haas
spectrum), whereas the second one revealed marker bands of            et al., 2020). At the innermost part of the indent, higher stresses
pectin at 843 cm−1 and 1740 cm−1 (EM2, green spectrum, Fig.           caused by turgor pressure most probably arose, similar to find-
4D). The compositions of the two different cell wall spectra          ings in the epidermal cells of A. thaliana (Sapala et al., 2018).
were modelled as a linear combination of reference spectra            Presumably to counteract these stresses, cellulose was deposited
Morphogenesis of the 3D puzzle cells in walnut shells | 4749

                                                                                                                                                        Downloaded from https://academic.oup.com/jxb/article/72/13/4744/6272295 by guest on 24 December 2021

Fig. 2. Change of cell volume and cell shape during lobe formation visualized by SBF-SEM. (A) Small pieces of shell tissue were cut out close to the
suture (arrowhead), fixed, and embedded for SBF-SEM to produce serial cuts. In this cross-section of WAC 10, the shell had already started to lignify
(black arrows). (B) Cell volume based on reconstructions during the growing period (box: 25–75%, whisker: 1.5 IQR, *P
4750 | Antreich et al.
Downloaded from https://academic.oup.com/jxb/article/72/13/4744/6272295 by guest on 24 December 2021
Fig. 3. Cell shape changes in 3D during lobe formation. (A–D) Changes in cell shape descriptors from WAC 6 to WAC 10 illustrated on the same set of
cells (box: 25–75%, whisker: 1.5 IQR, *PMorphogenesis of the 3D puzzle cells in walnut shells | 4751
Downloaded from https://academic.oup.com/jxb/article/72/13/4744/6272295 by guest on 24 December 2021
Fig. 4. Cell wall thickening and cellulose deposition at the indents. (A) MeOH-fixed and de-coloured sections of all developmental stages after calcofluor
white staining showed loops of cellulose all over the tissue at WAC 8 and WAC 10. In WAC 12, only the secondary cell wall towards the lumen is still
unlignified and thus is the only part which was stained. (B) One section of the SBF-SEM stack of WAC 8 located along the black line in the 3D model.
The cell showed lobes due to several indents (arrows). The cell wall was visualized based on the thickness. After removing cell wall elements, which were
thinner than the average cell thickness, loops became visible. (C) Raman imaging of a section: integrating the CH stretching region from 2831 cm−1 to
3009 cm−1 revealed the organic compounds of the cell wall and deposits along the cell wall. A close up of the indent region based on non-negative matrix
factorization (NMF) revealed different cell wall composition on the indent tip (blue) from that on the sides and the opposite side of the ICS (green). (D) The
corresponding endmember spectra from the indents (EM1, blue) showed typical cellulose bands (1380, 1095, and 378 cm−1), while the green endmember
(EM2) had strong marker bands of pectin at 843 cm−1 and 1740 cm−1 (for detailed analysis of the cell wall spectra, see Supplementary Fig. S5).4752 | Antreich et al.
Downloaded from https://academic.oup.com/jxb/article/72/13/4744/6272295 by guest on 24 December 2021
Fig. 5. Possible scenario for lobe formation of cells in walnut shell tissue. (A–E) Representative sections showed the cell wall of neighbouring cells in each
developmental stage from SBF-SEM (same scaling), a 2D sketch, and a 3D visualization of the same area. (A) After cell division, the cell wall was straight
and cell expansion should be still weak (thickness of arrows represents expansion speed and direction). (B) The cell expanded further, and the cell wall
started to undulate, causing different expansion directions of the neighbouring cells. (C) Due to higher cell wall stresses at the curved section of the right
cell, cellulose was deposited and the thickness increased at this location. The cell expanded further but less strongly at this position, and an indent started
to form. A small intercellular space (ICS) is created, first filled completely. The opposite cell expanded off-plane and formed another loop of wall thickening.
(D) Later during cell growth, the ICS became bigger and showed an open space, sometimes additionally protrusions. The whole cell wall became richer in
cellulose and cells expanded less. (E) Finally, secondary cell wall was deposited, and the primary cell wall was lignified, which stopped the cell expansion.Morphogenesis of the 3D puzzle cells in walnut shells | 4753
(2018) in A. thaliana, where it was found that tip regions of Finally, cell expansion and lobe formation ended with the
indents expand more slowly than the side regions. onset of secondary cell wall formation and incorporation of
In our study, we assumed that the restriction of expansion was lignin into the primary cell wall, indicated by a darker staining
so strong that cell–cell contacts were lost at the indents. SBF- in SEM pictures (Fig. 5E), and was confirmed in previous
SEM stacks revealed dark stained materials before the ICS was studies (Antreich et al., 2019; Xiao et al., 2020). As lignification
formed (Fig. 4B). Iwai et al. (1999) showed in his study with in walnut started along cell corners and at the net-like ICS
carrot callus that ruthenium red forms a highly electron-dense (Xiao et al., 2020), this network between the cells may play a
product with de-methylesterified pectins in the cell corners. role in facilitating the distribution of enzymes and components
Later, when the ICS opened completely and the contact with involved in lignification all over the shell.
the adjacent cell wall was lost, this dark stained material was
visible at the edges close to the middle lamella (Fig. 5D). At Lobed cell shape is beneficial for stress resistance on
Downloaded from https://academic.oup.com/jxb/article/72/13/4744/6272295 by guest on 24 December 2021
the same locations, Raman images revealed higher concentra- the cell and tissue level
tions of pectin (Fig. 4C). Based on the band at 1740 cm−1 [as-
signed to C=O stretching of COOH (Synytsya et al., 2003)], the The change from isodiametric to polylobate cells happened
low position of the pectin marker band at 843 cm−1 (Fig. 4D), mainly within 4 weeks. All shape descriptors changed sig-
and the best match with the highly esterified pectin reference nificantly within this period. More lobes were formed (more
(Supplementary Fig. S5C), we conclude that this was pectin skeleton endpoints) and became more pronounced (reduced
with high esterification of the side groups. Bichara et al. (2016) solidity), which led to a drastic increase in contact area to
reported the band at 837 cm−1 in citrus peel with a degree of neighbouring cells. As shown in seeds of Portulaca oleracea, the
esterification of 76%, and Synytsya et al. (2003) showed the band wavy suture interface between neighbouring cells of the seed
to decrease with methylation (minimum 850 cm−1) and increase coat increases overall strength and fracture toughness compared
with acetylation (maximum 862 cm−1). In general, pectin not with straight cell interfaces (Gao et al., 2018). In the same way,
only holds the cells together via the middle lamella but also con- the interlocking of the polylobate sclereid cells in walnut led to
trols the separation of cells (Daher and Braybrook, 2015) and, high values in tensile and compression tests on the tissue level,
at cell corners and along the ICS in particular, turgor-mediated when compared with cells in pine seed tissue, which consists
forces are highest (Jarvis, 1998). Other studies showed that at of isodiametric cells (no lobes and no net-like ICS) almost
these locations high amounts of the highly de-methylesterified representing the shape of a tetrakaidecahedron (Antreich et al.,
homogalacturonan are present and increase the viscosity of the 2019; Huss et al., 2020).
cell wall matrix via Ca2+ bridges and delimit cell wall separ- On the cellular level, lobed cells kept their LES low during de-
ation and ICS formation (Knox et al., 1990; Parker et al., 2001; velopment to reduce high stresses on the cell wall, analogous to
Giannoutsou et al., 2013; Sotiriou et al., 2018). epidermal cells in A. thaliana (Sapala et al., 2018). So, the polylobate
However, in walnut, the stiff restrictions and the ongoing cell cell shape could have two functions: on the one hand, it reduces
expansion formed a new ICS all along the cells, which is more internal stresses on the cell wall during development; on the other
analogous to mesophyll tissue of Z. mays (Giannoutsou et al., hand, it increases tensile and compression strength of the whole
2013) or Vigna sinensis (Sotiriou et al., 2016) than to epidermal mature shell tissue. Models derived from plant samples show that
tissue, where cell–cell contact is continuous (Sotiriou et al., cell size and shape with its mechanical constraints influence tissue
2018). In mesophyll cells of Z. mays, cellulose deposition is growth in 2D (Sapala et al., 2018) and 3D (Bassel et al., 2014).
parallel to the orientation of cortical microtubules, which form Additionally, the morphogenesis of such shell tissues is controlled
ring-like thickenings around the whole cell perpendicular to inter alia by physical forces of the surrounding tissue (Landrein and
the leaf axis (Apostolakos et al., 1991). It is shown that during Ingram, 2019). As shown in A. thaliana seeds, the pressure of the
tissue expansion, cells become lobed due to cellulose deposi- endosperm and the restriction of the seed coat affect microtubule
tions, and the resulting ICS becomes continuously bigger. The orientation and cell wall thickening of mechanosensitive cells
same mechanism for lobe formation could be proposed for (Creff et al., 2015; Beauzamy et al., 2016). In the case of the walnut,
cells of the walnut shell, but, in contrast to Z. mays, the loops of mechanical interactions may derive from the expanding embryo
cell wall thickenings were not orientated but randomly distrib- and the restricting husk, forcing the area in between the cells of
uted. Therefore, each individual cell shaped and was shaped by the shell to interlock. So, using only one cell type may simplify the
other cells when they expanded into new ICS between cells, coordination of growth of the tissue compared with shells with a
where the walls exhibited less resistance. This probably led to layered arrangement of different tissues, as found for example in
the observed variability of cell shapes in the shell tissue and the macadamia (Schüler et al., 2014), which probably make the coord-
network-like appearance of the ICS (Supplementary Fig. S6). ination of growth more complicated. Under these assumptions, it
As development proceeded, cellulose was deposited along the would be interesting to use our data to create 3D finite element
whole cell wall, reducing the local variability in thickness and models on the cellular level to shed more light on the morpho-
therefore the loops became less pronounced. genesis of the whole walnut shell tissue.4754 | Antreich et al.
New insights into walnut development due to 3D Video S2. Cell wall thickenings in unstained tissue of walnut
visualization from WAC 8.
Video S3. 3D reconstruction of a single cell from WAC 8
SF-M and SBF-SEM are promising tools to study the mor- showing cell thickenings along the indents.
phogenesis of plant organs and tissues in 3D. In our study, Video S4. 3D reconstruction of a single cell from WAC 10
SF-M is a simple and cheap tool to give insights into young showing cell thickenings along the indents.
and soft tissues, where X-ray computed tomography methods Video S5. SBF-SEM micrograph stack and 3D reconstruc-
reach their limitation regarding the loss of contrast due to tion of a cell wall indent from WAC 8.
water content and loss of sharpness due to movements of the
sample (Kuroki et al., 2004; Kaminuma et al., 2008). With
samples showing differently coloured tissues, in particular, Acknowledgements
the coloured pictures unfold their full potential. In contrast,
Downloaded from https://academic.oup.com/jxb/article/72/13/4744/6272295 by guest on 24 December 2021
SBF-SEM gives insights into cell organization with impres- The authors thank the whole BIONAMI group for all their help and
sively high resolution. Studies on microtubules of the mitotic comments.We also thank Karl Refenner for giving us access to the walnut
spindle in human cells (Nixon et al., 2017) or on endoplasmic tree in the horticultural garden of BOKU, Vienna. Thanks to Ingeborg
Lang for critical reading of the manuscript, and to Elsa Arcalis and
reticulum organization in Z. mays (Arcalís et al., 2020) are
Ulrike Hörmann-Dietrich for providing chemicals and lab space for the
the new trend in 3D ultrastructure investigation (Smith and SBF-SEM sample preparation. The authors acknowledge funding from
Starborg, 2019). Also, in this study, SBF-SEM allowed us to the European Research Council (ERC) under the European Union’s
analyse for the first time the shape transformation of the 3D Horizon 2020 research and innovation programme grant agreement no.
sclereid puzzle cells in walnut shell tissue. Furthermore, com- 681885 and the HSRM Project NANOBILD for infrastructure support.
plex structures like the ICS network can be visualized in 3D
in more detail than by using casting methods (Prat et al., 1997)
and this is independent of gas-filled space needed for X-ray Author contributions
computed tomography scans (Kuroki et al., 2004). Further,
SJA and NG: conceptualization; SJA and NX: methodology; SJA and
SBF-SEM could be of great interest in the study of cell de-
NX: investigation; SJA: writing—original draft, SJA; XN, JCH, and NG:
velopment in A. thaliana to establish life-like 3D models to writing—review and editing; SJA: visualization; NG: funding acquisition
better understand the role of periclinal walls in the formation and supervision.
of undulating cell walls (Majda et al., 2017, 2019; Bidhendi
et al., 2019).
Finally, the combined use of state-of-the art 3D character- Conflict of interest
ization and microspectroscopic methods will shed new light The authors declare no conflict of interest.
on still open questions, such as the stiffness differences at the
beginning of cell wall undulation or the distribution of micro-
tubules during lobe formation. Revealing the whole formation Data availability
process of the 3D sclereid puzzle cells in walnut and com- The data supporting the findings of this study are available from the cor-
paring it with shells of other nuts will help us to understand responding author, Sebastian J. Antreich, upon request.
the general concept of shell morphogenesis in plants.
References
Altartouri B, Bidhendi AJ, Tani T, Suzuki J, Conrad C, Chebli Y, Liu N,
Supplementary data Karunakaran C, Scarcelli G, Geitmann A. 2019. Pectin chemistry and
cellulose crystallinity govern pavement cell morphogenesis in a multi-step
The following supplementary data are available at JXB online. mechanism. Plant Physiology 181, 127–141.
Fig. S1. Visualization of the walnut kernel in the already Antreich SJ, Xiao N, Huss JC, Horbelt N, Eder M, Weinkamer R,
formed cavity in 2D and 3D. Gierlinger N. 2019. The puzzle of the walnut shell: a novel cell type with
Fig. S2. Increase of cell surface from WAC 4 to WAC 12. interlocked packing. Advanced Science 6, 1900644.
Fig. S3. Number of neighbouring cells during lobe formation. Apostolakos P, Galatis B, Panteris E. 1991. Microtubules in cell morpho-
genesis and intercellular space formation in Zea mays leaf mesophyll and
Fig. S4. Raman imaging analysis of the indents at WAC 10. Pilea cadierei epithem. Journal of Plant Physiology 137, 591–601.
Fig. S5. Modelling of the identified cell wall spectra. Arcalís E, Hörmann-Dietrich U, Zeh L, Stoger E. 2020. 3D electron
Fig. S6. 3D reconstruction of the ICS around a single cell microscopy gives a clue: maize zein bodies bud from central areas of ER
in WAC 12. sheets. Frontiers in Plant Science 11, 1–7.
Table S1. List of reference compounds used for NMF Baskin TI. 2005. Anisotropic expansion of the plant cell wall. Annual Review
of Cell and Developmental Biology 21, 203–222.
analysis.
Bassel GW, Stamm P, Mosca G, Barbier de Reuille P, Gibbs DJ,
Video S1. SF-M picture stack and 3D reconstruction of a Winter R, Janka A, Holdsworth MJ, Smith RS. 2014. Mechanical
walnut from WAC 6. constraints imposed by 3D cellular geometry and arrangement modulateMorphogenesis of the 3D puzzle cells in walnut shells | 4755
growth patterns in the Arabidopsis embryo. Proceedings of the National Kierzkowski D, Routier-Kierzkowska AL. 2019. Cellular basis of
Academy of Sciences, USA 111, 8685–8690. growth in plants: geometry matters. Current Opinion in Plant Biology 47,
Beauzamy L, Fourquin C, Dubrulle N, Boursiac Y, Boudaoud A, 56–63.
Ingram G. 2016. Endosperm turgor pressure decreases during early Knox JP, Linstead PJ, King J, Cooper C, Roberts K. 1990. Pectin
Arabidopsis seed development. Development 143, 3295–3299. esterification is spatially regulated both within cell walls and between
Bichara LC, Alvarez PE, Fiori Bimbi MV, Vaca H, Gervasi C, developing tissues of root apices. Planta 181, 512–521.
Brandán SA. 2016. Structural and spectroscopic study of a pectin isolated Kuroki S, Oshita S, Sotome I, Kawagoe Y, Seo Y. 2004. Visualization of
from citrus peel by using FTIR and FT-Raman spectra and DFT calculations. 3-D network of gas-filled intercellular spaces in cucumber fruit after harvest.
Infrared Physics and Technology 76, 315–327. Postharvest Biology and Technology 33, 255–262.
Bidhendi AJ, Altartouri B, Gosselin FP, Geitmann A. 2019. Mechanical Lampugnani ER, Kahn GA, Somssich M, Staffan P. 2018. Building a
stress initiates and sustains the morphogenesis of wavy leaf epidermal cells. plant cell wall at a glance. Journal of Cell Science 131, jcs207373.
Cell Reports 28, 1237–1250. Landrein B, Ingram G. 2019. Connected through the force: mechan-
Bidhendi AJ, Geitmann A. 2016. Relating the mechanics of the pri- ical signals in plant development. Journal of Experimental Botany 70,
Downloaded from https://academic.oup.com/jxb/article/72/13/4744/6272295 by guest on 24 December 2021
mary plant cell wall to morphogenesis. Journal of Experimental Botany 67, 3507–3519.
449–461. Majda M, Grones P, Sintorn IM, et al. 2017. Mechanochemical polariza-
Cosgrove DJ. 2018. Diffuse growth of plant cell walls. Plant Physiology tion of contiguous cell walls shapes plant pavement cells. Developmental
176, 16–27. Cell 43, 290–304.e4.
Creff A, Brocard L, Ingram G. 2015. A mechanically sensitive cell layer Majda M, Krupinski P, Jönsson H, Hamant O, Robert S. 2019.
regulates the physical properties of the Arabidopsis seed coat. Nature Mechanical asymmetry of the cell wall predicts changes in pavement cell
Communications 6, 6382. geometry. Developmental Cell 50, 9–10.
Daher FB, Braybrook SA. 2015. How to let go: pectin and plant cell ad- Marry M, Roberts K, Jopson SJ, Huxham IM, Jarvis MC, Corsar J,
hesion. Frontiers in Plant Science 6, 523. Robertson E, McCann MC. 2006. Cell–cell adhesion in fresh sugar-beet
Daher FB, Chen Y, Bozorg B, Clough J, Jönsson H, Braybrook SA. root parenchyma requires both pectin esters and calcium cross-links.
2018. Anisotropic growth is achieved through the additive mechanical effect Physiologia Plantarum 126, 243–256.
of material anisotropy and elastic asymmetry. eLife 7, e38161. Nixon FM, Honnor TR, Clarke NI, Starling GP, Beckett AJ,
Dougherty R, Kunzelmann K-H. 2007. Computing local thickness of 3D Johansen AM, Brettschneider JA, Prior IA, Royle SJ. 2017. Microtubule
structures with ImageJ. Microscopy and Microanalysis 13, 1678–1679. organization within mitotic spindles revealed by serial block face scanning
electron microscopy and image analysis. Journal of Cell Science 130,
Drossopoulos JB, Kouchaji GG, Bouranis DL. 1996. Seasonal dy- 1845–1855.
namics of mineral nutrients by walnut tree fruits. Journal of Plant Nutrition
19, 435–455. Paredez AR, Somerville CR, Ehrhardt DW. 2006. Visualization of cel-
lulose synthase demonstrates functional association with microtubules.
Elsner J, Lipowczan M, Kwiatkowska D. 2018. Differential growth Science 312, 1491–1495.
of pavement cells of Arabidopsis thaliana leaf epidermis as revealed by
microbead labeling. American Journal of Botany 105, 257–265. Parker CC, Parker ML, Smith AC, Waldron KW. 2001. Pectin distribu-
tion at the surface of potato parenchyma cells in relation to cell–cell adhe-
Gao C, Hasseldine BPJ, Li L, Weaver JC, Li Y. 2018. Amplifying strength, sion. Journal of Agricultural and Food Chemistry 49, 4364–4371.
toughness, and auxeticity via wavy sutural tessellation in plant seedcoats.
Advanced Materials 30, e1800579. Pasternak T, Tietz O, Rapp K, Begheldo M, Nitschke R, Ruperti B,
Palme K. 2015. Protocol: an improved and universal procedure for whole-
Giannoutsou E, Sotiriou P, Apostolakos P, Galatis B. 2013. Early local mount immunolocalization in plants. Plant Methods 11, 50.
differentiation of the cell wall matrix defines the contact sites in lobed meso-
phyll cells of Zea mays. Annals of Botany 112, 1067–1081. Pati YC, Rezaiifar R, Krishnaprasad PS. 1993. Orthogonal matching
pursuit: recursive function approximation with applications to wavelet de-
Gierlinger N. 2018. New insights into plant cell walls by vibrational composition. In: Proceedings of the 27th Asilomar Conference on Signals,
microspectroscopy. Applied Spectroscopy Reviews 53, 517–551. Systems & Computers 40–44.
Gonzalez N, Vanhaeren H, Inzé D. 2012. Leaf size control: complex Peaucelle A, Wightman R, Höfte H. 2015. The control of growth symmetry
coordination of cell division and expansion. Trends in Plant Science 17, breaking in the Arabidopsis hypocotyl. Current Biology 25, 1746–1752.
332–340.
Pinney K, Polito VS. 1983. English walnut fruit growth and development.
Gutierrez R, Lindeboom JJ, Paredez AR, Emons AM, Ehrhardt DW. Scientia Horticulturae 21, 19–28.
2009. Arabidopsis cortical microtubules position cellulose synthase delivery
to the plasma membrane and interact with cellulose synthase trafficking Poeschl Y, Möller B, Müller L, Bürstenbinder K. 2020. User-friendly as-
compartments. Nature Cell Biology 11, 797–806. sessment of pavement cell shape features with PaCeQuant: novel functions
and tools. Methods in Cell Biology 160, 349–363.
Haas KT, Wightman R, Meyerowitz EM, Peaucelle A. 2020. Pectin
homogalacturonan nanofilament expansion drives morphogenesis in plant Prat R, André JP, Mutaftschiev S, Catesson AM. 1997. Three-
epidermal cells. Science 367, 1003–1007. dimensional study of the intercellular gas space in Vigna radiata hypocotyl.
Protoplasma 196, 69–77.
Huss JC, Antreich SJ, Bachmayr J, Xiao N, Eder M, Konnerth J,
Gierlinger N. 2020. Topological interlocking and geometric stiffening as Prats-Mateu B, Felhofer M, de Juan A, Gierlinger N. 2018. Multivariate
complementary strategies for strong plant shells. Advanced Materials 32, unmixing approaches on Raman images of plant cell walls: new insights or
e2004519. overinterpretation of results? Plant Methods 14, 52.
Iwai H, Kikuchi A, Kobayashi T, Kamada H, Satoh S. 1999. High levels Rueden CT, Schindelin J, Hiner MC, DeZonia BE, Walter AE,
of non-methylesterified pectins and low levels of peripherally located pec- Arena ET, Eliceiri KW. 2017. ImageJ2: ImageJ for the next generation of
tins in loosely attached non-embryogenic callus of carrot. Plant Cell Reports scientific image data. BMC Bioinformatics 18, 529.
18, 561–566. Sampathkumar A, Krupinski P, Wightman R, Milani P, Berquand A,
Boudaoud A, Hamant O, Jönsson H, Meyerowitz EM. 2014. Subcellular
Jarvis MC. 1998. Intercellular separation forces generated by intracellular
and supracellular mechanical stress prescribes cytoskeleton behavior in
pressure. Plant, Cell & Environment 21, 1307–1310.
Arabidopsis cotyledon pavement cells. eLife 3, e01967.
Kaminuma E, Yoshizumi T, Wada T, Matsui M, Toyoda T. 2008. Sapala A, Runions A, Routier-Kierzkowska AL, et al. 2018. Why
Quantitative analysis of heterogeneous spatial distribution of Arabidopsis plants make puzzle cells, and how their shape emerges. eLife 7,
leaf trichomes using micro X-ray computed tomography. The Plant Journal e32794.
56, 470–482.4756 | Antreich et al.
Schüler P, Speck T, Bührig-Polaczek A, Fleck C. 2014. Structure–func- pavement cells: its possible involvement in the flexibility of cell shape. Plant
tion relationships in Macadamia integrifolia seed coats—fundamentals of Biology 20, 223–237.
the hierarchical microstructure. PLoS One 9, e102913. Synytsya A, Čopíková J, Matějka P, Machovič V. 2003. Fourier trans-
Smith D, Starborg T. 2019. Serial block face scanning electron mi- form Raman and infrared spectroscopy of pectins. Carbohydrate Polymers
croscopy in cell biology: applications and technology. Tissue & Cell 57, 54, 97–106.
111–122.
Vőfély RV, Gallagher J, Pisano GD, Bartlett M, Braybrook SA. 2019.
Sotiriou P, Giannoutsou E, Panteris E, Apostolakos P, Galatis B. Of puzzles and pavements: a quantitative exploration of leaf epidermal cell
2016. Cell wall matrix polysaccharide distribution and cortical microtubule shape. New Phytologist 221, 540–552.
organization: two factors controlling mesophyll cell morphogenesis in land
Xiao N, Bock P, Antreich SJ, Staedler YM, Schönenberger J,
plants. Annals of Botany 117, 401–419.
Gierlinger N. 2020. From the soft to the hard: changes in microchemistry
Sotiriou P, Giannoutsou E, Panteris E, Galatis B, Apostolakos P. during cell wall maturation of walnut shells. Frontiers in Plant Science 11,
2018. Local differentiation of cell wall matrix polysaccharides in sinuous 466.
Downloaded from https://academic.oup.com/jxb/article/72/13/4744/6272295 by guest on 24 December 2021You can also read