A 100%renewable gas mix in 2050? - STUDY SUMMARY GAS INDEPENDENCE IN FRANCE IN 2050 - GRTgaz
←
→
Page content transcription
If your browser does not render page correctly, please read the page content below
GAS INDEPENDENCE IN FRANCE IN 2050

A 100%renewable gas mix in 2050?
             STUDY SUMMARY
This document is published by ADEME

ADEME
20, avenue du Grésillé
BP 90406 | 49004 Angers Cedex 01 FRANCE
Contract number: 16MAR000891

The study was initiated by ADEME and GRDF; it was jointly managed
by ADEME, GRDF and GRTgaz, and coordinated by ADEME: Guillain
Chapelon (GRDF), Emmanuel Combet (ADEME), David Marchal (ADEME),
Laurent Meunier (ADEME), Ony Rabetsimamanga (GRDF), Alban Thomas
(GRTgaz), Anne Varet (ADEME), Isabelle Vincent (ADEME)

Study completion was entrusted to a consortium comprising
SOLAGRO and AEC and coordinated by SOLAGRO:
Quentin Bouré (AEC conseil), Marc Cherrey (AEC),
Florian Coupé (AEC conseil), Christian Couturier (SOLAGRO),
Simon Métivier (SOLAGRO)

Various experts were appointed as members of the steering committee
or contributed to the work: Loïc Antoine (ADEME), Marc Bardinal
(ADEME), Guillaume Bastide (ADEME), Luc Bodineau (ADEME), Valérie
Bosso (GRDF), David Canal (ADEME), Alice Chiche (ARTELYS), Aicha El
Khamlichi (ADEME), Sylvain Frédéric (GRDF), Bruno Gagnepain (ADEME),
Catherine Leboul-Proust (GRDF), Stéphanie Legrand (GRDF), Philippe
Madiec (GRTgaz), Arnaud Mainsant (ADEME), Sabra Meradi (GRTgaz),
William Monin (GRDF), Jean-Michel Parrouffe (ADEME), Jean-Christophe
Pouet (ADEME), Bertrand de Singly (GRDF), Olivier Théobald (ADEME), Éric
Vidalenc (ADEME)

Graphic creation: Créapix

Printing: Printed in France
on FSC Mixte paper, European Ecolabel certified
Frazier printing - ISO 14001 certified

This work is available on-line at www.ademe.fr/mediatheque

Brochure ref. 010521
ISBN: 979-10-297-1055-1 - January 2018
Legal registration: ©ADEME Éditions, January 2018
Any full or partial representation or reproduction made without the consent of the author or its beneficiaries
or successors in title is considered illegal under the terms of the French intellectual property code (Art L 122-4)
and constitutes a counterfeit offence punishable under criminal law. Art L 122-5 only permits copies or
reproductions that are strictly reserved for the personal use of the copier and not for collective use, and any
analyses and short citations justified by the critical, pedagogical or informative nature of the work in which
they are inserted, subject to compliance with the provisions of articles L 122-10 to L 122-12 of the afore-
mentioned code on reprographic reproduction.

A 100% RENEWABLE GAS MIX IN 2050?
STUDY SUMMARY

                            EDITORIAL
                            The fight against climate change, according to the ambitions adopted by the
                            Paris agreement, relies on the success of the energy transition. France has made
                            commitments to reduce its greenhouse gas emissions on world-wide, European
                            and national levels. France Climate Plan, initiated in July 2017 by Nicolas Hulot,
                            France’s Minister of the Ecological and Inclusive Transition, re-affirmed the
                            proactive strategy for the energy transition with ambitious objectives, such as
                            achieving carbon neutrality by 2050.

                            ADEME has been contributing since 2013                  Aside from observing that there is a theoretical
                            through regular publications of energy-                 potential source of renewable gas that could
                            climate scenarios. To update these scenarios            exceed the level of demand proposed for
                            and broaden the scope of discussions,                   2050 by ADEME's 2035-2050 energy-climate
                            more exploratory prospective studies are                scenario, a number of conditions to achieve
                            carried out to assess options with more                 100% renewable gas by 2050 have also
                       an
                   o

    ©J
         . Ch
                is c        open hypotheses on certain specific vectors             been identified. Although these ambitious
                            or industries. The purpose is to identify               results encourage immediate, accelerated
                            possibilities, not to propose a public policy           deployment of agricultural anaerobic
                            scenario. This then enables all those involved          digestion projects, they also highlight the
                            to reconsider these options and to redefine             importance of optimising the use of biomass
                            their perception of the future to build shared          sources by improving the balance between
                            visions of tomorrow.                                    the different energy vectors (heat, electricity
                            This study about a 100% renewable gas mix by            or gas). This confirms that to improve the
                            2050 follows several publications released in           sustainability of our energy system, we must
                            2016 and 2017 with regards to the evolution of          strengthen the interactions between the
                            the energy mix, and is focussed on the second           energy vectors and optimise their synergies,
                            most consumed grid energy in France, which              at various territorial scales. These findings
                            is gas. ADEME, in an effective collaboration            will help to update the ADEME energy-climate
                            with GRDF and GRTgaz, has explored the                  scenario in 2019.
                            technical and economic feasibility of 100%
                            renewable gas in 2050, based on ADEME's
                                                                                    Bruno LECHEVIN
                            2035-2050 energy-climate scenario. This
                            document does not provide a roadmap to
                            achieve 100% renewable gas by 2050; it
                            explores the conditions of feasibility and
                            obstacles of such an ambition. The results are
                            therefore based on sensitivity analyses and
                            various hypotheses regarding the renewable
                            gas production mix.

                                              A 100% renewable gas mix in 2050? – Technical/economic feasibility study    PAGE 1
CONTENTS
1. Context and objectives ............................................................................................................................... 3
2. Study process ................................................................................................................................................................................................ 4
3. Results ................................................................................................................................................................................................................................................. 5
3.1. A theoretical potential of 460 TWh of renewable gas.................................................................. 5
3.2. Gas demand from 276 to 361 TWh in 2050
could be met by renewable gas
in the four scenarios studied…............................................................................................................................................. 6
3.3. … for an overall cost of 100% renewable gas
between €116 and 153/MWh….............................................................................................................................................. 8
3.4. … enabling the avoidance of direct emissions of approximately
63 MtCO2/year......................................................................................................................................................................................................... 8
4. Findings ........................................................................................................................................................................................................................................ 9
4.1. A gas system compatible with 100% renewable gas,
with necessary evolutions.............................................................................................................................................................. 9
4.2. The complementarity of the gas network with the electric grid
represents a key success factor for
a highly renewable energy mix.............................................................................................................................................. 9
5. Limits and perspectives .................................................................................................................... 10
6. Method and hypotheses ................................................................................................................... 10
6.1. The gas demand scenario in 2050............................................................................................................................... 11
ssessment of potential renewable gas production...............................................................13
6.2. A
6.3. Assessment of grid adaptation......................................................................................................................................... 16
PAGE 2 A 100% renewable gas mix in 2050? – Technical/economic feasibility study1. CONTEXT AND OBJECTIVES
After an initial study carried out by ADEME on This is a prospective technical study and not a
the role of renewable electricity in the energy political scenario.
mix – which revealed notably that a very The energy efficiency improvements and
high level of renewable electricity could be reduction in energy demand used in this
envisaged in technical and economic terms – study are those indicated in the ADEME
this study focussed on the second most 2035-2050 energy-climate scenario update (1).
consumed grid energy: the gas vector. The total demand in 2050 for mains gas is
In this period of great importance to the therefore around 300 TWh, compared with
energy transition, this work carried out today’s figure, 460 TWh.
in collaboration by ADEME, GRDF and The main goal of this study is to analyse
GRTgaz contributes to the discussions the conditions of technical and economic
centred on France's proactive strategy feasibility of a gas system based entirely
to reduce its CO2 emissions while (100%) on renewable gas by 2050. It aims to
controlling its energy consumption answer the following questions:
and developing renewable energies.
How much renewable or recoverable gas could be available in 2050 in mainland
France? Would this be enough to satisfy the demand for gas every day and
throughout the network?
What changes would have to be made to the networks or production industries?
What are the constraints and what technical flexibility is available?
What would be the impact on the average cost of gas delivered?
Study scope:
• The study is centred on mainland France: the • This study does not identify the roadmap
resources are national and the possibilities from now until 2050;
of importing renewable gas are not included; • This study does not aim to optimise the
• The study concentrates on mains gas: it does overall energy system (all vectors, all
not look into all the potentials for usage usages).
increase outside the renewable gas network
(e.g.: biogas co-generation) or via third
party infrastructures (e.g.: decentralised
hydrogen production/consumption or
dedicated network) (2);
(1) http://www.ademe.fr/actualisation-scenario-energie-climat-ademe-2035-2050. Hereinafter, this document will be referred to as "ADEME's
2035-2050 energy-climate scenario".
(2) However, it does not exclude the possibility of a certain proportion of direct injection of hydrogen into the gas networks.
A 100% renewable gas mix in 2050? – Technical/economic feasibility study PAGE 32. STUDY PROCESS
The study was implemented as follows
(see figure 1 and details in paragraph 6 - Methods and hypotheses)
1- The theoretical potentials of available 3- Four scenarios were defined to assess
renewable resources corresponding to different hypotheses, particularly with
three production sectors were assessed: respect to the resources:
• "100% R&REn" (Renewable and
ANAEROBIC Production of methane Recovered Energies): biomass and
DIGESTION using micro-organisms that resource usages are similar to ADEME's
break down organic matter
2035-2050 scenario, substituting some of
the wood and heat co-generation usages
Production of methane with gas;
PYRO- from organic matter, • "100% R&REn with high
GASIFICATION mainly wood, via a thermo-
chemical process pyrogasification": the same as 100%
R&REn, but gas usage is enhanced, by
increasing the production of renewable
Production of methane by gas by pyrogasification using wood
electrolysing water using
renewable electricity and resources made available by the
POWER-TO-GAS
then methanation of the lesser development of wood-fired co-
hydrogen produced in the generation and wood for heat networks.
presence of carbon dioxide
This scenario corresponds to a higher
demand for gas;
These production sectors are described in • "100% R&REn with limited biomass
paragraph 6.2.1. for gas usages": the same as 100%
This assessment of the potential of R&REn but with biomass resources
available resources takes into account limited to 80% of their potential. The
durability criteria (3). objective is to assess the impact of
resource mobilisation difficulties (e.g.
2-
Starting from the slightly adjusted
under-estimated environmental impacts
demand of ADEME's 2035-2050 scenario,
or social acceptability, etc.) and/or
the production mix was estimated,
development difficulties of the less
mobilising the production sectors in
mature sectors;
increasing order of cost, while including the
• "75% R&REn": biomass and resource
necessary adaptation of the gas network.
usages are similar to ADEME's 2035-2050
scenario, natural gas represents 25% of
final energy consumption.
FIGURE 1: STUDY METHODOLOGY
Prospective Description of the resource
framework of ADEME potential per input
(2017 update) • Geographic distribution
Gas demand
• Procurement costs
Balance of • Transformation costs
supply/
ACTUALISATION DU SCÉNARIO ÉNERGIE-CLIMAT
ADEME 2035-2050 demand
over one year
Mobilisation in
increasing order of cost
Demand
that is
Four GAS 2050 scenarios localised
(3) In particular, specific energy
depending on: in space and TOTAL
crops are excluded and time
the resources used are • Resource usage arbitration Assessment of COST
network + OF THE GAS
not in competition with • Resource limitation / sector
storage costs
"raw material' usages • % R&REn in the gas mix SYSTEM
(agriculture, forest, wood
industry and biomaterials).
PAGE 4 A 100% renewable gas mix in 2050? – Technical/economic feasibility study3. RESULTS
3.1. A theoretical potential of 460 TWh of renewable gas
700 AVAILABILITY AND POTENTIAL PRODUCTION
FIGURE 2: RESOURCE
Power-to-gas (b) TWh
'By-product' hydrogen 600
methanation
Electrolysis
Electricity
Solid Recovered Fuels (a)
Wood waste (a) 500
Non-forest wood (a)
Pyrogasification methanation
Electrolysis
Sawmill / black liquor related (a) 400 Recovery
Wood from forests (a)
Pyrogasification
Crop residues 300
Intermediary crops
Biomass
Grass
200
Farm animal dejections
Food-processing industry residues
Anaerobic
Anaerobic
digestion
digestion
100
Biowaste
Seaweed
0
input type resource sector
Energy in HCV, except (a) in LCV and (b) electricity. Primary type
resources { Injectable
available Primary resources gas
in 2010 available in 2050 2050
The total potential of renewable implies new practices and organisations for
primary resources liable to produce gas agriculture and forests. Biomass resources
is approximately 620 TWh. It is not in represent almost 390 TWh, 230 TWh of which
competition with "raw material" (agriculture, come from wood and its derivatives, 130 TWh
forest, wood industry and biomaterials) and from agriculture, 15 TWh from biowaste and
food usages, which remain priority. food-processing industries and 14 TWh from
This is available potential before any seaweed. Electricity contributes 205 TWh.
allocation to competing energy usages (e.g. Recovered energies represent a little under
energy wood can be used in a boiler), and 25 TWh.
it incorporates durability criteria (specific Taking into account conversion efficiency, the
energy crops are therefore excluded) (4). theoretical potential of primary resources
Compared with the resources currently identified could produce up to 460 TWhHCV
(2010) mobilised for energy production and of injectable renewable gas:
potentially convertible into gas, the 2050 •
30% could be supplied by the mature
estimated potential is much higher, which anaerobic digestion industrial sector,
(4) Although currently permitted to a level of 15% in tonnage.
A 100% renewable gas mix in 2050? – Technical/economic feasibility study PAGE 5enabling the conversion of agricultural • 30% could be provided by power-to-gas in
inputs, biowaste and seaweed residues to the context of a 100% renewable electric
produce up to 140 TWhHCV of gas (5)(6); mix to maximise the production of synthetic
•
40% could be supplied by the gas, i.e. 140 TWhHCV of gas (8).
pyrogasification sector from wood and its
derivatives, Refuse-Derived Fuel (RDF) and
a low proportion of agricultural residues,
to produce up to 180 TWhHCV of gas (7);
3.2. Gas demand from 276 to 361 TWh in 2050 could be met by
renewable gas in the four scenarios studied…
Bearing in mind other usages of biomass, for the injection sectors depends upon the
the potential of 460 TWhHCV of injectable level of mobilisation of the other usages (direct
renewable gas is enough to meet the demand usage or co-generation). The production mix
for gas in 2050 for a scenario similar to was defined after adjustment of demand for
ADEME's energy-climate scenario ("100% each scenario and the available resources
R&REn" with a demand of 293 TWh) but also a (see figure 4); the resources were mobilised
scenario in which the demand for gas is higher in increasing order of cost (see figure 11): the
("100% R&REn" with high pyrogasification" anaerobic digestion and pyrogasification
with a demand of 361 TWh). sectors were thus mobilised to their
The adjusted demand (see figure 4) for each maximum limit; power-to-gas, which is the
scenario takes into account different effects, most expensive, is the adjustment variable to
such as arbitrations on usages of anaerobic balance supply and demand (described in the
digestion and wood. The available resource Results section, paragraph 6.4).
FIGURE 3: RENEWABLE GAS MIX IN THE FOUR SCENARIOS
100% R&REn 128 65 9 90 293 TWh
100% R&REn 128 138 9 85 361 TWh
with high pyrogasification
Anaerobic digestion
100% R&REn with limited 100 31 135 276 TWh
biomass for gas usage 9 Pyrogasification-wood
Pyrogasification-RDF
75% R&REn 128 67 34 79 317 TWh Power-to-gas
9
TWhPCS Natural gas
0 100 200 300 400
(5) For crop residues and particularly straw, anaerobic digestion was preferred over pyrogasification because it enables stable carbon and
nutrients (including nitrogen) to be returned to the soil.
(6) 94% efficiency determined by injectable methane (HCV) / biogas produced (HCV).
(7) 70% efficiency determined by injectable methane (HCV) / input (LCV).
(8) 66% efficiency determined by injectable methane (HCV) / electricity consumed.
PAGE 6 A 100% renewable gas mix in 2050? – Technical/economic feasibility studyAdjustment of gas demand (TWhHCV) Adjusted gas Anaerobic digestion usage Wood usage arbitrations
Reference: 286 TWhHCV demand (TWhHCV) arbitrations (TWhHCV) (TWhLCV)
8 8 88
100%100%
R&REn
100%
100%
R&REn
R&REn
R&REn + 7 + 7 ++77 293 293293
293 137 137137
137 77 77 63
77 93
77 63 63 93
63 93 93
7 7 77
100%100%
R&REn
100%
100%
R&REn
R&REn
R&REn 8 8 88
withwith
highwith
with
highhigh
high + 75 + 75++75
75
361 361361
361 137 137137
137 35 35 35 197
35 197 197197
pyrogasification
pyrogasification
pyrogasification
pyrogasification 7 7 77
100%100%
R&REn
100%
100%
R&REnR&REn
R&REn 8 8 88
withwith
limited
with
with
limited
limited
limited - 10 - 10 - -10
10 276 276276
276 106 106106
106
30 30 30
30 79 79 63
79 63
79 63456345 45
47 45 47
47 47
biomass
biomass
biomass
biomass 7 7 77
for gas
forusage
gas
for
forgas
usage
gasusage
usage
8 8 88
75%75%
R&REn
75%
75%
R&REn
R&REn
R&REn + 32 + 32++32
32 317 317317
317 137 137137
137 75 75 63
75 95
75 63 63 95
63 95 95
7 7 77
-30 -300-30
-30
030 0030
6030
30
60
9060
60
90
12090
90
120120
120 0 0 5000 50100
50
50
100
150
100
100
150
200
150
150
200200
200
0 050 00
50
10050
50
100
150
100
100
150
200
150
150
200
250
200
200
250250
250
Power-to-heat heat Direct usage Heat
Power-to-gas heat Co-generation Co-generation
Pyrogasification heat
Injection Pyrogasification-
Biogas co-generation injection
Not used
Wood usage (direct us- Not used
age and co-generation)
FIGURE 4: ADJUSTMENT OF DEMAND AND BIOMASS RESOURCE USAGE SCENARIOS
Combustion turbine (CT)
NB: For each of the scenarios, figure 4 shows the gas demand adjustments, considering the various arbitrations on the use of biomass resources (see scenario description, 2.3.), and the effect
on demand of greater or lesser use of pyrogasification and power-to-gas (see demand adjustment method, 6.1.). This figure also shows the breakdown of biomass resources according to
energy usage.
A 100% renewable gas mix in 2050? – Technical/economic feasibility study
PAGE 73.3. … for an overall cost of 100% renewable gas
between €116 and €153/MWh
The total cost of gas consumed per MWh, gas usages in the "100% R&REn with high
i.e. the sum of production costs (9) and pyrogasification" scenario does not result in
network and storage costs, varies from significant cost differences. This is due to the
€105 (for the "75% R&REn" scenario) to greater use of the pyrogasification sector, in
€153 per MWh (for the "100%R&REn with which production costs are lower than for
limited biomass for gas usages" scenario) – power-to-gas.
see figure 5. These costs are similar to the The "100% R&REn with limited biomass
€120-130/MWh calculated for electricity in for gas usages" scenario also enables
the study "A 100% renewable electricity mix? 100% renewable gas, but at a higher cost,
Analyses and optimisations"(2015) (10). approximately 15% more than the "100%
Network and storage costs only represent a R&REn" scenario. This extra cost is due to
small proportion: 15-20% of total cost (€20- increased use of power-to-gas to compensate
23/MWh). In particular, the sole cost of for the lesser use of biomass sectors for
connection, including limited distribution anaerobic digestion and pyrogasification
network reinforcement needs and reverse usages (limited to 80% of potential).
flow stations, represent approximately Finally, the "75% R&REn" scenario,
€3/MWh. which keeps 25% natural gas in its mix,
Although demand for gas is 23% higher costs 10-20% less, while applying a carbon
than in the "100% R&REn" scenario, greater tax of €200/tCO2 in 2050 (11).
mobilisation of the biomass resources for
FIGURE 5: TOTAL COST PER MWh OF GAS CONSUMED
Historic network +
100% R&REn €118-132/MWh storage
Connection
and adaptation for
100% R&REn with high renewable gas
pyrogasification €116-127/MWh
Natural gas
100% R&REn with R&REn gas 1*
€133-
limited biomass for 153/MWh R&REn gas 2*
gas usage
75% R&REn €105-111/MWh * For each scenario, the two
production cost variants (1 and 2)
are differentiated by the electricity
€/MWh cost hypotheses used (see Cost
0 20 40 60 80 100 120 140 160 180 200 assessment method, 6.4.).
3.4. … enabling the avoidance of direct emissions
of approximately 63 MtCO2/year
These 100% renewable scenarios would in 2050. The avoided emissions would
enable direct emissions of approximately represent around 45 MtCO2/year for the 75%
63 MtCO2/year (12) to be avoided, R&REn scenario.
representing €12.6 billion for a shadow This estimation does not include possible
value of carbon of €200/tonne of CO2 modifications of the carbon sink.
(9) Renewable gas production costs are described in detail in part 6.4.
(10) http://www.ademe.fr/mix-electrique-100-renouvelable-analyses-optimisations.
(11) The price of natural gas in 2050 is taken to be €42/MWhHCV , a hypothesis identical to that of the study on ADEME, ARTELYS, ARMINES-
PERSEE et ENERGIES DEMAIN, "Un mix électrique 100 % renouvelable ? Analyses et optimization" (A 100% renewable electricity mix?
Analyses and optimisation), 2015. This price estimation is provided by World Energy Outlook. The carbon tax of €200/tCO2 increases
this price by €44/MWhHCV i.e. a price of €86/MWhHCV.
(12) Emissions for a scenario in which the reference demand (286 TWh) is 100% fulfilled by natural gas. The figure of 63 MtCO2 takes into account
a zero emission factor for biomethane. With a factor of approximately 23.4g/kWh, the estimated fall in emissions would be 56 MtCO2.
PAGE 8 A 100% renewable gas mix in 2050? – Technical/economic feasibility study4. FINDINGS
4.1. A gas system compatible with 100% renewable gas,
with necessary evolutions
Huge production of renewable gas will Regarding the evolution of the resources to
require more decentralised management of be mobilised to achieve 100% renewable gas,
the network than at present: changes will also be required beyond the gas
•
the study reveals that it is possible to system itself:
collect most of the resources disseminated •
in the agriculture sector, notably via the
in rural areas without massive use of road- generalisation of intermediate crops, and
transported gas or other innovative and anaerobic digestion as an energy and
non-mature solutions: the cost of the agronomic tool,
collection networks to be built represents a • in the forestry sector and wood industry,
low proportion of the overall cost (2-3%), via the development of sustainable,
• a number of technological solutions already dynamic forestry (positive carbon footprint,
exist to make the gas network bidirectional preservation of biodiversity) respectful of
(reverse flow, meshing), the anticipation and the hierarchy of usages (material wood, then
optimisation of their deployment will enable energy wood).
costs to be controlled,
•
transport and storage infrastructures
continue to represent key elements to
ensure the balance between supply and
demand, notably during cold spells.
4.2. The complementarity of the gas network with the electric
grid represents a key success factor for a highly renewable
energy mix
This study supports the fact that at a high of the gas network. It will also provide an
level of renewable energy production, the additional source of renewable gas for the
gas and electric systems will interact strongly gas vector (34-135 TWhHCV).
and evolve together: •
Renewable gas will help to balance the
•
Power-to-gas will enable inter-seasonal highly renewable electric system with
storage of electricity and geographic peaking thermal power plants supplied by
optimisation of the electric system via renewable gas (10-46 TWhHCV depending on
the transport and storage infrastructures the scenarios).
A 100% renewable gas mix in 2050? – Technical/economic feasibility study PAGE 95. LIMITS AND PERSPECTIVES
• This study is not an overall optimisation • The study does not assess a certain number
of the energy system; it does not indicate of external elements. For example, in all
the optimal proportion of renewable gas the scenarios, the mass development of
in technical and economic terms based renewable gas helps to strengthen France's
on defined climatic or environmental energy independence and has a positive
objectives. Final consumption figures in effect on the French economy as a whole, in
usages and annual volumes are input data terms of trade balance (at present, almost
for the study, taken from ADEME's 2035- all gas is imported, represented a total
2050 energy-climate scenario. The macro- of approximately €10 billion per year (13)),
economic balance will be carried out economic activity, CO2 emissions avoided.
subsequently by ADEME in 2019. It could foster job creations with the
• The study does not model the time line of deployment of around 10,000 production
the transition between the current situation units. These externalities were not
and the scenarios presented. quantified in the study.
• The hypotheses considered to define • Other scenarios could be envisaged, with
the potentials of the various resources, different arbitrations on the biomass or gas
particularly those of biomass, include usages in 2050. For example, these scenarios
uncertainties (changes to agriculture could explore the optimal vector breakdown
and forest systems, social acceptability to meet final demand or explore other
of projects, environmental review of the usages with higher added value to reduce
industrial sectors, etc.) the assessment of CO2 emissions in other sectors (industry,
which must be continued. transport, etc.).
6. METHOD AND HYPOTHESES
The study considers a single scenario for the final demand for gas in 2050 and explores a number
of gas supply scenarios.
FIGURE 6: STUDY METHODOLOGY
Prospective Description of the resource
framework of ADEME potential per input
(2017 update) •G eographic distribution
Gas demand
•P rocurement costs
Balance of • Transformation costs
supply/
ACTUALISATION DU SCÉNARIO ÉNERGIE-CLIMAT
ADEME 2035-2050 demand
over one year
Mobilisation
in increasing order of cost
Demand
that is
Four GAS 2050 scenarios localised
depending on: in space and TOTAL
• Resource usage arbitration time Assessment of COST
network + OF THE GAS
• Resource limitation / sector
storage costs
• % R&REn in the gas mix SYSTEM
(13) "Bilan énergétique de la France pour 2015" (Energy review for France for 2015), November 2016, SOeS.
PAGE 10 A 100% renewable gas mix in 2050? – Technical/economic feasibility studyThe study is based on four major phases, as • Balancing of supply/demand and network
indicated in figure 6: adaptations required: this is carried
• Adjustment of demand in 2050: annual out at department scale using the data
demand defined on the basis of ADEME's described above and a vision of the current
2035-2050 scenario (2017) is adjusted for the network installation (see description of
four scenarios. It is broken down to the level paragraph 6.3.). Connection and network
of the town and with daily load graphs. adaptation costs are evaluated, as are
storage requirements.
• Characterisation of the renewable gas
offer in 2050: the offer is based on already • Study of 4 scenarios defining 4 offer
existing scenarios regarding the different variants. They enable the evaluation of
potentials. It is then broken down to the different effects: greater or lesser allocation
level of the department, even canton. of the biomass resource to the production
The evolution of production costs in the of gas (competition between energy
various production sectors, according to the vectors, underestimated constraints, etc.),
mobilised resource, is evaluated. preservation of a proportion of natural gas
in the gas mix.
6.1. The gas demand scenario in 2050
The prospective framework 2050 is based on ADEME's 2035-2050 energy-climate scenario,
updated in 2017, which describes the final annual demand for energy for each sector, usage and
energy vector.
SUMMARY OF ADEME'S 2035-2050 ENERGY-CLIMATE SCENARIO
Final demand for energy in TWh
2010 2035 2050
- 29%
1,733 1,221 - 45% 953
The percentages indicate the fall in final demand for energy compared with 2010: 2035 2050
Share of renewable energy in final demand (according to 3 offer variants)
2010 2035 2050
10% 34% 46%
- -
41% 69%
Renewable energies Conventional energies
The percentages indicate the variation in the proportion of renewable sources in the energy mix (according to the 3 variants)
GG emissions in millions of tons of CO2 eq. (CO2, CH4, N20)
1990 2035 2050
- 51%
529 260 - 70% - 72% 158-146
The percentages indicate the fall in CO2 emissions compared with 1990: 2035 2050
READING: The 2017 energy-climate scenario covers all energy consumption in mainland France (excluding
consumption by international air traffic). It describes the development of renewable energy sources and
technologies. The proportion of renewable energy evolves according to three variants of the electric mix.
The same therefore applies to greenhouse gas emissions (CO2, CH4 and N2O).
A 100% renewable gas mix in 2050? – Technical/economic feasibility study PAGE 11The prospective framework is based on a on the electric system linked to the "gas"
proactive scenario aimed at energy efficiency scenario. In this exercise, the electric
and optimisation, with an overall volumes system is determined by the level of
reduction in 2050 of almost 35% compared power-to-gas used. The combustion
with 2015. turbine (CT) requirement is lower in
The 2035-2050 energy-climate scenario thus the scenarios in which power-to-gas is
served as a basis to determine the level and developed (15).
composition of the final demand for gas in 2. Demand decrease due to:
2050 (see table 1), and the use of energy • pyrogasification and power-to-gas
resources excluding gas usages (e.g.: wood conversion technologies co-produce
for boilers). heat, which can partially replace "gas"
TABLE 1: EVOLUTION OF FINAL MAINS GAS CONSUMPTION heat (16),
• power-to-heat (17) generates heat which
TWh 2015 2050 Evolution can partially replace "gas" heat. The
contribution of power-to-heat depends
Residential 150.8 49.2 -67%
on the electric system linked to the
Offices 85.3 13.2 -84% scenario, and therefore on the level of
Industry 152.5 99.3 -35% power-to-gas involved.
Transport 0 106.1 - The adjusted demand values are indicated in
figure 4 - Adjustment of demand and biomass
Agriculture 2.9 2 -30%
resource usage scenarios.
Other (14)
45.2 16.4 -64%
A model is used to describe the demand at
Total excluding power town level, per day and according to several
436.5 286.3 -34%
generation sets of weather data to take into account
particularly warm or particularly cold
The reference demand taken from ADEME's years (18), and daily cold spells. The daily load
2035-2050 energy-climate scenario is graphs for 2015 and 2050 were modelled. The
adjusted for each of the scenarios. It takes demand for gas for electricity production,
into account different effects: notably in winter, presents larger power
1. Demand increase related to: demands than today (19). In 2050, there is a
•
the substitution of usages initially significant drop in consumption in winter due
provided by other vectors (heat, directly to the reduced gas requirements for heating
or via co-generation), in residential and office buildings. In summer,
• peak electricity production (combustion energy savings are compensated by the
turbines); the quantity required depends increase in transport usage (20).
(14) Losses, water and waste sector, internal branch consumption, co-generation, refinery sector.
(15) Additional capacity from wind farms and solar farms set up to enable higher power-to-gas production also ensure better cover of the
demand for electricity and thus reduce, to a certain extent, the use of peak production means, such as gas combustion turbines (CT), in
terms of both capacity and energy.
(16) The heat efficiency figures used are 15% for pyrogasification and 23% for power-to-gas. Only 30% of this heat is considered to be
recycled and replaces heat produced from gas.
(17) Power-to-heat is a process that consists in using electric boilers (resistance or heat pump) in addition to fuel-powered boilers or thermal
processes. These electric systems are triggered for surplus electricity production to shed load from thermal facilities.
(18) All the sectors take into account a heat-sensitive effect, except the electricity production sector, which is exogenous to the model. Global
warming was taken into account, based on the sets of data from Météo France's Aladin model
(scenario RCP 4.5), see http://www.drias-climat.fr/accompagnement/sections/175
(19) The demand for gas for electricity production depends on the scenario and the power-to-gas contribution, which determines the electric
system associated.
(20) I n ADEME's 2035-2050 energy-climate scenario, gas fuel represents 48% of final energy in the transport sector.
PAGE 12 A 100% renewable gas mix in 2050? – Technical/economic feasibility study6.2. Assessment of potential renewable gas production
6.2.1. RENEWABLE GAS PRODUCTION CHANNELS
FIGURE 7: THE DIFFERENT PRODUCTION CHANNELS OF RENEWABLE GAS
Electric
Algaculture Agriculture Waste Trees and forests Industry
system CO2
Biodegradable Woody matter, Electricity By-product
matter cellulose hydrogen
Anaerobic Pyrogasification Electrolysis
digestion
Biogas CO2 CO2 Syngas Hydrogen**
Purification Methanation
Methane
Direct usage Local usage Network
injection
* "Pyrogasification" includes hydrothermal pyrogasification of seaweed.
** Hydrogen can also be used directly for various usages; this is not included in this study.
Renewable gas comes from three main • Pyrogasification: thermo-chemical meth
sectors: od, in the broad sense, enabling production
• Anaerobic digestion: biological method of a synthetic gas, called syngas, (mainly
using micro-organisms to break down organic composed of methane, hydrogen, carbon
matter and produce a mixture called biogas, monoxide and carbon dioxide) from organic
mainly composed of methane and carbon matter. The process can be completed by
dioxide. After purification, biomethane has methanation or separation to produce
thermodynamic properties equivalent to a gas whose thermodynamic properties
those of natural gas. The organic matter comes are equivalent to those of natural gas.
from agriculture (farm animal dejections, crop Pyrogasification mainly concerns dry
residues, intermediary crops, grass), industry woody matter or cellulose: wood and its
(by-products and waste from food-processing), derivatives, straw and various woody by-
sludge from urban sewage processing plants, products from agriculture. It may also
and household and food waste. involve waste, typically RDF(21).
(21) Refuse-Derived Fuel
A 100% renewable gas mix in 2050? – Technical/economic feasibility study PAGE 13• Power-to-gas (PtG): process to convert These scenarios are "Factor 4" compatible,
renewable electricity into synthetic i.e. they represent the agricultural and
gas. The first step involves electrolysis forestry component of scenarios aimed
to produce hydrogen (power-to-H2). A at dividing by four our greenhouse gas
second step can be added to convert the emissions, in all sectors, by 2050 (the
hydrogen to methane via a methanation greenhouse gas reduction factor for the
reaction (power-to-CH4). This reaction agriculture sector is 2) (22):
requires a source of CO2. •
concerning agricultural feedstock in
It should be noted that the levels of 2050, the potential used is mainly based
maturity and the production processes on SOLAGRO'S works, presented in the
of these three main sectors are different. Afterres 2050 (23) prospective study;
Pyrogasification and power-to-gas •
concerning wood resources, forest
technologies are therefore considered extractions are estimated on the basis
mature in 2050 with efficiency increase of works by ADEME, IGN, FCBA (24) and
hypotheses. However, this study does not INRA (25). The time line of these works was
take into account possible technological 2035, so the figures were extrapolated to
breakthroughs or significant economies of 2050, based on the "dynamic forestry"
scale. We also consider that the first two scenario drawn up by Ecofor (26);
sectors ensure basic production, while
• biowaste potential estimates are mainly
power-to-gas operates during periods of
from the study entitled "Estimation
surplus electricity production, making the
des gisements potentiels de substrats
use of power-to-gas discontinuous.
utilisables en méthanisation" (Estimation
of the potential sources of substrates for
6.2.2. MAIN HYPOTHESES TO use in anaerobic digestion) (27). Finally,
ASSESS FEEDSTOCK the potential of by-products from the
POTENTIALS food-processing industries comes from
Feedstock availability is notably dependent the study entitled "Étude du potentiel de
on the evolution of agricultural and production de biométhane à partir des
forestry systems as well as energy systems effluents des industries agroalimentaires"
(electricity and heat). (Study of the biomethane production
Biomass potentials respect several of the potential from food industry waste) (28) ;
study's fundamental standpoints: non- • seaweed is considered to be converted
competition of bioenergies with food or to liquid fuel. Only the residues are
with raw material usage, and increased considered for the gas sector, according to
biological life in soil. The framework data the 2014 study by ADEME/ENEA/INRIA (29).
in terms of agriculture and forestry are The potential for renewable electricity
based on integrated prospective scenarios to supply power-to-gas plants comes
which take into account the diversity of from the data of the 2017 ADEME/ARTELYS
the objectives for agriculture and forests. study (30) evaluating various optimised
(22) However, it is estimated that it would be possible to produce at least as much resource with a 'baseline' agricultural scenario, but the
negative impacts involved would be more significant.
(23) SOLAGRO, "Afterres 2050", 2016.
(24) ADEME, IGN, FCBA, "Disponibilités forestières pour l’énergie et les matériaux à l’horizon 2035" (Forest availabilities for energy and
materials in 2035), 2016.
(25) INRA and IGN, "Quel rôle pour les forêts et la filière forêt-bois française dans l’atténuation du changement climatique ?" (How can
forests and the French forestry-wood industry help to attenuate global warming?) June 2017.
(26) Caulet, "Climat, Forêt, Société – Livre Vert" (Climate, forest, society - Green paper), 2015.
(27) ADEME, SOLAGRO and INDDIGO, "Estimation des gisements potentiels de substrats utilisables en méthanisation" (Estimation of
potential sources of substrates usable for methanation), 2013.
(28) GRDF et SOLAGRO, "Étude du potentiel de production de biométhane à partir des effluents des Industries Agro-Alimentaires" (Study of
the production potential of biomethane from food-processing industry waste), 2017.
(29) ENEA, INRIA and ADEME, "Évaluation du gisement potentiel de ressources algales pour l’énergie et la chimie en France à horizon 2030"
(Evaluation of potential seaweed resources for energy and chemistry in France in 2030), July 2014. Total conversion of seaweed into gas
enables a production potential of up to 60 TWh, with efficiency approximately half that of the diesel + gas conversion.
(30) ADEME and ARTELYS, "Un mix électrique 100 % ENR en 2050, quelles opportunités pour décarboner le système gaz et chaleur ?" (A 100%
R&REn electric mix in 2050, how to reduce the carbon footprint of the gas and heat system), 2017.
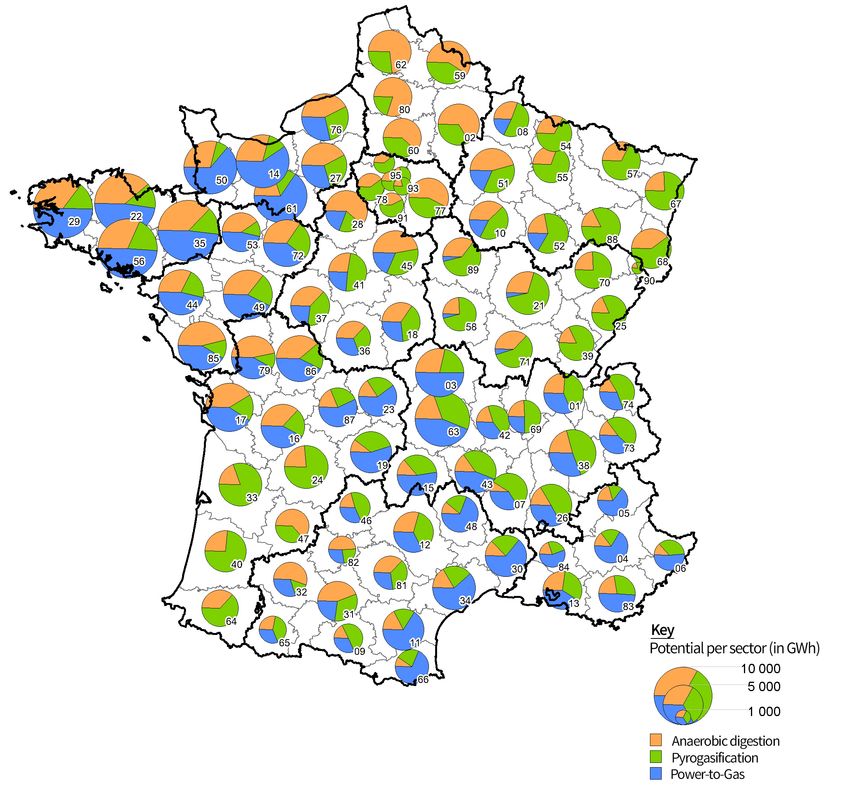
PAGE 14 A 100% renewable gas mix in 2050? – Technical/economic feasibility studyconfigurations of the electric system with The map below shows the injectable gas
power-to-gas developed to a greater or potential per department and per sector.
lesser extent: installed capacity per region, These potentials correspond to the entire
operating time profile, electricity costs. available resource for an energy usage,
In terms of recovered gas, RDF (Refuse- before arbitration between the energy
Derived Fuel) (31) and by-product hydrogen (32) usages in competition.
potentials were also estimated, representing
figures significantly lower than the renewable
potentials in the strictest sense.
FIGURE 8: BREAKDOWN OF THE THEORETICAL POTENTIAL OF INJECTABLE GAS BY DEPARTMENT
AND SECTOR IN 2050
10,000
5,000
1,000
Anaerobic digestion
Pyrogasification
Power-to-gas
(31) GRDF, GRTgaz and S3D, "Étude sur les gisements valorisables par la filière pyrogazéification phase 1 : état des lieux bibliographique et
'fiches intrants'" (Study of the sources recyclable by the phase 1 pyrogasification sector: bibliographic review and 'input datasheets'), 2017.
(32) GRDF, ADEME and SOLAGRO, "Évaluation du potentiel de méthanation à partir de gaz industriels fatals (hydrogène et dioxyde de car-
bone)" (Evaluation of the methanation potential from by-product industrial gases (hydrogen and carbon dioxide)), 2017.
A 100% renewable gas mix in 2050? – Technical/economic feasibility study PAGE 156.3. Assessment of network adaptation
The method used enables the demand for transported gas. If applicable, solutions to
gas to be covered by the most competitive eliminate the constraints on the gas network
renewable sectors first; it also enables were implemented (meshing, reverse flow).
consideration of the costs of adapting the These solutions are presented in figure
gas network (distribution and transport to a 9. These profiles and solutions were then
lesser degree) to convey this renewable gas to extrapolated to the whole of mainland
consumers. France.
The positioning of the production units The national supply-demand balance was
and the necessary changes to the network examined for all the scenarios, using different
(connection pipelines, storage capacities, sets of climate data to test the resilience of
reverse flow stations) were evaluated in the gas system to exceptionally hot or cold
detail for four typical departments with years, and daily cold spells.
different profiles in terms of consumption The resilience of the gas system was studied
and production density. using different sets of climate date for each
An optimisation algorithm then enabled scenario.
identification of a new configuration for The storage requirements thus evaluated
the gas network to enable the connection were compared with existing storage capacity,
of production units involving a range of or storage capacity whose development has
connection solutions: connection to the already been confirmed, both in terms of
distribution network, connection to the volume and output.
transport network or connection via road-
FIGURE 9: ILLUSTRATION OF THE RANGE OF SOLUTIONS TO CONNECT AN ANAEROBIC DIGESTION
PLANT
Road-transported Connection to Connection to
gas injection the distribution network the transport network
Liquefaction station
and analyser Compressor
Distribution Transport network
network injection station
Reception and injection station
de-conditioning
station HP/LP
Distribution pressure
network reducing
Distribution meshing station
network
injection station Existing gas Existing gas
distribution transport
network network
Reverse flow
Existing gas stations
distribution
network
PAGE 16 A 100% renewable gas mix in 2050? – Technical/economic feasibility studyFIGURE 10: SUPPLY-DEMAND BALANCING AND STORAGE EVOLUTION (NORMAL YEAR)
2,500 120
100
2,000
Production and demand in GWh/day
80
1,500
Storage – TWh
60
1,000
40
Power-to-gas
500
20 Pyrogasification
Anaerobic digestion
Demand
0 0 Storage
.
.
ay
.
.
.
.
.
.
.
eb
.
pr
un
.
ov
ct
ec
ul
ug
ar
an
ep
1M
1O
1A
1J
1F
1D
1N
1M
1J
1A
1J
1S
6.4. Full cost assessment
The cost assessment includes: 5. Power-to-gas with costs of €65-185/MWhHCV,
• production costs; depending on the sector. The Power-to-
• distribution and transport costs; CH4 sector falls within the range of €105-
• storage costs. 185/MWhHCV. It is important to note that
Production costs are evaluated for each this cost also includes an average CO2
sector, including resource procurement costs procurement cost of €10/MWhHCV (33). Power-
and transformation costs. These costs increase to-H2 costs less than Power-to-CH4 within
with the level of resource mobilisation due to the range of €65-125/MWh. The ranges
increasing mobilisation costs: for example, the presented depend on the hypotheses
last TWh of wood would have to be extracted used for the purchase price of electricity.
from forest areas that are more difficult to The development of power-to-gas induces
operate (access difficulties, rough terrain, extra costs (development of electricity
degree of plot division, etc.). production means) and benefits (drop in
flexibility requirements for the electric
In increasing order of cost, this gives:
grid), which, depending on their economic
1. Recovered energies at €30-40/MWhHCV allocation, are reflected in two variants. The
2. RDF pyrogasification at €40/MWhHCV "preferential price of electricity for flexible
3. Anaerobic digestion, with costs below consumer" variant corresponds to a price of
€80/MWhHCV electricity below its production cost price,
reflecting the economic benefit of power-
4. Biomass/wood pyrogasification with costs
to-gas for the electric system.
of €80-120/MWhHCV
(33) This cost varies from one scenario to another (€7 -17/MWhHCV, i.e. €41-77/tCO2), depending on access to CO2 sources. Anaerobic digestion
and pyrogasification provide sources of relatively pure CO2 that are considered free: they are therefore used first. More costly solutions
are then considered to meet the needs of each scenario: capture from combustion plants, transport, storage.
A 100% renewable gas mix in 2050? – Technical/economic feasibility study PAGE 17The "price of electricity at spot market price' The costs of transport network
variant corresponds to a higher cost of modification were deemed insignificant. An
procurement (34). initial analysis indicates that the size of the
The costs of connection and network current transport network is compatible with
adaptation were then assessed. These the 2050 scenarios studied.
adaptations include the creation of reverse For the other existing network costs, it
flow compression stations between the is assumed that network operation and
distribution and transport networks. The renewal costs will remain similar to current
exercise was carried out for four typical costs. The estimation was based on the
departments. The results were extrapolated transport (ATRT5) and distribution (ATRD5)
nationally, taking into account the differences tariff evaluation.
in access to biomass resources (distance). Storage costs were estimated on the basis
of current costs, modulated according to the
annual storage volume used in each of the
modelled scenarios.
FIGURE 11: PRODUCTION COSTS OF THE DIFFERENT SECTORS IN 2050,
ACCORDING TO THE OVERALL RESOURCE MOBILISED
Power-to-CH4 -
180 price of electricity at
the spot market price
Power-to-CH4 -
160 preferential price of
electricity for flexible
consumer
140
Power-to-H2 -
price of electricity at
120 the spot market price
Production costs (€/MWh)
Power-to-H2 -
100 preferential price of
electricity for flexible
consumer
80 Pyrogasification - Wood
Anaerobic digestion
60
Pyrogasification - RDF
By-product H2 anaerobic
40 digestion
20 NB: for the anaerobic digestion and
pyrogasification-wood sectors, pro-
duction costs depend on the overall
level of mobilisation of biomass
0 resources, including the resources
0 50 100 150 200 mobilised for usages other than
the production of injectable gas
Resource mobilised in injectable gas equivalent (TWhHCV ) (combustion).
(34) Depending on the level of power-to-gas production in the scenarios, the average cost of electricity procurement varies from €67 to €82/
MWh in the "price of electricity at the spot market price' variant and between €30 and €56/MWh in the "preferential price of electricity for
flexible consumer" variant.
PAGE 18 A 100% renewable gas mix in 2050? – Technical/economic feasibility studyADEME
COLLECTIONS
ADEME IN BRIEF
ACHIEVEMENTS
ADEME (the French environment and energy management ADEME as a catalyst: Players relate
agency) contributes to the implementation of public policies in their experience and share their
know-how.
the fields of environment, energy and sustainable development.
It provides expertise and advice to companies, local authorities, EXPERTISE
ADEME as an expert: Reporting
public authorities and private individuals to enable progress in the results of research, studies
environmental initiatives. The agency also helps with project and group projects under its
supervision.
funding, from research to implementation in the following areas:
waste management, ground preservation, energy efficiency and FACTS AND FIGURES
ADEME as a reference: Providing
renewable energies, raw material savings, air quality, reducing objective analyses based on
precise indicators that are regularly
noise pollution, transition to a circular economy and reducing food updated.
waste.
KEYS FOR ACTION
ADEME as a facilitator: Publishing
ADEME is a public institution, under the joint supervision of the practical guides to help players
to implement their projects
Ministry for the Ecological and Inclusive Transition and the Ministry methodologically and/or in
of Higher Education, Research and Innovation. compliance with regulations.
HORIZONS
ADEME into the future: Proposing
a prospective, realistic view of
the challenges of the energy and
ecology transition for a desirable
future to be built together.A 100% RENEWABLE GAS
MIX IN 2050?
ADEME contributes to the discussions on France's proactive
strategy, notably by examining possible trajectories for
the French energies of the future and has been publishing
energy-climate scenarios on a regular basis since 2013. This
study, "A 100% renewable gas mix in 2050?", conducted by
ADEME in collaboration with GRDF and GRTgaz, follows
on from the works published in 2016 - 2017, and concerns
the second most consumed energy in France, gas. Herein,
ADEME explores the conditions of the technical and
economic feasibility of a gas system in 2050 based on 100%
renewable gas.
The work is based on ADEME's 2035-2050 energy scenario,
with a level of final demand for gas in 2050 of around
300 TWh, compared with today's figure of 460 TWh.
The results, based on sensitivity analyses and various
renewable gas production mix scenarios, reveal that there
is a theoretical potential source of renewable gas that could
fulfil this lower demand for energy in 2050 at an overall
cost of gas between €116 and €153/MWh. It would involve
making some modifications to the gas system and notably
development of the complementarity between the gas
network and the electric grid. This confirms that to improve
the sustainability of our energy system, we must strengthen
the interactions between the energy vectors and optimise
their synergies, at various territorial scales.
www.ademe.fr
ISBN 979-10-297-1055-1
010521You can also read


