4Q2021 & FY2021 Results Presentation - 14 FEBRUARY 2022 iFAST Corporation Ltd - Singapore Exchange
←
→
Page content transcription
If your browser does not render page correctly, please read the page content below

iFAST Corporation Ltd.

 4Q2021 & FY2021
Results Presentation
     14 FEBRUARY 2022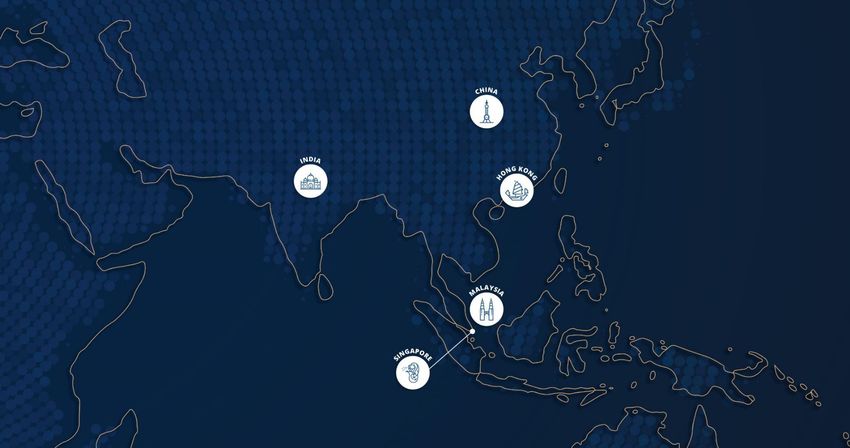
Disclaimer
This presentation should be read as an overview of iFAST Corporation Ltd.’s (“iFAST Corp” or the “Company”, and
together with its subsidiaries, the “Group”) current business activities and operating environment. This presentation
should not be solely relied upon by current and potential investors when making an investment decision. iFAST Corp
accepts no liability whatsoever with respect to the use of the content in this presentation. This presentation may
contain forward-looking statements that involve known and unknown risks, uncertainties and other factors that may
cause our future performance, outcomes and results to be material different from those expected, expressed or
implied in these forward-looking statements. Investors should therefore not rely on these forward-looking statements,
which are based on the current view of management of future events and market developments, which in turn are
based on currently available information, and are not a guarantee of future performance. This presentation should not
be construed as financial or investment advice and investors should consult their independent advisers in respect of
the contents and information set out in this presentation where necessary. This presentation does not constitute an
offer or solicitation of an offer to subscribe for, acquire, purchase, dispose of or sell any units in iFAST Corp.

                                                                                                                        2
Contents
Key Summary Pg. 4
4Q2021 (Oct–Dec 2021) & FY2021 (Jan-Dec 2021) Results Pg. 8
Section I Financial Indicators
Financial Results
Proposed Final Dividends
Section II iFAST’s Four-Year Plan Pg. 22
iFAST’s Four-Year Plan & The Future of Wealth Management and Banking
Proposed UK Bank Acquisition Proposed UK Bank Acquisition
AUA Breakdown: Markets & Products Pg. 36
Section III Recurring and Non-recurring Net Revenue
Our Performance Trends Performance by Geographical and Business Segments
Progress of Individual Markets
Business Overview & Milestones Pg. 54
The iFAST Fintech Ecosystem
Section IV Value Proposition
Appendices
Fees Illustration
Activities & Achievements
3
Key Summary
• The Group’s assets under administration (“AUA”) continued to register new record levels, reaching
  S$19.00 billion as at 31 December 2021, a growth of 31.5% YoY. The AUA of unit trusts, its key
  investment asset class, grew to a record S$13.89 billion as at 31 December 2021, a growth of 27.5%
  YoY.
• As a result of the increasing AUA, the Group’s recurring net revenue has continued to grow at a
  robust pace, increasing 35.6% YoY in FY2021.
• Net inflows of client assets remained healthy in 4Q2021 at S$0.76 billion, leading to net inflows of
  S$3.75 billion for FY2021.
• The Group’s net revenue grew 31.9% YoY to S$113.22 million in FY2021, while its net profit grew
  44.8% YoY to S$30.63 million in FY2021. Reflecting the positive operating leverage of the Group’s
  business model, its profit before tax (“PBT”) margin (based on net revenue) increased to 31.6% for
  FY2021, compared to 29.6% for FY2020.
• Moving forward, the Group will focus on executing its Four-Year Plan which includes getting bigger
  and better, accelerating the Hong Kong business growth, adding digital banking and other
  capabilities to the iFAST Fintech Ecosystem, and building a truly global business model.

                                                                                                         4
Key Summary
• On 7 January 2022, the Group announced its intention to acquire the UK-based BFC Bank Limited
  (“UK Bank”) from BFC Group Holdings. iFAST Corp expects the proposed acquisition to contribute
  some initial start-up losses. Based on the Group’s 85% stake in the UK Bank, its estimated loss to
  the Group for FY2022 is approximately S$4.0 million (excluding some transaction and other charges
  charged to balance sheet upon completion). iFAST Corp targets to achieve profitability for the UK
  Bank starting 2024.
• iFAST Corp expects its overall business to achieve robust growth in both revenue and profitability
  between 2021 and 2025, with Hong Kong’s ePension division expected to be the biggest driver
  from 2023.
• The guidance for the Hong Kong business on page 26 conservatively provides for a six-month delay
  in the rollout of the ePension project even though the delay may not likely occur. The Group will
  revisit the guidance in the later part of the year.
• For the final dividend for FY2021, the Directors proposed a dividend of 1.40 cents per ordinary
  share, an increase of 40.0% YoY compared to the final dividend for FY2020 of 1.00 cents per
  ordinary share. The proposed final dividend will be subject to approval by shareholders at the
  company’s Annual General Meeting to be held on 25 April 2022.
                                                                                                       5
Group AUA grew 31.5% YoY to S$19.00 billion
                              as at 31 December 2021
   S$ million                                                                        AUA (as at 31 Dec 2021): S$19.00 billion1
  $19,500.00
  $18,000.00
  $16,500.00
  $15,000.00
  $13,500.00
  $12,000.00
  $10,500.00
   $9,000.00
   $7,500.00
   $6,000.00
   $4,500.00
   $3,000.00
   $1,500.00
          $-
                Jun-01

                Jun-02

                Jun-03

                Jun-04

                Jun-05

                Jun-06

                Jun-07

                Jun-08

                Jun-09

                Jun-10

                Jun-11

                Jun-12

                Jun-13

                Jun-14

                Jun-15

                Jun-16

                Jun-17

                Jun-18

                Jun-19

                Jun-20

                Jun-21
                Dec-11

                Dec-12

                Dec-19

                Dec-20
                Dec-01

                Dec-02

                Dec-03

                Dec-04

                Dec-05

                Dec-06

                Dec-07

                Dec-08

                Dec-09

                Dec-10

                Dec-13

                Dec-14

                Dec-15

                Dec-16

                Dec-17

                Dec-18

                Dec-21
Note:                                                                 B2B B2C
1. The Group’s AUA as at 31 December 2021 includes its effective 39.35% share of the India Business.

                                                                                                                                 6
Net Inflows & Gross Unit Trusts (UT) subscription
S$ million                  Net Inflows                                            S$ million            Gross UT Subscriptions
$4,000                                                                              $8,000
                                                                  $3,745
                                                                                                                                                       $7,052
$3,500                                                                              $7,000
                                                    $3,160
$3,000                                                                              $6,000                                               $5,647
$2,500                                                                              $5,000

$2,000                                                                              $4,000

$1,500                                                                                          $2,908      $3,053        $2,870
                                                                                    $3,000
             $942                     $976
$1,000                                                                              $2,000
                        $786
  $500                                                                              $1,000

    $-                                                                                 $-
             2017       2018          2019           2020          2021                           2017         2018            2019          2020       2021
   Notes:
   1. Excluding incremental increase in AUA of S$0.48 billion resulting from the transfer of DWS Investment Singapore Ltd’s fund management business relating
       to its Singapore mutual funds platform in July 2021.
   2. Net inflows stood at S$1.28 billion in 1Q2021, S$0.84 billion in 2Q2021, S$0.87 billion in 3Q2021 and S$0.76 billion in 4Q2021.
   3. Gross UT Subscriptions stood at S$2.21 billion in 1Q2021, S$1.76 billion in 2Q2021, S$1.57 billion in 3Q2021 and $1.51 billion in 4Q2021.

                                                                                                                                                                7
SECTION I

Financial Results

                    8
Financial Results for Group
                                            (4Q2021 vs 4Q2020)
                    S$ (Million)                                 4Q2020                       4Q2021         YoY change (%)
                     Revenue                                       47.90                        54.55            +13.9
                   Net revenue                                     24.33                        28.23            +16.0
                  Other income                                     1.56                         -0.39             NM
               Operating Expenses                                  17.61                        19.65            +11.6
          Net finance (cost) / income                              -0.06                         0.05             NM
  Share of results of associates, net of tax                       -0.27                        -0.21            -21.2
                 Profit before tax                                 7.96                          8.04             +1.0
                  Profit after tax                                 6.77                          7.14             +5.3
           Net profit attributable to
                                                                   6.83                          7.20             +5.5
           owners of the Company
                    EPS (cents)                                    2.51                          2.60             +3.6
          Dividend Per Share (cents)                               1.00                         1.401            +40.0
Notes:
1. Subject to approval by shareholders at the company’s Annual General Meeting to be held on 25 April 2022
2. NM denotes Not Meaningful
                                                                                                                              9
Financial Results for Group
                                             (FY2021 vs FY2020)
                    S$ (Million)                                  FY2020                        FY2021                  YoY change (%)
                      Revenue                                     169.93                        216.20                        +27.2
                   Net revenue                                     85.86                        113.22                        +31.9
                  Other income                                      5.21                         0.49                          -90.6
               Operating Expenses                                  65.29                         77.68                        +19.0
               Net finance income                                   0.03                         0.13                        +432.0
  Share of results of associates, net of tax                        -0.41                        -0.35                         -16.1
                 Profit before tax                                 25.39                         35.82                        +41.1
                  Profit after tax                                 20.96                         30.41                        +45.0
            Net profit attributable to
                                                                   21.15                         30.63                        +44.8
            owners of the Company
                    EPS (cents)                                     7.80                         11.10                        +42.3
           Dividend Per Share (cents)                               3.30                         4.801                        +45.5
Note:
1. Including the proposed final dividend for FY2021 which will be subject to approval by shareholders at the company’s Annual General Meeting
   to be held on 25 April 2022
                                                                                                                                                10
Results Overview for Group
S$ (Million) FY20171 FY2018 FY2019 FY2020 FY2021
Revenue 101.17 121.24 125.41 169.93 216.20
Net revenue 49.45 59.62 65.20 85.86 113.22
Other income 1.08 1.16 2.04 5.21 0.49
Operating expenses 42.19 49.78 56.06 65.29 77.68
Net finance income/(costs) 0.74 0.83 -0.06 0.03 0.13
Share of results of associates, net of tax -0.33 0.52 -0.05 -0.41 -0.35
Profit before tax 8.75 12.35 11.07 25.39 35.82
Profit after tax 7.49 10.69 9.31 20.96 30.41
Net profit attributable to
7.70 10.91 9.52 21.15 30.63
owners of the Company
EPS (cents) 2.92 4.10 3.55 7.80 11.10
Operating Cashflows 13.22 17.62 19.38 41.56 46.53
Dividend per share (cents) 3.01 3.15 3.15 3.30 4.802
Notes:
1. Restated as a result of adoption of SFRS(I)s with effect from 1 January 2018
2. Including the proposed final dividend for FY2021 which will be subject to approval by shareholders at the company’s Annual General Meeting
to be held on 25 April 2022
11PBT Margin for Group (Based on Net Revenue)
35.0%
31.6%
29.6%
30.0%
25.0%
20.7%
20.0%
17.7% 17.0%
15.0%
10.0%
5.0%
0.0%
2017 2018 2019 2020 2021
Note:
1. PBT margins (2017) were restated as a result of adoption of SFRS(I)s with effect from 1 January 2018
12Return on Equity
30.0%
25.8%
25.0%
21.8%
20.0%
15.0%
13.1%
10.9%
9.7%
10.0%
5.0%
0.0%
2017 2018 2019 2020 2021
13Financial Indicators
S$ (Million) FY2017 FY2018 FY2019 FY2020 FY2021
EBITA 12.96 16.44 17.49 32.98 45.01
Net Cash Position1 55.91 48.06 40.15 53.28 59.29
Operating Cash Flows 13.22 17.62 19.38 41.56 46.53
Capital Expenditure2 7.47 10.73 11.90 12.63 21.62
Net Current Assets 60.18 56.62 49.86 58.35 68.03
Shareholders’ Equity 81.24 85.56 90.06 104.11 128.65
Notes:
1. Comprising cash and cash equivalents and investments in financial assets (categorised as other investments under current assets) net of bank loans
at the end of the respective year or period
2. Excluding right-of-use assets recognised following the adoption of SFRS(I)16 Leases with effect from 1 Jan 2019.
14Net Cash Position
As at 31 Dec 2021
(S$ million)
Cash and cash equivalents 44.10
Other investments¹ 15.19
Total cash and other investments 59.29
Less: Bank loans -
Net Cash Position
59.29
(total cash and other investments net off bank loans)
Gross Debt-to-Equity Ratio 0.00%
Net Debt-to-Equity Ratio Net Cash Position
Note:
1. Other investments comprise investments in financial assets under current assets
15Group Operating Cash Flows
S$ million
50.00
46.53
45.00
41.56
40.00
35.00
30.00
25.00
19.38
20.00 17.62
15.00 13.22
10.00
5.00
0.00
2017 2018 2019 2020 2021
16Capital Expenditure
S$ million
22.00 21.62
20.00
18.00
16.00
14.00 12.63
11.90
12.00 10.73
10.00
8.00 7.47
6.00
4.00
2.00
0.00
2017 2018 2019 2020 2021
17Number of issued shares
As at 31 Dec 2020 As at 31 Dec 2021 As at 14 Feb 2022
Total number of issued shares
(excluding treasury shares 272,407,635 276,946,913 290,986,9131
and subsidiary holdings)
Note:
1. Including the 14,000,000 new shares (arising from the share placement) and the 40,000 new shares (arising from the exercise of employee
share options) issued in January 2022
18Our Consolidated Financial Position
As at 31 Dec 20 As at 31 Dec 21
S$’000 S$’000
ASSETS
Plant and Equipment 4,283 7,552
Right-of-use Assets 18,538 14,198
Intangible Assets and Goodwill 25,500 32,623
Associates 5,982 6,552
Other Investments 3,944 2,919
Deferred Tax Assets 1,099 2,448
Contract Costs - 3,241
Prepayments & Others 330 675
TOTAL NON-CURRENT ASSETS 59,676 70,208
Current Tax Receivables 203 219
Other Investments 16,838 15,197
Contract Costs - 97
Prepayments and Others 1,813 3,107
Trade & Other Receivables 44,990 55,126
Uncompleted Contracts - Buyers 94,318 36,800
Money Market Funds 4,833 5,751
Cash at Bank and In Hand 31,608 38,346
TOTAL CURRENT ASSETS 194,603 154,643
TOTAL ASSETS 254,279 224,851
19Our Consolidated Financial Position
As at 31 Dec 20 As at 31 Dec 21
S$’000 S$’000
EQUITY
Share Capital 66,976 67,577
Reserves 37,133 61,076
EQUITY ATTRIBUTABLE TO OWNERS OF THE COMPANY 104,109 128,653
Non-Controlling Interests (709) (1,018)
TOTAL EQUITY 103,400 127,635
LIABILITIES
Deferred Tax Liabilities 2,616 3,092
Lease Liabilities 12,013 7,513
TOTAL NON-CURRENT LIABILITIES 14,629 10,605
Current Tax Payables 3,078 4,191
Lease Liabilities 7,205 7,665
Trade & Other Payables 31,735 38,016
Uncompleted Contracts - Sellers 94,232 36,739
TOTAL CURRENT LIABILITIES 136,250 86,611
TOTAL LIABILITIES 150,879 97,216
TOTAL EQUITY & LIABILITIES 254,279 224,851
HELD UNDER TRUST
Client Bank Accounts 943,960 973,592
Client Ledger Balances (943,960) (973,592)
- -
20Proposed Final Dividend for FY2021
Proposed Final Dividend for FY2021 - Schedule
Dividend per share 1.40 cents per ordinary share
Ex-dividend date 6 May 2022
Record date and time 9 May 2022 (5.00 pm)
Payment date 19 May 2022
• For the final dividend for FY2021, the Directors proposed a dividend of 1.40 cents per ordinary share, an
increase of 40.0% YoY compared to the final dividend for FY2020 of 1.00 cents per ordinary share. The
proposed final dividend will be subject to approval by shareholders at the company’s Annual General
Meeting to be held on 25 April 2022.
• The proposed final dividend brings the total dividend to 4.80 cents per ordinary share for FY2021 which
is 45.5% higher than the total dividend of 3.30 cents per ordinary share for FY2020.
21Section II
iFAST’s Four-Year Plan & Proposed UK Bank Acquisition
22iFAST’s Four-Year Plan
1. Get Bigger and Better: Continue to work on increasing the scale and quality of its Fintech
wealth management platform in various markets, in line with the Group’s target AUA of
S$100 billion by 2028.
2. Accelerate Hong Kong Growth: Substantially accelerate the growth of the Group’s overall
Hong Kong business as it effectively executes its ePension business in Hong Kong, and
continues to improve on its existing platform capabilities.
3. Add Digital Banking and Other Capabilities: Add digital banking capabilities to the Group’s
Fintech Ecosystem and make strategic investments in adjacent Fintech capabilities, while
ensuring that wealth management will remain as its core service as a progressive Fintech
player.
4. Truly Global Business Model: Make tangible progress towards the Group’s vision of being a
top Fintech wealth management player with a truly global business model, which will be
even more scalable.
23Four-Year Plan: Get Bigger and Better
• The Group’s focus all these years on ensuring that it continues to make progress as a Fintech
wealth management platform in all the markets that it operates in will continue.
• The Group will continue to work on increasing the scale and quality of its platforms for both
the B2C segment and B2B segment. The B2B segment includes its in-house wealth advisory
division, iFAST Global Markets (iGM).
• The Group remains committed to its previously stated Group AUA target of S$100 billion by
2028. This would imply a compound annual growth rate (CAGR) of approximately 27% from the
Group’s current AUA of S$19.0 billion.
• The Group will continue to work on enlarging its overall Fintech ecosystem.
• The Group’s focus on ensuring that its business model is scalable, capital efficient and derives
the majority of its net revenue from recurring income will continue.
24Four-Year Plan: Accelerate Hong Kong Growth
• The Group expects to substantially accelerate the growth of its overall Hong Kong
business in the next four years, particularly in 2023, 2024 and 2025.
• The Group expects its existing Fintech wealth management platform business to
continue to grow, while its new ePension division will start to contribute substantially
starting 2023/2024.
• The Group’s ePension division will involve operation and administration services for
MPF schemes (main contributor) as well as ORSO (Occupation Retirement Scheme
Ordinance) schemes.
• A substantial part of the Group’s resources will be invested into ensuring that it can
effectively execute its ePension services efficiently with minimal errors.
• The ePension division will not add to the Group’s AUA numbers, but will add a strong
stream of recurring service fees to the Group.
25Guidance on Hong Kong Targets
• In the Group’s 3Q2021 & 9M2021 results released on 23 October 2021, the Group gave the following
guidance on the targeted revenue and PBT margin for its overall Hong Kong business in 2024 and 2025:
o Gross Revenue Targets
Target to achieve Gross Revenue of >HKD1 billion in 2024
Target to achieve Gross Revenue of >HKD1.5 billion in 2025
o Net Revenue Targets
Target to achieve Net Revenue of >HKD800 million in 2024
Target to achieve Net Revenue of >HKD1.2 billion in 2025
o PBT Margin (based on Net Revenue) Targets
Target to achieve PBT Margin of >15% in 2024
Target to achieve PBT Margin of >33% in 2025
• The above guidance conservatively provides for a six-month delay in the rollout of the ePension project
even though the delay may not likely occur. The Group will revisit the guidance in the later part of the
year.
Note:
* It should be noted that the above are the Group’s targets, and should not be taken to mean a firm set of projections. The targets may change if
there are unforeseen circumstances, or if there are material changes in the operating environment in the next few years.
26Four-Year Plan: Add Digital Banking and Other Capabilities
• The Group believes that Fintech businesses in most countries around the world are still in their
early stages of growth. Clear long-term planning is needed to survive and thrive in the Fintech
and financial world in the next 10 years and beyond.
• Successful Fintech businesses need to have the ability to combine the technological capabilities
and agility of many Fintech start-ups with several of the strengths of traditional financial
institutions.
• Key strengths of many traditional financial institutions include having the right suite of licences
and demonstrating the ability to run profitable and sustainable business models.
• iFAST Corp believes it is well-positioned in the Fintech industry as it will be able to combine its
technological capabilities and business model agility with the Group’s proven capability of
running profitable business models and handling various regulatory and compliance
considerations.
• The Group’s core business will continue to be a Fintech wealth management platform. However,
to ensure that iFAST remains a progressive and competitive Fintech player, and to improve overall
user stickiness, the Group sees the need to develop some services adjacent to wealth
management.
27Four-Year Plan: Add Digital Banking and Other Capabilities
• The Group therefore expects to be pursuing more financial licences in different jurisdictions,
and make strategic investments in adjacent Fintech capabilities.
• One of the services that is closely linked to wealth management is digital banking. This is
illustrated by the fact that in most countries around the world, the biggest distributors of
wealth management products are the banks.
• The Group would like to have digital banking capabilities in one or more jurisdictions, and will
therefore continue to pursue digital banking licences.
• Another example of a service that is adjacent to wealth management is a ‘market place for
bonds’. A ‘market place for bonds’ will have clear business propositions given that unlike
stocks, there are no ‘bond exchanges’, especially for individual investors.
• Operating a ‘bonds market place’ would require a ‘Recognised Market Operator’ licence, and
accordingly the Group is in the midst of applying for such a licence.
• The Group will give updates on its pursuits of different licences in different jurisdictions at
appropriate times.
28Four-Year Plan: Truly Global Business Model
• The Internet has brought about many different new business models, including truly global
business models that are far more scalable and competitive on a global basis.
• Truly global business models are those that can operate from just one or a few countries, but
serve customers from around the world. Truly global business models have emerged for many
industries such as media, e-commerce, music and video streaming etc.
• In the Fintech wealth management world, truly global businesses have not emerged in a big
way. However, the Group believes that in the next 10 years, some of the most competitive and
scalable wealth management business models will become truly global Fintech wealth
management platforms.
• In the next four years, the Group targets to make tangible progress towards its vision of being a
top Fintech wealth management player with a truly global business model focused on helping
investors invest globally and profitably.
• In order to achieve this, the Group needs to continuously work on expanding its global Fintech
ecosystem and improve on the overall global connectivity, while being fully compliant with
regulations and compliance requirements of various jurisdictions.
29The Future of Wealth Management and Digital Banking
• The Group believes that the future of wealth management is one where many
investors from various emerging markets will be looking for the best wealth
management platforms across the world that can provide them seamless access and
connectivity to global products and global exchanges.
• Wealth management platforms with seamless links to good digital banking services
that allow consumers and investors to manage payment flows seamlessly across
borders while getting attractive deposit rates in various currencies, will have strong
advantages.
• With that in mind, the Group believes that one of the central components of the iFAST
Ecosystem in the future will be a digital bank located in a trusted jurisdiction.
• A full licensed UK bank will fit these requirements very well, given London’s status as a
top financial centre with strong connectivity to the world, and given its forward-looking
regulatory frameworks.
30Adding a Digital Bank to the iFAST Fintech Ecosystem
Online Account Multi-Currency
Opening Deposits
Digital Bank
Payment / Banking as a
Remittance Service (BaaS)
Fund Stock
Houses Exchanges Retail FA Companies Banks
Investors
Holds relevant Investment Cash
licences in 5 Products Management
markets & Services Facilities
Banks/ Insurance
Bond Dealers Companies & Wealth Financial Internet
Other Product Advisers Institutions Companies
Providers Research & Fintech
Advisory Solutions
Capabilities
31Banks and Wealth Management
• In most countries around the world, the biggest players in the wealth management
industry are banks. This is not surprising given that banks have the advantage of
consumers’ cash sitting within the banks.
• iFAST Corp has made substantial progress as a wealth management platform without
some of the key advantages that the banks have. A lot more can be achieved if the
Group has a bank within the Group.
• In the last 3-4 years, the Group has been evaluating ways of being able to add a digital
bank to its growing Fintech Ecosystem. The Group believes this will help to accelerate
the growth of its overall wealth management platform.
• The Group believes that banks are operating at the ‘foundation layer’ of the financial
industry. Having direct access to this ‘foundation layer’ will allow the Group to innovate
and progress at a faster pace, especially in today’s increasingly globalised and digitally-
connected world.
32Adding a Digital Bank to the iFAST Fintech Ecosystem
• Adding a digital bank to the iFAST Fintech Ecosystem will have the effect of allowing the
Group to acquire more customers globally at a faster pace, as it taps into the growing
demand of customers around the world for good wealth management and digital
banking platforms.
• Convenient online account openings, remittance services and multi-currency deposit
accounts with attractive deposit rates are starting points that will already make a
difference to the client acquisition process.
• Digital banks can be run with a capital-efficient, asset-light and scalable business
model, unlike many traditional banks.
33Proposed UK Bank Acquisition
• On 7 January 2022, the Group announced its intention to acquire the UK-based BFC Bank
Limited (“UK Bank”) from BFC Group Holdings. The Group will have an 85% stake in BFC Bank.
BFC Bank has the requisite banking licence in the UK.
• The proposed acquisition of the UK Bank will enable the Group to add a digital bank to its
Fintech Ecosystem. In an increasingly digitally-connected world, this will help the Group
accelerate the growth of its overall wealth management business and take a significant step
towards building a truly global business model.
• The Group will focus on having a capital-efficient, asset-light and scalable business model for
its banking business.
• The Group expects the proposed acquisition of the UK Bank to contribute some initial start-up
losses. Based on the Group’s 85% stake in the UK Bank, its estimated loss for FY2022 to the
Group is approximately S$4.0 million1.
• The Group targets to achieve profitability for the UK Bank starting 2024.
Note:
1. Excluding some transaction and other charges charged to balance sheet upon completion.
34Proposed UK Bank Acquisition
• The Acquisition Amount will be £25.0 million (equivalent to approximately S$45.9 million),
comprising an estimated amount of £22.6 million (equivalent to approximately S$41.5 million)
to fund the acquisition of BFC Bank and £2.4 million (equivalent to approximately S$4.4
million) to offset relevant transaction costs.
• There will be an additional Injection Amount of £15.0 million (approximately S$27.5 million) to
fund a capital injection into BFC Bank.
• The Total Investment Amount of £40.0 million (equivalent to approximately S$73.4 million)
comprising the Acquisition Amount and the Injection Amount to subsequently fund a capital
injection into BFC Bank represents 3.2% of the Company’s market capitalisation (based on the
total number of issued shares excluding treasury shares) at 5 January 2022.
• On 10 January 2022, iFAST Corp conducted a placement of shares to institutional and
accredited investors for the purpose of funding the Group’s proposed UK Bank acquisition. The
Group successfully raised net proceeds of approximately S$103 million from the placement.
Additional funds raised from the placement exercise will be used for working capital purposes.
35SECTION III
\
Performance Trend
36AUA Breakdown: Markets & Products
(as at 31 December 2021)
AUA Breakdown By Markets AUA Breakdown By Products
3.8% 4.8%
9.6%
17.7%
15.1%
4.4%
71.5% 73.1%
Singapore Hong Kong Unit Trusts Bonds
Malaysia Others (China & India) Stocks & ETFs Cash Account
37Net Revenue Breakdown between
Recurring and Non-recurring Sources
Average contribution from recurring net revenue as opposed to non-recurring net revenue
S$ million in the period from 2020 to 2021 was 69.9%
120
100
34.5
80
25.5
60 12.3
11.3
8.5
40 6.9 6.0 78.7
7.2
6.0 60.4
4.0 48.3 52.9
20 4.8 40.9
18.1 12.3 4.6 34.6 34.7
4.0 25.6 29.5
7.7 17.2 20.4 22.3
3.1 4.7 10.7 12.9 11.9
0 1.1 2.2 5.2
2004 2005 2006 2007 2008 2009 2010 2011 2012 2013 2014 2015 2016 2017 2018 2019 2020 2021
Recurring net revenue Non-recurring net revenue
38Net Revenue, Operating Expenses and Operating Profit
as a Ratio of Average AUA
0.800%
0.732% 0.735% 0.731% 0.757%
0.700% 0.665%
0.126% 0.139% 0.138% 0.225%
0.600%
0.625% 0.614% 0.203%
0.629%
0.500%
0.576%
0.400% 0.456%
0.300% 0.606% 0.596% 0.594%
0.533%
0.462%
0.200%
0.181% 0.209%
0.100%
0.106% 0.121% 0.103%
0.000%
2017 2018 2019 2020 2021
Recurring net revenue / AUA Non-recurring net revenue / AUA
Operating expenses / AUA Operating profit / AUA
39Recurring and Non-recurring Net Revenue
S$ (Million) FY2017 FY2018 FY2019 FY2020 FY2021
Recurring net revenue 40.95 48.32 52.94 60.39 78.69
Non-recurring net revenue 8.50 11.30 12.26 25.47 34.53
Total net revenue 49.45 59.62 65.20 85.86 113.22
YoY Change (%) FY2017 FY2018 FY2019 FY2020 FY2021
Recurring net revenue +18.0 +18.0 +9.6 +14.1 +30.3
Non-recurring net revenue +42.2 +33.0 +8.5 +107.7 +35.6
Total net revenue +21.5 +20.6 +9.4 +31.7 +31.9
40Net Revenue – Geographical Segment
S$ (Million) FY2017 FY2018 FY2019 FY2020 FY2021
Singapore 34.77 39.30 41.95 56.33 73.24
Hong Kong 10.78 14.26 16.71 19.22 24.41
Malaysia 3.47 5.32 5.97 8.55 13.16
China 0.43 0.75 0.57 1.76 2.41
Group 49.45 59.62 65.20 85.86 113.22
YoY Change (%) FY2017 FY2018 FY2019 FY2020 FY2021
Singapore +17.7 +13.0 +6.8 +34.3 +30.0
Hong Kong +24.5 +32.2 +17.2 +15.0 +27.0
Malaysia +53.5 +53.4 +12.2 +43.2 +54.0
China +83.4 +73.1 -24.1 +210.6 +37.3
Group +21.5 +20.6 +9.4 +31.7 +31.9
41Net Revenue – B2B Business Segment
B2B Net Revenue
FY2017 FY2018 FY2019 FY2020 FY2021
(S$ Million)
Recurring net revenue 28.85 33.88 37.12 42.34 55.73
Non-recurring net revenue 5.15 7.22 7.19 10.88 16.42
Total B2B net revenue 34.00 41.10 44.31 53.22 72.15
YoY Change (%) FY2017 FY2018 FY2019 FY2020 FY2021
Recurring net revenue +17.8 +17.4 +9.6 +14.1 +31.6
Non-recurring net revenue +33.4 +40.1 -0.5 +51.4 +50.9
Total B2B net revenue +19.9 +20.9 +7.8 +20.1 +35.6
42Net Revenue – B2C Business Segment
B2C Net Revenue
FY2017 FY2018 FY2019 FY2020 FY2021
(S$ Million)
Recurring net revenue 12.10 14.44 15.81 18.04 22.96
Non-recurring net revenue 3.35 4.08 5.08 14.60 18.11
Total B2C net revenue 15.45 18.52 20.89 32.64 41.07
YoY Change (%) FY2017 FY2018 FY2019 FY2020 FY2021
Recurring net revenue +18.4 +19.3 +9.5 +14.0 +27.3
Non-recurring net revenue +58.0 +22.0 +24.3 +187.5 +24.0
Total B2C net revenue +25.2 +19.9 +12.8 +56.2 +25.9
43Profit/Loss – Geographical Segment
Profit/Loss YoY Change YoY Change
(S$ Million) 4Q2020 4Q2021 (%) FY2020 FY2021 (%)
Singapore 6.91 6.62 -4.1 21.32 28.43 +33.4
Hong Kong 1.73 2.03 +17.4 5.79 8.39 +44.8
Malaysia 0.94 1.28 +35.9 3.75 5.39 + 43.5
China (1.30) (1.62) +24.6 (4.88) (5.82) +19.3
Other1 (0.27) (0.21) -21.2 (0.41) (0.35) -16.1
Profit before tax2 8.01 8.10 +1.2 25.57 36.04 +40.9
Tax expense (1.18) (0.90) -23.8 (4.42) (5.41) +22.4
Net profit after tax2 6.83 7.20 +5.5 21.15 30.63 +44.8
Notes:
1. Representing share of results of associates
2. Attributable to owners of the Company
44Profit/Loss – Geographical Segment
Profit/Loss
(S$ Million) FY20173 FY2018 FY2019 FY2020 FY2021
Singapore 10.62 11.86 9.96 21.32 28.43
Hong Kong 1.77 3.42 4.42 5.79 8.39
Malaysia 1.07 1.37 1.76 3.75 5.39
China (4.17) (4.60) (4.82) (4.88) (5.82)
Other1 (0.33) 0.52 (0.05) (0.41) (0.35)
Profit before tax2 8.96 12.57 11.27 25.57 36.04
Tax expense (1.26) (1.66) (1.76) (4.42) (5.41)
Net profit after tax2 7.70 10.91 9.52 21.15 30.63
Notes:
1. Representing share of results of associates
2. Attributable to owners of the Company
3. Restated as a result of adoption of SFRS(I)s with effect from 1 January 2018 for comparison purpose
45Progress of Individual Markets
SINGAPORE
• Net revenue for the Singapore operation increased by 12.9% YoY to S$18.3 million in 4Q2021 and 30.0%
YoY to S$73.2 million in FY2021.
• The AUA of the Singapore operation grew 35.8% YoY and 4.4% QoQ to $13.58 billion as at 31 December
2021. The continued growth in AUA was reflective of the strong sales and net inflows in 2021. Sales grew
46% YoY in 2021.
• The AUA of the B2B business (excluding iGM division) grew 36.7% YoY in 2021, while sales grew 69.8%
YoY in 4Q2021. With more products offered and better services provided, the number of B2B partners
using the B2B platform grew 22% YoY. These B2B partners include external asset managers, financial
advisory firms, banks, stockbrokers and robo advisers.
• As at 31 December 2021, the AUA for the iGM Singapore division grew 37.1% YoY to S$1.05 billion.
Despite a jittery end to the year for Asian equities, overall sales were still 44% higher for the full year of
2021, driven by the increasing adoption of new products like stocks and ETFs.
46Progress of Individual Markets
SINGAPORE
• The iGM wealth advisory team strength grew 46.3% YoY as of 31 December 2021, while the average AUA
per adviser stood at S$17.6 million. Over the quarter, new trading capabilities for China A-shares and
Bursa Malaysia were enabled, allowing iGM clients to diversify their stock holdings in a cost-efficient
manner, with processing fees as low as 0.06%. As part of ongoing platform enhancements, advanced
order placement was also enabled over the quarter, allowing clients to trade stocks and ETFs in selected
markets with more flexibility and precision.
• The AUA of the B2C FSMOne.com division grew 33.9% YoY, while sales grew 23.7% YoY in 2021. Despite
the more volatile market conditions in 4Q2021, sales across unit trusts, stocks, ETFs and bonds remained
resilient.
• As part of its continuous effort to help investors invest profitably, FSMOne.com organised its annual
investment webinars in early January 2022, bringing together its regional analysts, partners from the
asset management companies and investment influencers. The numerous investment presentations and
panel discussions are readily accessible on FSMOne.com website and mobile app, as well as the recently-
launched iFAST TV website and mobile app, which is a dedicated channel bringing together the top
investment ideas for investors and wealth advisers.
47Progress of Individual Markets
HONG KONG
• Net revenue for the Hong Kong operation increased by 16.3% YoY to S$6.0 million in 4Q2021 and 27.0%
YoY to S$24.4 million in FY2021.
• The AUA of the Hong Kong operation fell 2.8% QoQ but grew 7.7% YoY to S$2.86 billion as at 31
December 2021. The QoQ decline in AUA is mainly due to the drop in the asset value of investment
products. Nevertheless, the Hong Kong operation continued to record positive net inflows in 4Q2021
and saw net inflows growing more than 68% YoY in FY2021.
• Following the launch of China A-Shares trading, the Hong Kong operation introduced SGX stockbroking
services in 4Q2021, allowing both its B2C clients and B2B partners to take exposure in unique sector
opportunities beyond the US and Hong Kong equity markets.
• Impacted by the concern of defaults in Chinese property bonds, the bond AUA of the Hong Kong
operation continued to fall in 4Q2021 as a result of bond redemption and decline in bond market value.
• The AUA of the B2B division (excluding iGM) grew 7.1% YoY, while sales grew 47% YoY in 2021. Stocks
and ETFs turnover and unit trust sales (ex-switching) remained strong in 2021, growing 49% YoY and 39%
YoY respectively. On the other hand, bond turnover was hit with a decline of 38% YoY as investors shy
away from the Chinese high-yield bonds market.
48Progress of Individual Markets
HONG KONG
• The AUA of the B2C FSMOne.com division fell 2.1% YoY, mainly driven by a decline in bond AUA resulting
from the significant drop in the bond market value and bond redemption. Unit trust sales (ex-switching)
grew 22% QoQ in 4Q2021 and 4% YoY in 2021. Bond turnover grew 10% YoY in 2021 despite recording a
huge decline in 4Q2021. Stocks and ETFs turnover grew 16% YoY in 2021, but declined 22% QoQ in
4Q2021 as investors sentiment remained weak during the quarter.
• Despite the weak investors’ sentiment, the iGM division continued to achieve solid growth in 4Q2021.
The division’s AUA grew 57.2% YoY, while its sales and net sales achieved substantial YoY growth. In
particular, the stocks and ETFs turnover more than quadruple as compared to a year ago.
• The demand for Fintech solutions in Hong Kong is expected to remain strong in 2022, especially in the
area of unit trust dealing and distribution system.
• The Hong Kong operation has set up the ePension division in September 2021. The division has started
earning some project solution fee from the Hong Kong pension project and is expected to help add a
strong stream of income to the Group going forward.
49Progress of Individual Markets
MALAYSIA
• Net revenue for the Malaysia operation increased by 46.8% YoY to S$3.4 million in 4Q2021 and 54.0%
YoY to S$13.2 million in FY2021.
• The AUA of the Malaysia operation grew 7.7% QoQ and 38.2% YoY to a record high of S$1.83 billion as at
31 December 2021, supported by strong growth in gross sales and net inflows. Sales across all products
grew 45.8% YoY in 2021.
• Unit trust sales of the Malaysia operation grew 9.5% QoQ in 4Q2021. Sales of managed portfolios
remained stable, while bond turnover grew 34% QoQ in 4Q2021. Stockbroking services for the Malaysia,
Hong Kong and US exchanges continue to see good adoption across both the B2B and B2C divisions.
• The AUA of the B2C FSMOne.com division grew 32.7% YoY in 2021. Its unit trust sales dipped 9% QoQ
but grew 14% YoY in 4Q2021, while new account openings picked up marginally as investors continue to
be wary about high inflation and potentially more aggressive monetary policies.
• Following the launch of the US and Hong Kong stockbroking services in July 2021, FSMOne.com
launched SGX trading services in December 2021. A pick up in the number of transactions across all
exchanges were observed with strong interest seen in the US exchanges.
• Going into 2022, FSMOne.com is looking to offer access to more exchanges, enable Regular Saving Plan
for ETFs, and will be launching an Islamic cash account as a parking tool for its clients.
50Progress of Individual Markets
MALAYSIA
• Despite the jittery global equity markets and risker bonds space, the B2B division saw a significant
pickup in unit trust sales and bond turnover in 4Q2021. Gross sales for unit trust grew 17.3% QoQ and
47.2% YoY in 4Q2021. Bond turnover grew 38.6% QoQ in 4Q2021 as investors took the opportunity to
pick up sold down bonds. Sales of managed portfolios continue to see good net inflows, growing 106%
YoY in 4Q2021. The B2B division is in talks with institutional partners to provide customised portfolios
for their distribution.
• Following the successful launch of Bursa, Hong Kong and US stockbroking services, the B2B division saw
encouraging pick up in clients trying out the new services. The division is also seeing clients transferring
their stock holdings into the iFAST B2B platform to consolidate their investment holdings.
• The AUA of the B2B division (excluding iGM) grew 25.4% YoY in 2021, while the AUA of the iGM business
grew 102.2% YoY surpassing RM1 billion in 2021.
• The Fintech Solutions division has seen an increase in activities in 2021 and is expected take up more
projects in 2022 that will bring in upfront and recurring revenue for the Group.
51Progress of Individual Markets
CHINA
• Net revenue for the China operation fell 17.7% QoQ to S$0.53 million in 4Q2021, but grew 37.3%
YoY to S$2.41 million in FY2021.
• Despite 2021 being a volatile year for the China market, the AUA of the China operation increased
75% YoY and stood at over RMB2.33 billion (equivalent to S$496 million) as at 31 December 2021.
• The China mutual fund market continues to see healthy growth despite market volatility in 2021. As
at end 2021, the market size of publicly offered mutual fund stood at RMB25 trillion as compared
to RMB18 trillion as at end 2020.
• iFAST China has made significant progress in 2021 with its AUA crossing RMB2 billion for the first
time since it obtained the Fund Distribution Licence in late 2015. The Group believes that its China
operation is well positioned to capitalise on the future growth of the public mutual fund industry in
China.
• The Group will continue to seek possible opportunities to further expand iFAST China’s range of
services and products via additional licences through direct application or acquisition.
52Progress of Individual Markets
INDIA
• As at 31 December 2021, iFAST Corp holds an effective 39.35% share in iFAST Financial India
Pvt Ltd, the key business of the Group’s India business, which engages in the distribution of
wealth management products in India.
• The AUA of the India operation increased 19.5% YoY and 2.7% QoQ to India Rupee 32.64 billion
(equivalent to S$594 million) as at 31 December 2021.
• iFAST India has seen increased interest from mutual fund distributors (MFD) looking for a full
service platform to grow their business and is actively working to onboard them as its B2B
clients.
• The India operation is starting to see new revenue streams including equities admin fee and
iGM service fee contributing to the growth of its overall net revenue in recent times. As
Registered Investment Advisers are required to charge fee on direct Portfolio Management
Service (PMS), PMS admin fee is expected to start contributing to the India operation’s revenue
from 2Q2022.
53SECTION IV
Appendices
54Business Overview
• iFAST Corporation Ltd. is a wealth management fintech platform with assets under administration (AUA) of
S$19.00 billion as at 31 December 2021 (stock code: AIY).
• Main business divisions:
o Business-to-Consumer (B2C): FSMOne.com (formerly “Fundsupermart”) a multi-product online wealth
management platform targeted at DIY investors (AUA: S$5.87 billion);
o Business-to-Business (B2B): Caters to the specialised needs of over 550 financial advisory (FA) companies,
financial institutions and banks (AUA: S$13.13 billion), which in turn have more than 11,000 wealth
advisers; and
o Fintech Solutions / Business-to-Business-to-Consumer (B2B2C) Model: iFAST Fintech Solutions was
launched to provide customisable Fintech solutions for our B2B clients and business partners to empower
them with B2C Fintech capabilities.
• The Group offers access to over 14,000 investment products including unit trusts, bonds and Singapore
Government Securities (SGS), stocks, Exchange Traded Funds (ETFs), insurance products, and services including
discretionary portfolios, research and investment seminars, fintech solutions, and investment administration and
transaction services.
• Our mission statement is, “To help investors around the world invest globally and profitably”.
55Milestones
Launch of iFAST Platform Acquired a stake in the holding
Services (B2B) in HK Incorporation of iFAST company of iFAST India Business
Launch of iFAST Launch of Fundsupermart.com Platform Services (Shenzhen) Launch of HKEX stockbroking on
Platform Services (B2C) and iFAST Platform Qianhai in China (CN) HK B2B platform
(B2B) in Singapore Services (B2B) in Malaysia (MY) Listing on SGX-ST Mainboard Launch of Insurance on FSM MY
Launch of FSMOne in SG
2000 2007 2011 2015
>>>
2002 2008 2014 2016
Launch of “FSM Mobile”
iPhone application. The
Launch of Android version of the “FSM
Distribution of bonds and ETFs in SG
Fundsupermart.com (B2C) Mobile” was launched in the
Launch of online discretionary portfolio
in Singapore (SG) Launch of following year
management service (DPMS) in HK
Fundsupermart.com Received Funds Distributor
(B2C) in Hong Kong (HK) Qualification in CN
56Milestones
Launch of US stockbroking in HK iFAST SG received the “Fastest Growing SGX-ST
iFAST Corp won the "Best Investor Relations Member” award for the second consecutive year
- Silver Award" in the small cap category at Launch of revamped FSMOne mobile applications
the Singapore Corporate Awards (SCA) 2018 in SG, HK and MY
Launch of FSMOne in MY Registered as Private Fund Manager in CN
2017 2019 2021
2018 2020
Launch of HKEX stockbroking on FSM HK iFAST SG clinched “Fastest Growing Launch of Bursa stockbroking in MY and SG
Launch of online DPMS in MY SGX-ST Member” award iFAST HK approved as China Connect Exchange and
Admitted as Trading Member of SGX-ST iFAST MY launched retail bonds under Clearing Participant by HKEX; launch of China A-
and Clearing Member of CDP in SG the new Seasoning Framework Shares stockbroking in HK and SG
Launch of SGX stockbroking in SG Launch of iFAST Global Markets (iGM) Launch of HKEX, US and SGX in MY
Launch of FSMOne in HK mobile app in SG and HK Launch of iFAST Fund Management business in SG
Launch of iFAST Fintech Solutions iFAST Corp won the “Best Investor Launch of iFAST ePension Services in HK
Launch of US stockbroking on FSM SG Relations – Bronze Award” at SCA 2019 iFAST Corp clinched Runner-Up for the “Most
Transparent Company Award 2021 - Financials” and
“Shareholder Communication Excellence Award 2021
- Mid Cap” at the SIAS Investors’ Choice Awards 2021
iFAST Corp won Corporate Excellence and Resilience
Award at the Singapore Corporate Awards 2020/2021
57iFAST Fintech Ecosystem
(as at 31 Dec 2021)
Connecting All to Help Investors Invest Globally and Profitably
B2C Fundsupermart.com / FSMOne.com /
Fund
Houses Bondsupermart
Holds relevant
licences in 5
markets
FA Companies
Banks/ Over
Bond Dealers 690,000
customer
accounts Over 550 companies,
in 5 Financial and
markets Institutions over 11,000
wealth advisers
Stock
use iFAST B2B
Exchanges
Fintech Research & platforms
Solutions Advisory
across 5 markets
Capabilities Banks
Investment
Insurance Products Cash Management B2B
Companies & & Services facilities B2B2C Internet
Other Product Companies
Providers
Access to iFAST’s Infrastructure & Distribution Network in 5 markets
58The iFAST Fintech Ecosystem
• Products and services:
─ Unit trusts (over 9,800 funds from over 280 fund houses)
─ Bonds (over 1,500 direct bonds)
─ Stocks & ETFs – in 5 markets (Singapore, Hong Kong, US, Malaysia & China A Shares)
─ Discretionary portfolio management services
• Over 550 financial institutions and other corporations and over 11,000 wealth advisers using
the platform
• Over 690,000 customer accounts in five markets
• Leading wealth management Fintech platform in Asia’s two international financial centres
(Singapore and Hong Kong)
• Presence in Asia’s two giants markets (China and India), with linkages to Singapore and Hong
Kong increasingly strengthened
59The Revenue Drivers
• The iFAST business model predominantly involves growing the size of our assets under
administration (AUA). Higher AUA will generally lead to higher revenues.
• Recurring income accounts for more than two thirds of our net revenue
• Sources of Recurring Net Revenue
o Trailer fees, platform fees, wrap fees
o Net interest income
o Fintech solutions IT maintenance fees
• Sources of Non-Recurring Net Revenue
o Transaction fees – unit trusts, bonds, stocks, ETFs
o Forex conversions
o Fintech solutions IT development fees
o Insurance commissions
• In recent times, the sources of the Group’s net revenue have broadened. The contributions
from net interest income arising from clients’ AUA and Fintech solutions IT fees have become
more important.
60Breakdown of Net Revenue (FY2020)
Fintech Solutions IT fees,
Others, 1.4%
2.8%
FX Margin, 7.4%
Transaction
Fees/Commission Income
(Other Products), 12.8%
Trailer Fee, 42.3%
Transaction
Fees/Commission Income
(UT and Portfolio
Management Services), 5.5%
Net Interest Income Arising
from Clients' AUA, 5.8%
Platform Fee, 15.8% Wrap Fee, 6.2%
61Licences Held and Products and Services Available
(as at 31 December 2021)
LICENCES HELD :
• Fund Distributor Qualification [CSRC]
• Associate Member of AMAC
• Member of SAMC
• Registered Private Fund Manager [AMAC]
PRODUCTS AVAILABLE : UT
LICENCES HELD:
• Type 1: Dealing in Securities [SFC]
• Type 4: Advising on Securities [SFC]
• Type 9: Asset Management [SFC]
• MPFA
LICENCES HELD : • SEHK Participant
• Registered Investment Adviser with SEBI • HKSCC Participant
• Registered Mutual Fund Distributor with • China Connect Exchange and Clearing Participant [HKEX]
Association of Mutual Funds in India • Licensed Insurance Broker with Insurance Authority
• Bombay Stock Exchange (BSE) PRODUCTS AVAILABLE : UT / Bonds / Stocks / ETFs / DPMS
• Central Depository Services (India) Ltd
• Approved person of Central Insurance
Repository Ltd. LICENCES HELD :
PRODUCTS AVAILABLE : UT / Stocks • Capital Market Services Licence [SC]
• Registered IUTA and IRPA [FIMM]
• Financial Advisers Licence [BNM] [SC]
LICENCES HELD: • Participating Organisation of Bursa Malaysia [SC]
• Capital Markets Services Licence [MAS] PRODUCTS AVAILABLE : UT / Bonds / Stocks /DPMS / Insurance
• Financial Adviser Licence [MAS]
• Exempt Insurance Broker [MAS]
• SGX Trading Member [SGX]
• CDP Depository and Clearing Agent [CDP]
PRODUCTS AVAILABLE:
UT / Bonds / Stocks / ETFs / DPMS / Insurance
62Our Value Proposition
B2B B2C
PRODUCT PROVIDERS
CUSTOMERS DIY INVESTORS
• One platform, multiple • One platform, multiple investment products • One platform, multiple
B2C and B2B customers • Adoption of recurring revenue business model investment products
• No need to enter into based on Assets Under Administration (“AUA”) • Competitive and transparent
individual distribution • Platform performs efficient collection of fees fee structure
agreement and business • IT solutions and backroom functions managed • Award-winning websites and
relationship with by platform mobile applications
customers • Competitive fee-sharing structure • Availability of Investment
• Research into investment products Advisers if advice is required
• Adoption of a wrap account which seamlessly • Online discretionary portfolio
combines multiple investment product management services (DPMS)
categories into one account
• Online discretionary portfolio management
services (DPMS)
63Fees Illustration
FUND HOUSES
TRAILER FEE
PLATFORM FEE
PLATFORM FEE
B2B CUSTOMERS UPFRONT FEE B2C CUSTOMERS
UPFRONT FEE
WRAP FEE
FX CONVERSION FEES
B2B FINANCIAL OTHER
ADVISORY COMPANIES FINTECH SOLUTIONS
FACILITIES
SERVICE FEES
644Q2021: Activities & Achievements
(L-R): iFAST Corp won the Corporate Excellence and Resilience Award at the Singapore Corporate Awards 2020/2021 in November; FSMOne.com Singapore launched the China A-
Shares and Bursa trading services in October and November respectively; iGM Malaysia achieved AUA milestone of over RM1 billion as at end October.
(L-R): iFAST Malaysia donated medical supplies and equipment to Hospital Sungai Buloh to support the healthcare sector in combating COVID-19 in September;
iFAST Corp employees from across the region gathered in support of the SGX Bull Charge Virtual Charity Run which ran from 29 October to 7 November;
iFAST Singapore partnered the Waterway Watch Society for its annual awareness campaign on water conservation in December.
65TO HELP INVESTORS AROUND THE WORLD
INVEST GLOBALLY AND PROFITABLY
THANK YOU!
For more information,
please visit: www.ifastcorp.com
iFAST Corporation Ltd.You can also read