25TH CREDIT SUISSE ASIAN INVESTMENT CONFERENCE - CAPITALAND INTEGRATED COMMERCIAL TRUST
←
→
Page content transcription
If your browser does not render page correctly, please read the page content below
CapitaLand Integrated Commercial Trust
25th Credit Suisse Asian Investment
Conference
22 March 2022
Disclaimer
          This presentation may contain forward-looking statements. Actual future performance, outcomes and results may differ materially from those expressed in
          forward-looking statements as a result of a number of risks, uncertainties and assumptions. Representative examples of these factors include (without
          limitation) general industry and economic conditions, interest rate trends, cost of capital and capital availability, availability of real estate properties,
          competition from other developments or companies, shifts in customer demands, shifts in expected levels of occupancy rate, property rental income, charge
          out collections, changes in operating expenses (including employee wages, benefits and training, property operating expenses), governmental and public
          policy changes and the continued availability of financing in the amounts and the terms necessary to support future business.

          You are cautioned not to place undue reliance on these forward-looking statements, which are based on the current view of management regarding future
          events. No representation or warranty expressed or implied is made as to, and no reliance should be placed on, the fairness, accuracy, completeness or
          correctness of the information or opinions contained in this presentation. Neither CapitaLand Integrated Commercial Trust Management Limited (“Manager”)
          nor any of its affiliates, advisers or representatives shall have any liability whatsoever (in negligence or otherwise) for any loss howsoever arising, whether
          directly or indirectly, from any use, reliance or distribution of this presentation or its contents or otherwise arising in connection with this presentation.

          The past performance of CapitaLand Integrated Commercial Trust (“CICT”) is not indicative of future performance. The listing of the units in the CICT
          (“Units”) on the Singapore Exchange Securities Trading Limited (the “SGX-ST”) does not guarantee a liquid market for the Units. The value of the Units and
          the income derived from them may fall as well as rise. Units are not obligations of, deposits in, or guaranteed by, the Manager or any of its affiliates. An
          investment in the Units is subject to investment risks, including the possible loss of the principal amount invested. Investors have no right to request that the
          Manager redeem or purchase their Units while the Units are listed on the SGX-ST. It is intended that holders of Units may only deal in their Units through
          trading on the SGX-ST.

          This presentation is for information only and does not constitute an invitation or offer to acquire, purchase or subscribe for the Units.

C a p i t a L a n d I n t e g r a t e d C o m m e r c i a l Tr u s t                                                                                                          2
Table of Content

                                                                       04               38
                                                                       Highlights       Creating Value

                                                                       13               47
                                                                       Financial        Strategy and
                                                                       Performance      Outlook

                                                                       19               51
                                                                       Portfolio        Market
                                                                       Performance      Information

                                                                       23               67
                                                                       Performance      Additional
                                                                       By Asset Type    Information

         Funan, Singapore

C a p i t a L a n d I n t e g r a t e d C o m m e r c i a l Tr u s t                                     3
Highlights

Asia Square Tower 2, Singapore
Achieved 2H 2021 DPU of 5.22 cents
An advanced distribution of 4.85 cents for the period from 1 Jul to 15 Dec 2021 paid on 28 Jan 2022
                                                                                                                     Distributable Income (S$ million)
                                                                                                                                                                             (2)
                                                    FY 2021                                                                                                        338.8
                                                                                                                335.9
                                             Distributable Income

                                              S$674.7                  (1)

                                                             million
                                                                                                              1H 2021                                            2H 2021

                                                                                                                                    DPU (cents)
                                             FY 2021                                                            5.18                                               5.22
                                                                                                                                                                   0.37              Distribution for period
                                   Distribution Per Unit (DPU)                                                                                                                       from 16 to 31 Dec 2021
                                                                                                                                                                                      Advanced distribution for the

                                                       10.40                                                                                                       4.85               period from 1 Jul to 15 Dec 2021
                                                                                                                                                                                      pursuant to the private placement
                                                                                                                                                                                      in Dec 2021
                                                               cents
                                                                                                              1H 2021                                           2H 2021

  Notes:
  (1) For FY 2021, S$12.7 million comprising S$10.0 million and S$2.7 million received from CapitaLand China Trust (CLCT) and Sentral REIT respectively had been retained for general corporate and working capital
      purposes.
  (2) For 2H 2021, an advanced distribution of S$314.3 million or DPU of 4.85 cents for the period from 1 July 2021 to 15 December 2021 is paid on 28 January 2022. The distribution of S$24.5 million or DPU of 0.37 cents
      for the period from 16 December 2021 to 31 December 2021 will be paid on 15 March 2022. S$10.5 million comprising S$9.2 million and S$1.3 million received from CLCT and Sentral REIT respectively had been
      retained for general corporate and working capital purposes.

C a p i t a L a n d I n t e g r a t e d C o m m e r c i a l Tr u s t                                                                                                                                                          5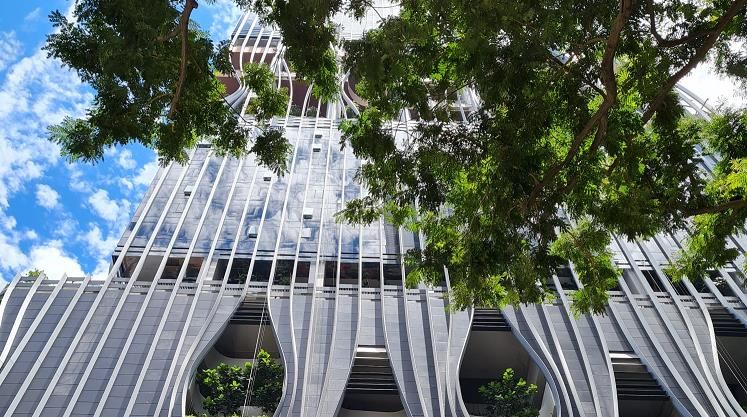
Portfolio and Operational Highlights(1)

            Portfolio                                                     Portfolio Net                                                                                       Portfolio
          Committed                                                            Lettable         10.6                            Portfolio                  3.2                Property              S$22.5
          Occupancy                              93.9%                          Area(2)      million sq ft                       WALE(3)                   years               Value(4)                   billion

                                                                                                      Suburban Mall

                                                                            Portfolio                 ▲13.4%
           FY 2021 Tenants’ Sales(5)
                                                                          ▲12.2%                    Downtown Mall                                                                 ▲2.6% Q-o-Q
                 On quantum basis and comparing                                                                                                Average Office
                                                      year-on-year                                    ▲10.3%                                   Portfolio Rent                  to S$10.33 psf                        (6)

Notes:
(1) As at 31 December 2021 unless otherwise stated. Excludes One George Street which was divested on 9 December 2021.
(2) Based on the total net lettable area (NLA) on 100.0% interest including retail, office and warehouse; and excluding hotels & convention centre as at 31 December 2021.
(3) Portfolio weighted average lease expiry (WALE) is based on gross rental income for the month of December 2021 and excludes gross turnover rent. Includes 94.9% interest in Gallileo and Main Airport Center, Frankfurt;
    and WeWork’s 7-year lease at 21 Collyer Quay.
(4) Based on valuation, including proportionate interests of joint ventures, as at 31 December 2021. The conversion rate used for the 31 December 2021 valuations was EUR1 = S$1.538.
(5) Comparison against FY 2020 tenants’ sales on quantum basis.
(6) Includes CapitaSpring but excludes One George Street.

   C a p i t a L a n d I n t e g r a t e d C o m m e r c i a l Tr u s t                                                                                                                                                       6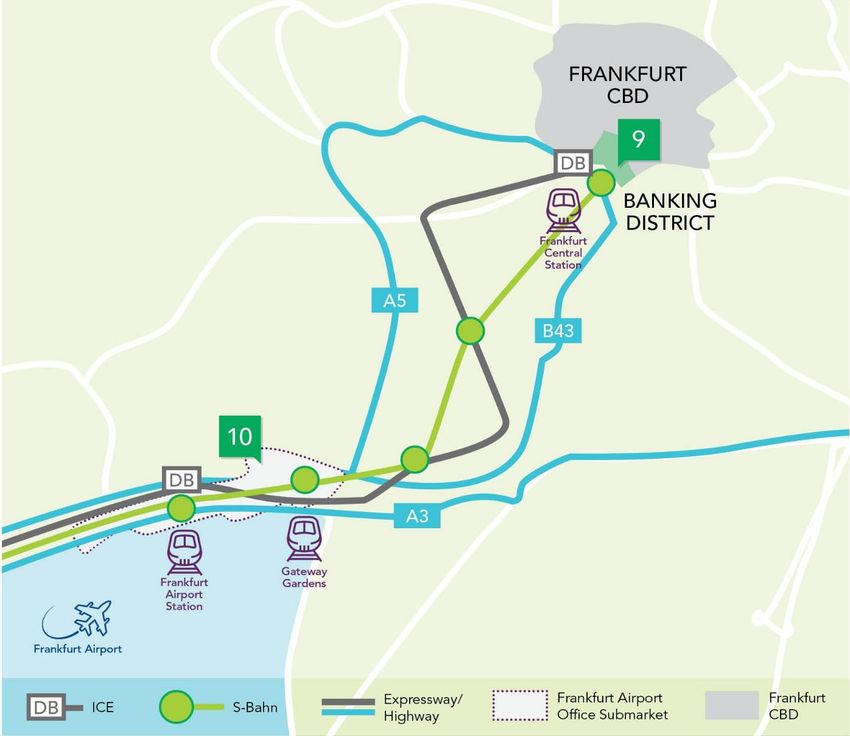
Valuation Increased to S$22.5 Billion as at 31 Dec 2021
   Largely contributed by office and integrated developments, including completion of CapitaSpring,
   driven by improving market conditions

                                              S$22.5 billion(1)                                      3.5%                            S$21.8 billion(1)
                                                     Value as at 31 Dec 2021                                                             Value as at 31 Dec 2020

                                                              Valuation              Valuation                                                                            Range of Cap Rates
                                                                                                                                 Variance
                                                           as at 31 Dec 21        as at 31 Dec 20                                                                           as at 31 Dec 21
                                                             S$ million             S$ million                    S$ million                            %                                %
     Retail Assets                                                      7,401.1        7,379.5                         21.6                            0.3                        4.50 – 6.20

     Office Assets                                                      8,299.4        7,955.7                        343.7                            4.3                        3.40 – 3.75

                                                                                                                                                                            Retail: 4.00 – 4.85
                                                                                                                                                                            Office: 3.63 – 4.00
     Integrated
                                                                        6,825.2        6,437.7                        387.5                            6.0                      Hotel: 4.75
     Development Assets
                                                                                                                                                                           Serviced Residence:
                                                                                                                                                                                    4.50
     Total                                                             22,525.7       21,772.9                        752.8                            3.5

Notes:
(1) Excludes One George Street, a joint venture, which was divested on 9 December 2021. Includes CICT’s share in joint ventures (45.0% in CapitaSpring and 94.9% respectively in Gallileo and Main Airport Center).
(2) Please see slides 73 to 75 for details.

Figures might not add up due to rounding.

C a p i t a L a n d I n t e g r a t e d C o m m e r c i a l Tr u s t                                                                                                                                                  7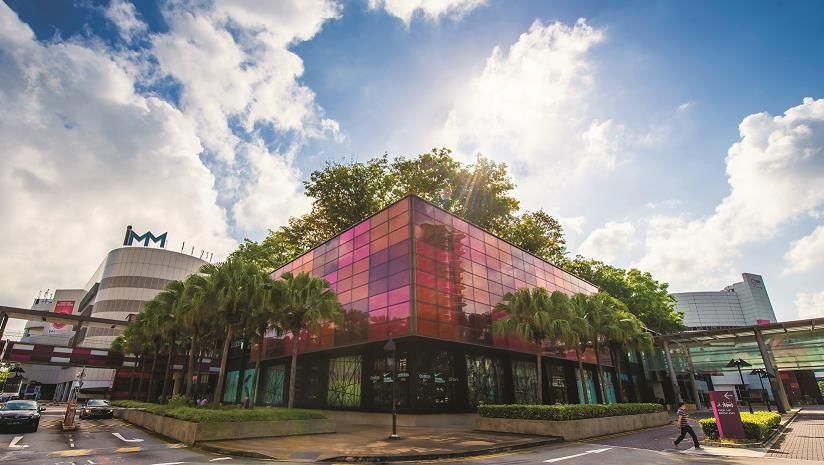
Portfolio Property Value(1) by Geography and Asset Type

                                                                                        Germany,
                                                                                          4.0%

                                                                                   Office,                           Retail,
                                                                                   36.8%                             32.9%
                                                                                                  S$22.5
                                                                                                  billion

                                                                                                     Integrated
                                                                                                    Development,
                                                                                                       30.3%

                                                                                                Singapore,
                                                                                                  96.0%

Note:
(1) Portfolio property value as at 31 December 2021. Includes Gallileo and Main Airport Center (94.9% interest respectively) and CapitaSpring (45.0% interest).

C a p i t a L a n d I n t e g r a t e d C o m m e r c i a l Tr u s t                                                                                              8
CapitaSpring Achieves TOP in November 2021;
 Secures Strong Leasing Commitment of 91.5%(1)
                                                                        Updates                                                             Newly opened and upcoming retail offerings
                                                                        • Committed leases to contribute                                                                          Upcoming openings in 1Q 2022
                                                                         income progressively from 1H                                                                             • %Arabica
                                                                         2022, and more meaningfully from
                                                                                                                                                                                  • Re.juve
                                                                         2H 2022
                                                                                                                                                                                  • Latin-European bistro Sol &
                                                                        • 10 tenants have commenced                                                                                 Luna
                                                                                                                                            New retail offering:
                                                                         operations, and more are in the                                    Bee’s Knees Urban
                                                                                                                                                                                  Openings in 2Q 2022
                                                                         midst of fitting out the premises
                                                                                                                                                                                  • Singapore’s latest sky-high
                                                                        • 299-unit serviced residence                                                                               destination Kaarla
                                                                         Citadines Raffles Place (managed                                                                           Restaurant and Bar serving
                                                                         by Ascott) to open in February                                                                             Coastal Australian cuisine
                                                                         2022                                                                                                     • Oumi, a modern Kappo
                                                                                                                                                                                    dining and raw bar, both
                                                                        • Food Centre (from the former                                                                              supported by fresh produce
                                                                         Golden Shoe Car Park) to open in                                   New retail offering:                    farmed from Singapore’s
                                                                         2Q 2022                                                            Crystal Wine                            tallest urban farm on level 51
Iconic and distinctive facade

 Note:
 (1) As at 31 December 2021. Occupancy based on surveyed building NLA of c. 673,735 sq ft sq ft. Increase in NLA mainly from the office floors. . Another 5% under negotiation.

 C a p i t a L a n d I n t e g r a t e d C o m m e r c i a l Tr u s t                                                                                                                                             9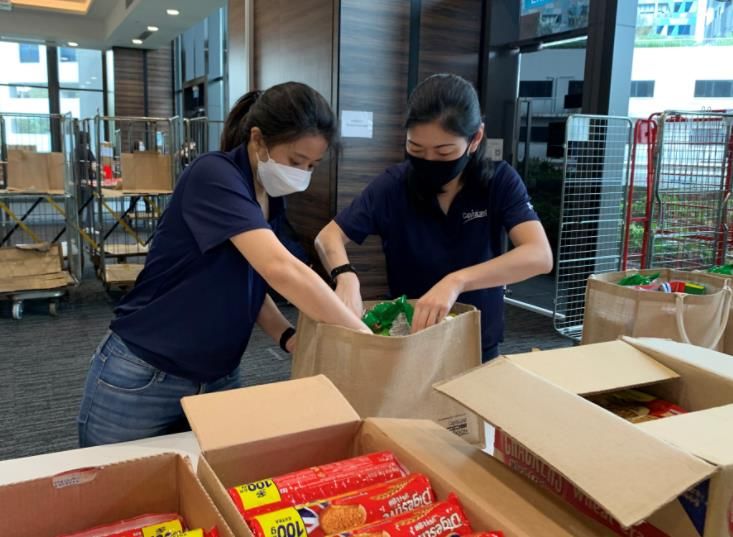
Rejuvenating Retail and Lifestyle Offerings at Downtown
Properties
  RAFFLES CITY SINGAPORE                                                                CLARKE QUAY               FUNAN
  Home to flagships of established international brands                                 Refreshing F&B offering   Enriching experiences
  in fashion, beauty and lifestyle
               Asset enhancement commenced in January 2022
              to reconfigure around 111,000 sq ft of retail space
              to accommodate more specialty retail and large
              format stores
               Enhancement works will complete in 4Q 2022                                                               RazerStore Funan
                                                                                               Sushi Ichizuke
                                                New Offerings

         Calvin Klein’s 3-in-1 concept store                           Acqua di Parma            Hopheads                    Kazo

                                                                                                                   Upcoming opening:
                                                                                                                   • Little Ribbon Pasta Co
                                                                                                                   • Boost Juice
                                                                                                                   • Smile Dessert
                                                                                                                   • X Fitness
                           Elemis                                       House of Wei           Chorong Pocha

C a p i t a L a n d I n t e g r a t e d C o m m e r c i a l Tr u s t                                                                          10
Reconstituting Portfolio to be Better Positioned for Growth
Singapore remains key focus; while expansion into Australia offers another engine of growth and
diversified income base
►01 Divestment ►04 Proposed Acquisitions in Sydney, Australia
Divested 50.0% • Two Grade A office buildings and 50.0% interest in
interest in One George an integrated development comprising Premium
Street for S$640.7 Grade office and a retail centre announced on
million(1) with an exit 3 Dec 2021 and 23 Dec 2021 respectively.
yield of 3.17%
►02 Equity Aggregate property value ~A$1.1 billion(2)
101-103 Miller Street & Greenwood Plaza
Raised gross proceeds (50.0% interest)
of S$250.0 million via Combined implied NPI yield 5.1%(3)
private placement in
Dec 2021 Combined pro forma DPU accretion 2.8%(4)
Contribution to CICT’s pro forma portfolio
property value ~5%
►03 Debt
~50% of loan-to-value 66 Goulburn Street 100 Arthur Street
Notes:
(1) Based on agreed property value (100% basis) or sales consideration of S$1,281.5 million.
(2) Includes rental guarantee for 100 Arthur Street and 101-103 Miller Street and Greenwood Plaza.
(3) As announced on 23 December 2021, the combined implied NPI yield was based on the pro forma 1H 2021 annualised NPI of 101-103 Miller Street and Greenwood Plaza, 66 Goulburn Street and 100 Arthur Street and taking into account the following assumptions: (a) the
acquisitions of the two trusts holding 66 Goulburn Street and 100 Arthur Street as well as 101-103 Miller Street and Greenwood Plaza were completed on 1 January 2021 and held and operated to 30 June 2021; (b) including rental guarantee for 100 Arthur Street; (c) the
tenants and committed tenants of 100 Arthur Street as at 30 September 2021 were in place on 1 January 2021.
(4) Assuming a loan-to-value of approximately 50% for the proposed acquisitions and the balance of the total acquisition outlays to be funded from a combination of net sales proceeds from the divestment of 50.0% interest in One George Street (Divestment) and net proceeds
from the private placement closed on 8 December 2021. Pro forma annualised DPU for 1H 2021 assumes the Divestment and the proposed acquisitions of the three Australian properties had been completed on 1 January 2021.
C a p i t a L a n d I n t e g r a t e d C o m m e r c i a l Tr u s t 11Unlocking Value from the Divestment of JCube
CICT has done various
initiatives to enhance the
value of the property over the
Sale of JCube years
for S$340.0m
at NPI yield ofFinancial
Performance
CapitaSpring, SingaporeFY 2021 Results Underpinned by Enlarged Portfolio and
100% Contribution from RCS
FY 2021 FY 2020 Net Property FY 2021 FY 2020
Gross (1) (2)
Revenue S$1,305.1M S$745.2M Income S$951.1M S$512.7M
Retail Asset Performance Office Asset Performance(3) Integrated Development
(S$ m) (S$ m) Performance(4)
(S$ m)
537.7
474.3
377.8 387.4 380.0
317.8 295.3 278.0
197.7
139.4
73.2 55.5
Gross Revenue NPI Gross Revenue NPI Gross Revenue NPI
FY 2020 FY 2021 FY 2020 FY 2021 FY 2020 FY 2021
Notes:
(1) Includes rental waivers of S$27.3 million granted by landlord to tenants affected by COVID-19 in FY 2021.
(2) Includes rental waivers of S$128.4 million granted by landlord to tenants affected by COVID-19 in FY 2020.
(3) Income contribution from office assets is from 21 October 2020 onwards. Income contribution excludes joint ventures.
(4) Income contribution from integrated development RCS is included on a 100.0% basis from 21 October 2020 onwards as it was a joint venture of CICT on a 40.0% basis prior to the merger. Excludes income
contribution from CapitaSpring as it is a joint venture.
C a p i t a L a n d I n t e g r a t e d C o m m e r c i a l Tr u s t 14Diversified Revenue Streams Provides Stability
Singapore Germany Office,
Hotels & 4.3%
Convention
Centre, 5.7%
Singapore (2)
Office, 6.4% Singapore
Suburban Retail,
32.2%
S$1,305.1
Singapore CBD
Office, 25.4%
million(1)
Singapore
Downtown Retail,
26.0%
Notes:
(1) Based on FY 2021 gross revenue and excludes joint ventures.
(2) Comprises office revenue contribution from Funan, Raffles City Singapore and The Atrium@Orchard.
C a p i t a L a n d I n t e g r a t e d C o m m e r c i a l Tr u s t 15Healthy Balance Sheet
As at 31 December 2021
S$’000
Non-current Assets 21,979,809 Net Asset Value/Unit S$2.06(1)
Current Assets 762,041 Adjusted Net Asset Value/Unit
S$2.06(1)
22,741,850 (excluding distributable income(2))
Total Assets
Current Liabilities 1,258,809
Non-current Liabilities 7,787,341
Total Liabilities 9,046,150
Unitholders’ Funds 13,667,754
Non-controlling interests 27,946
Net Assets 13,695,700
Units in Issue (’000 units) 6,608,618
Notes:
(1) Takes into account the declared advanced distribution of 4.85 cents for the period from 1 July to 15 December 2021.
(2) Relates to the distribution income for the period from 16 December to 31 December 2021.
C a p i t a L a n d I n t e g r a t e d C o m m e r c i a l Tr u s t 16Well-diversified Sources of Funding as at 31 Dec 2021
Facilities in place to refinance debt due 2022(1)
S$ million
17% Funding sources as at 31 Dec 2021(2)
1,600 17%
1,491
1,435 15%
1,400 MTN 59%
1,311
13%
1,200 Unsecured Bank
1,099 11% 31%
Loans
870 991
1,000 900 Secured Bank
265
10%
832 8% Loans
299
800 718
7% Proforma impact assuming +0.1%
580 p.a. increase in interest rate
600 513 178
418 5%
400 Estimated
204 460 3% +S$1.48 million
621 additional annual
535 p.a.(3)
514
1%
2% 1% interest expenses
200 407
321 275 300 250
120 150 125
75 Estimated DPU -0.02 cents(4)
0
2022 2023 2024 2025 2026 2027 2028 2029 2030 2031 2032 2033
Unsecured Bank Loans Secured Bank Loans Medium Term Notes (“MTN”)
Notes:
(1) Excluding debt under joint venture due in 2022.
(2) Based on CICT Group’s borrowings, including proportionate share of joint ventures’ borrowings.
(3) Computed on full year basis on floating rate borrowings of CICT Group (including proportionate share of joint ventures’ borrowings) as at 31 December 2021.
(4) Based on the number of units in issue as at 31 December 2021.
Please visit CICT website for details of the respective MTN.
C a p i t a L a n d I n t e g r a t e d C o m m e r c i a l Tr u s t 17Proactive Capital Management
As at As at
31 December 2021 30 September 2021
Total Borrowings (S$ billion) 8.6 9.5
Aggregate Leverage(1,2) 37.2%(3) 40.9%
% of Borrowings on Fixed Interest Rate 83% 84%
% of Total Assets that are Unencumbered 96.1% 95.7%
Net Debt / EBITDA(4) 9.5x N.M.(5)
Interest Coverage(2,6) 4.1x 4.1x
Average Term to Maturity (years) 3.9 4.1
Average Cost of Debt(7) 2.3% 2.3%
CICT’s Issuer Rating ‘A3’ by Moody’s ‘A3’ by Moody’s
‘A-’ by S&P ‘A-’ by S&P
Notes:
(1) In accordance with Property Funds Appendix, CICT’s proportionate share of its joint ventures’ borrowings and deposited property values are included when computing aggregate leverage. Correspondingly,
the ratio of total gross borrowings to total net assets is 63.1%.
(2) Following the release of the circular dated 28 December 2021 from Monetary Authority of Singapore to exclude the land lease liabilities and interest expense on lease liabilities in the computation. On the
same basis, the aggregate leverage and interest cover as at 30 September 2021 remain the same as previously reported.
(3) Pro forma aggregate leverage post acquisition of the three Australian properties is 40%.
(4) Net Debt comprises Gross Debt less total cash and EBITDA refers to earnings of CICT Group, before interest, tax, depreciation and amortisation (excluding effects of any fair value changes of derivatives and
investment properties, foreign exchange translation and non-operational gain/loss), on a trailing 12-month basis.
(5) N.M.: Not meaningful for information as at 30 September 2021 as net debt includes CCT’s and RCS’s borrowings but the incremental EBITDA from the acquired entities after the Merger is only from 1 January
2021 to 30 September 2021.
(6) Ratio of earnings of CICT Group, before interest, tax, depreciation and amortisation (excluding effects of any fair value changes of derivatives and investment properties, foreign exchange translation and non-
operational gain/loss) over interest expense and borrowing-related costs, on a trailing 12-month basis.
(7) Ratio of interest expense over weighted average borrowings.
C a p i t a L a n d I n t e g r a t e d C o m m e r c i a l Tr u s t 18Portfolio
Raffles City Singapore, Singapore
PerformancePortfolio WALE(1)(2) Stable at 3.2 years
18.2%
15.8%
14.3%
9.6% 9.1%
8.3%
5.2% 5.1% 4.7%
3.3% 2.8% 2.6%
1.0%
(3) (4)
2022 2023 2024 2025 2026 2027 and beyond
Retail Office Hospitality
Notes:
(1) Weighted average lease expiry (WALE) based on monthly gross rental income as at 31 December 2021 and excludes gross turnover rents.
(2) Based on 45.0% interest in CapitaSpring, Singapore and 94.9% interest in Gallileo and Main Airport Center, Frankfurt; and WeWork’s 7-year lease at 21 Collyer Quay.
(3) Two expiring leases are renewed in January 2022.
(4) The existing lease with Commerzbank will terminate in January 2024. The CICT manager is exploring plans for the building.
C a p i t a L a n d I n t e g r a t e d C o m m e r c i a l Tr u s t 20No Single Tenant Contributes More Than 5% of CICT’s
Total Gross Rental Income(1)
% of Total
Ranking Top 10 Tenants for December 2021 Trade Sector
Gross Rent
1 RC Hotel (Pte) Ltd 4.9 Hotel
2 WeWork Singapore Pte. Ltd.(2) 2.8 Real Estate and Property Services
Supermarket / Beauty & Health / Services / Food &
3 NTUC Enterprise Co-operative Ltd 2.2
Beverage / Education / Warehouse
4 Commerzbank A.G.(3) 2.2 Banking
5 Temasek Holdings (Private) Limited 2.0 Financial Services
6 GIC Private Limited 1.7 Financial Services
7 Cold Storage Singapore (1983) Pte Ltd 1.7 Supermarket / Beauty & Health / Services / Warehouse
8 BreadTalk Group Limited 1.4 Food & Beverage
9 The Work Project (Commercial) Pte. Ltd. 1.1 Real Estate and Property Services
10 BHG (Singapore) Pte. Ltd. 1.1 Department Store
Total top 10 tenants’ contribution 21.1
Notes:
(1) For month of December 2021 and excludes gross turnover rent.
(2) Income contribution comprised of the tenant’s ongoing lease at Funan and 7-year lease at 21 Collyer Quay starting from late 2021. Rent payment for 21 Collyer Quay lease expected in 2Q 2022.
(3) Based on 94.9% interest in Gallileo, Frankfurt. The existing lease with Commerzbank will terminate in January 2024. The CICT manager is exploring plans for the building.
C a p i t a L a n d I n t e g r a t e d C o m m e r c i a l Tr u s t 21Diversified Tenants’ Business Trade Mix
IT, Media and
Telecommunications
Travel and Hospitality 3.8% Other Retail and Product Trades
5.0% Gifts & Souvenirs / Toy & Hobbies /
Real Estate and Books & Stationery / Sporting
Other Retail and Product goods 2.8%
Property Services,
Trades Supermarket 2.7%
6.8%
23.7%
Services 2.6%
Leisure & Entertainment / Music &
Fashion Video 2.3%
5.6% IT & Telecommunications 2.2%
Department Store 2.1%
% of gross rental Home Furnishing 2.1%
Beauty & Health Shoes & Bags 1.8%
7.5%
income(1)
for December 2021 Electrical & Electronics 1.6%
Jewellery & Watches 1.3%
Other Office Trades
Others 1.2%
10.3%
Education 1.0%
Other Office Trades
Business Consultancy 2.3%
Energy and Commodities 1.9%
Banking, Insurance and Government 1.9%
Financial Services Manufacturing and Distribution 1.8%
17.4% Food & Beverage Legal 1.3%
19.9% Maritime and Logistics 1.0%
Others 0.1%
Note:
(1) Excludes gross turnover rent.
C a p i t a L a n d I n t e g r a t e d C o m m e r c i a l Tr u s t 22Performance
by Asset Type
Note:
The retail and office asset information
included the respective retail and office
IMM Building, Singapore components of integrated developments
unless stated otherwise, in order to
show the operating metrics and trends.Retail Performance Overview
Compared Against FY 2019 Compared Against FY 2020 4Q 2021 New Retail Offerings and Expansion
Monthly Average Monthly Average
by NLA
Retail FY 2021 Tenants’ Sales psf
Occupancy(1) Large majority are new-to-market or new-to-portfolio
Recovered to Recovered to
96.8% 87.8% 99.8% Shoes &
Supermarket,
as at 31 Dec 2021 2.1%
FY 2021 Shopper Traffic Bags, 2.2% Others,
Sporting 4.6%
Recovered to Recovered to Goods,
3.6%
61.2% 97.8% Fashion & Fashion
Accessories, 5.3%
FY 2021 Retention FY 2021 Rental Reversion
Rate(2) Food &
Department
Beverage,
Year 1 rents vs outgoing final Incoming average rents vs Store, 5.9%
82.3% rents outgoing average rents
38.2%
Services,
▼7.3% ▼3.2% 6.1%
Beauty &
Health,
10.7%
Home
Furnishing,
Notes:
21.4%
(1) Retail occupancy includes retail only properties and the retail components within integrated developments.
(2) Based on number of renewed vs expiring leases.
C a p i t a L a n d I n t e g r a t e d C o m m e r c i a l Tr u s t 24Driving Occupancy Through Active Asset
Management and Proactive Leasing Strategy
Occupancies improving and above URA’s Singapore retail occupancy rate of 91.9%(2)
Occupancy (%)
100 100 100 100 99.8 100 98.7 99.1 99.7 99.9 97.3 99.2 98.9 99.2
96.8 98.5 98.1 97.3 95.4 94.1 95.5
97.3 97.5
91.5 92.1 92.2
79.4
73.5
As at 30 September 2021 As at 31 December 2021
Notes:
(1) Retail occupancy includes retail only properties the retail components within integrated developments.
(2) Based on URA’s island-wide retail space vacancy rate for 3Q 2021, pending the release of the same for 4Q 2021.
(3) Clarke Quay’s occupancy was due to leases affected by government-stipulated restrictions on trading hours and sales of alcohol at nightlife venues like clubs, karaoke joints and bars without food licenses.
(4) Comprises JCube and Bukit Panjang Plaza.
C a p i t a L a n d I n t e g r a t e d C o m m e r c i a l Tr u s t 25Rental Reversion Decline Rate Continued to Ease
From 1 January to 31 December 2021 (Excluding Newly Created and Reconfigured Units)(1)
Net Lettable Area Change in Incoming Year 1 Rents vs
No. of Renewals / Retention Rate
Properties Percentage of Outgoing Final Rents (typically
New Leases (%) Area (sq ft)
Mall (%) includes annual step-ups) (%) (2)
Suburban(3) 438 82.6 611,234 27.0 (2.4)
Downtown(4) 296 81.8 437,999 19.6 (13.8)
CICT Portfolio 734 82.3 1,049,233 22.3 (7.3)
From 1 January to 31 December 2021 (Excluding Newly Created and Reconfigured Units)(1)
Net Lettable Area
No. of Renewals / Retention Rate Change in Incoming Average Rents vs
Properties Percentage of
New Leases (%) Area (sq ft) Outgoing Average Rents (%) (2)
Mall (%)
Suburban(3) 438 82.6 611,234 27.0 0.2
Downtown(4) 296 81.8 437,999 19.6 (7.7)
CICT Portfolio 734 82.3 1,049,233 22.3 (3.2)
Notes:
(1) Based on retail leases only.
(2) Exclude gross turnover rents, which is between 4% and 10% of respective mall’s retail gross rental income. Clarke Quay is excluded from the range as it has been affected by government-stipulated restrictions
on trading hours and sales of alcohol at nightlife venues like clubs, karaoke joints and bars without food licenses.
(3) Suburban malls comprise Tampines Mall, Bedok Mall, Junction 8, Lot One Shoppers’ Mall, Bukit Panjang Plaza, IMM Building, Westgate and JCube.
(4) Downtown malls comprise Plaza Singapura, The Atrium@Orchard, Bugis Junction, Bugis+, Clarke Quay, Raffles City Singapore and Funan.
C a p i t a L a n d I n t e g r a t e d C o m m e r c i a l Tr u s t 26Proactive Leasing Strategy to Manage Tenant Mix and
Mall Positioning
Retail Portfolio WALE(1) : 1.9 years
31.7%
27.7%
25.0%
9.0%
4.9%
1.7%
2022 2023 2024 2025 2026 2027 and beyond
Gross Rental Income
Note:
(1) Based on gross rental income of committed leases in retail properties and retail components in Integrated Development as at 31 December 2021.
C a p i t a L a n d I n t e g r a t e d C o m m e r c i a l Tr u s t 27FY 2021 Average Monthly Tenants’ Sales psf(1) and Shopper
Traffic On Par with 2020 Level
Recovery levels for tenants’ sales and shopper traffic
at CICT retail portfolio vs average for 2019 Recovery Progress
Start of Stabilisation End of
150% Phase Stabilisation Periods of Comparison: Suburban
Start of Circuit Breaker Start of Phase 3 Phase and Portfolio Downtown
Relaxation of
- 2019 average(1) Mall
- Year-on-year(2) Average Mall Average
End of Phase 2 (HA) Dining-in to 5 Average
Start of Phase pax
1 and 2
Start of Phase 2 (HA)
2019
100% 2019 87.8% 96.0% 76.8%
FY 2021 Average
Average(1)
Tenants’
Sales
psf(3) Year-on-
99.8% 99.4% 99.6%
year
50%
2019
61.2% 65.4% 56.3%
Average
FY 2021
Shopper
0% Traffic
Year-on-
Aug-20
Sep-20
Aug-21
Sep-21
Feb-20
Feb-21
Jan-20
Jun-20
Jul-20
Jan-21
Jun-21
Oct-20
Jul-21
Oct-21
Apr-20
May-20
Apr-21
May-21
Mar-20
Nov-20
Dec-20
Mar-21
Nov-21
Dec-21
97.8% 99.3% 95.8%
year
Tenant Sales $psf/month Shopper Traffic
Notes:
(1) FY 2019 average shopper traffic and tenants’ sales psf per month. Tenants’ sales psf adjusted for non-trading days.
(2) FY 2020 average shopper traffic and tenants’ sales psf per month. Tenants’ sales psf adjusted for non-trading days.
(3) FY 2021 average tenants’ sales psf per month. Adjusted for non-trading days.
C a p i t a L a n d I n t e g r a t e d C o m m e r c i a l Tr u s t 28Most Trade Categories Registered an Y-o-Y Improvement
for FY 2021 Tenants’ Sales
Total tenants’ sales increased 12.2% Y-o-Y
FY 2021 Tenants’ Sales(1) Y-o-Y Performance by Trade Categories
23.9%
7.8% 6.9% 5.7% 4.0% 3.6% 2.8% 0.6% 0.4%
-4.8% -6.5% -7.7% -8.5%
-12.1%
-26.4%
Services (2)
(3)
Food & Beverages
Education
IT & Telecommunications
Beauty & Health
Department Store
Fashion
Books & Stationery
Electrical & Electronics
Jewellery & Watches
Home Furnishing
Shoes & Bags
Sporting Goods
Supermarket
Leisure & Entertainment
▲
Top five trade categories contributed > 68% of total retail gross rental income(4): 0.1% Y-o-Y
Notes:
(1) Tenants’ sales is based on $ per square foot per month.
(2) Comprises convenience stores, bridal shops, optical shops, film processing shops, florists, magazine stores, pet shops, travel agencies, cobblers/locksmiths, laundromats and clinics.
(3) Leisure & Entertainment was impacted by government-stipulated restrictions on trading hours and sales of alcohol at nightlife venues like clubs, karaoke joints and bars without food licenses.
(4) For the period January to December 2021. Excludes gross turnover rent.
C a p i t a L a n d I n t e g r a t e d C o m m e r c i a l Tr u s t 29Office Performance Overview
Singapore and Germany office assets
Increase in leasing enquiries for expansion and
Office Total New and Renewal Leases (sq ft) new set-up space Q-o-Q(5)
Occupancy(1)
256,990 7%
91.5% 4Q 2021 23%
12%
as at 31 Dec 2021 (New leases: 70.2%(2)) 13%
38%
Singapore office assets 57%
Office Average Tenant Retention Return of office 32%
Occupancy(1) SG Office Rent(3) Rate community for week 18%
ended 21 Jan 2022
3Q 2021 4Q 2021
(4)
90.4% S$10.33 psf 69.3% 36.9% Relocation Expansion Consolidation New set-up
as at 31 Dec 2021 as at 31 Dec 2021 FY 2021
Top three business sectors by space requirement
1. IT, Media & Telecommunications
2. Banking, Insurance & Financial Services
3. Maritime & Logistics
Notes:
(1) Based on committed occupancy.
(2) NLA of new leases in 4Q 2021 is approximately 180,500 square feet. Trade sectors of new committed leases in Singapore are mainly from Business Consultancy, Banking and Real Estate and Property Services.
(3) Excludes Funan and The Atrium@Orchard. If including Funan and The Atrium@Orchard, the average Singapore office rent would be S$10.02 psf.
(4) From 1 January 2022, 50% of employees could return to office.
(5) Observation based on leasing enquiries seen in CICT’s office portfolio. Percentages were based on required space and intention indicated by prospects and does not take into account their existing space.
C a p i t a L a n d I n t e g r a t e d C o m m e r c i a l Tr u s t 30Occupancy Rate of Office Portfolio at 91.5%
Occupancy for Singapore: Occupancy for Germany:
CICT’s office portfolio: 90.4% CICT’s portfolio: 95.8%
(4)
CBRE SG Core CBD: 93.3% Frankfurt Market: 92.5%
(1)
Occupancy (%)
97.2 100 100 100 100
95.6 92.4 94.8 95.6 93.4 93.0 93.0
91.5
82.8 79.8 79.7
76.8
Asia Square Tower 2 Capital Tower (2) CapitaGreen Six Battery Road(3) Raffles City Tower CapitaSpring(5) Funan (Office) Gallileo Main Airport Center
(Office)
As at 30 September 2021 As at 31 December 2021
Notes:
(1) 21 Collyer Quay and The Atrium@Orchard are both at 100% occupancy with committed long-term leases.
(2) About 17.7% of Capital Tower’s NLA is under advanced negotiation.
(3) Six Battery Road’s partial upgrading is completing in phases. Secured an anchor tenant in January 2022, which will boost building occupancy to 89.3%.
(4) Frankfurt office market occupancy as at 4Q 2021.
(5) CapitaSpring achieved TOP in November 2021.
C a p i t a L a n d I n t e g r a t e d C o m m e r c i a l Tr u s t 31As Office Market Rents Improve, Gap Between Committed
Rents and Expired Rents is Expected to Narrow
Market Rents of
Average Expired Committed Comparative Sub-Market (S$ psf)
Building Rents Rents in 4Q 2021 Sub-Market
Cushman & (2)
(S$ psf/month) (S$ psf/month) (1) Knight Frank
Wakefield
CapitaGreen 11.93 10.80 – 12.70
Grade A
9.76 9.10 – 9.60
Raffles Place
Six Battery Road 10.47 10.67 – 13.00
Asia Square Tower 2 11.22 10.47 – 12.50 Marina Bay 11.53 10.95 – 11.45
City Hall/
Raffles City Tower 9.48 9.40 – 10.50 9.33 8.85 – 9.35
Marina Centre
Notes:
(1) Source: Cushman & Wakefield 4Q 2021
(2) Source: Knight Frank 4Q 2021
For reference only: CBRE Pte. Ltd.’s 4Q 2021 Grade A core CBD rent is S$10.80 psf per month and they do not publish sub-market rents.
C a p i t a L a n d I n t e g r a t e d C o m m e r c i a l Tr u s t 32Proactively Manage Lease Expiry For Stability Through
Market Cycles
Office Portfolio WALE(1): 3.2 years
27.7%
25.2%
23.7%
20.2%
13.7%
20.7% 11.6%
18.4% 23.6% 9.1%
21.9% 8.7% 7.8%
6.8%
(2) (3)
2022 2023 2024 2025 2026 2027 and beyond
Renewals Completed in Jan 2022 and Leases Under Negotiation Monthly Gross Rental Income Occupied Net Lettable Area
Notes:
(1) Based on gross rental income as at 31 December 2021. Includes CapitaSpring, Raffles City Tower, Funan (office), The Atrium@Orchard (office), Gallileo and Main Airport Center’s leases; and WeWork’s 7-year lease
at 21 Collyer Quay from late 2021. Rent payment for 21 Collyer Quay expected in 2Q 2022.
(2) Two expiring leases are renewed in January 2022.
(3) The existing lease with Commerzbank will terminate in January 2024. The CICT manager is exploring plans for the building.
C a p i t a L a n d I n t e g r a t e d C o m m e r c i a l Tr u s t 33Balancing Occupancy and Rental Rate While Managing
Tenants’ Space Requirements
4Q 2021 Grade A office market rent at S$10.80 psf per month(1)
2022
Average rent of leases expiring is S$9.03 psf (2)
20% 16 Period 1H 2022 2H 2022
Monthly Monthly
% of Rental Rates % of Rental Rates
15% 11.67 12 Building Expiring of Expiring Expiring of Expiring
$11.31 $11.33 Leases Leases Leases Leases
(S$ psf) (S$ psf)
10% 8
Asia Square Tower 2 0.4% 11.80 3.4% 11.25
$5.99
5% 3.8% 4.3% 4 Capital Tower 4.2%(3) 5.94 0.1% 9.74
3.5% 3.3%
CapitaGreen 1.5% 11.65 1.9% 11.08
0% 0
Asia Square Capital Tower CapitaGreen Six Battery Road
Tower 2 Six Battery Road 2.0% 11.28 1.2% 12.36
Average monthly gross rental rate for expiring leases (S$ psf / month)
Monthly gross rental income for leases expiring at respective properties X 100% Total / Weighted Average 8.2% 7.73 6.7% 11.37
Monthly gross rental income for office portfolio
Notes:
(1) Source: CBRE Pte. Ltd. as at 4Q 2021.
(2) Four Grade A buildings only. Ancillary retail leases excluded from all buildings.
(3) 1H 2022 lease expiry with a major anchor tenant was renewed in January 2022.
Total percentage may not add up due to rounding.
C a p i t a L a n d I n t e g r a t e d C o m m e r c i a l Tr u s t 34Continue to Proactively Manage Lease Renewals
2023 2024
(1) (1)
Average rent of leases expiring is S$11.07 psf Average rent of leases expiring is S$10.41 psf
20% 20%
11.96
11.35 11.54
15% 11.09 10.76 15% 10.79
8.52 8.77
10% 10%
4.6% 4.5% 4.6%
5% 3.8% 5% 3.9%
2.2% 2.1%
0.2%
0% 0%
Asia Square Tower 2 Capital Tower CapitaGreen Six Battery Road Asia Square Tower 2 Capital Tower CapitaGreen Six Battery Road
Average monthly gross rental rate for expiring leases (S$ psf / month)
Monthly gross rental income for leases expiring at respective properties X 100%
Monthly gross rental income for office portfolio
Note:
(1) Four Grade A buildings only. Ancillary retail leases excluded from all buildings.
C a p i t a L a n d I n t e g r a t e d C o m m e r c i a l Tr u s t 35Occupancy Rate of Integrated Developments at 96.0%
Occupancy (%)
98.1 99.1 97.7 97.3
93.4 94.4 91.5
Retail: 95.4 Retail: 98.5 Retail: 96.2
Retail: 91.5 Office: 93.4 Retail: 96.8 Office: 100 Retail: 96.8 Office: 100
Office: 95.6 Office: 100 Office: 100
Raffles City Singapore Funan Plaza Singapura & The CapitaSpring (1)
Atrium@Orchard
As at 30 September 2021 As at 31 December 2021
Note:
(1) CapitaSpring achieved TOP at November 2021. Committed occupancy includes office and ancillary retail space but does not include the serviced residence component.
C a p i t a L a n d I n t e g r a t e d C o m m e r c i a l Tr u s t 36Addition of CapitaSpring’s Leases Contributed to
Stable WALE Q-o-Q
Integrated Development Portfolio WALE(1) : 5.0 years
21.3%
15.2%
13.9%
10.6% 10.8%
7.7%
5.0% 4.3%
3.3% 4.1%
1.6% 1.7%
0.5%
2022 2023 2024 2025 2026 2027 and beyond
Retail Office Hospitality
Note:
(1) Based on gross rental income as at 31 December 2021 including CapitaSpring and excludes turnover rents.
C a p i t a L a n d I n t e g r a t e d C o m m e r c i a l Tr u s t 37Creating Value Funan, Singapore
Building a Community for Work, Live and Play at
CapitaSpring
Harmonising architecture, technology and nature at work with core and flex office solutions

                                                                                                                      City Room, a 18-metre-high public atrium
                                                                                                                      suitable for placemaking initiatives

                                                                                                                                                                 Secure bike parking with end-of-trip facilities

                                                                           Seamless access with facial recognition,
                                                                           turnstiles and DCS lift system

        18-metre media wall with interactive digital art installation by
        teamLab
                                                                                                                      Lobby of Citadines Raffles Place
                                                                                                                      Singapore, home for the business or
                                                                                                                      bleisure travellers

C a p i t a L a n d I n t e g r a t e d C o m m e r c i a l Tr u s t                                                                                                                                               39
AEI Works at 21 Collyer Quay Achieved TOP; Six
Battery Road to Achieve TOP in 1Q 2022
Six Battery Road 21 Collyer Quay
✓ Most of the ✓ TOP obtained on
area in level 1 1 October 2021
podium
obtained TOP ✓ WeWork’s 7-year
lease(1) commenced
✓ Committed
in December 2021
retail units to Render from WeWork: Private office
open in 2Q
2022 ✓ Opening 3Q 2022
Render from WeWork: Common Area
Note:
(1) Rent payment for 21 Collyer Quay expected in 2Q 2022.
C a p i t a L a n d I n t e g r a t e d C o m m e r c i a l Tr u s t 40Improving Connectivity to Funan for Shoppers and
Working Executives
100-metre underground pedestrian link opened in December 2021 directly linking Basement 2 to
the City Hall MRT interchange station, facilitating traffic flow to and fro Funan especially during the
festive period which saw higher shopper traffic across the malls
Supporting and championing local artists, the underpass showcases creative multimedia works, such as visual
artist's digital take on Funan’s six passion themes - tech, craft, play, fit, chic and taste.
C a p i t a L a n d I n t e g r a t e d C o m m e r c i a l Tr u s t 41Connecting with Shoppers and Community at our Malls
Hot Toys Summer Never Ends SG Showcase at
A Jolly Molly Christmas with CapitaLand x POP Mart Funan
CapitaLand in collaboration with POP Mart celebrated Hot Toys hosted its Summer Fiesta with Funan as
Molly Southeast Asia’s biggest 15th anniversary its second stop in the world. The exhibition
celebration during this festive season at all our malls. features three life-sized sculptures from box-office
topper The Avengers.
Love, BE@RBRICK at Raffles City Singapore J.Walkers+ Virtual Walk 2021
Christmas celebration with the first-ever collaboration with Encouraging the community to adopt a healthier lifestyle,
BE@RBRICK by Medicom Japan and ActionCity. At the heart IMM Building, JCube and Westgate partnered Ng Teng
of the campaign was the world’s tallest BE@RBRICK 8000%, Fong General Hospital to host the J-Walkers+ Virtual
which stood at a whopping height of 5.6 metres. Walk 2021.
National Library Board - LAB25 Experiential
Molly 15: Into The Future
Activations X CapitaLand
Exhibition at Funan
The first-ever Molly 15: Into the
In collaboration with the National Library Board to bring
Future exhibition featured the never-
learning and discovery into everyday spaces, seven
before-seen Mega Space Molly
malls hosted immersive larger-than-life installation,
Christmas 400%.
wallpapers and lift decals.
C a p i t a L a n d I n t e g r a t e d C o m m e r c i a l Tr u s t 42Exciting Shoppers with New Retail Offerings 4Q 2021
F&B Services Beauty & Health Jewellery & Watches
Bath & Body Works at Plaza
Shake Shack at Westgate Photomania at Bugis+ Singapura Garmin at Westgate
F&B Toys & Hobbies Beauty & Health Fashion
The Cosmetics Company Store at
Läderach at Westgate Hakken! at Bugis Junction IMM Building SuperGurl at Plaza Singapura
F&B Home Furnishing Beauty & Health
Hermetise at Raffles City
SG Hawker at Clarke Quay Absolute Bedding at IMM Building Singapore
C a p i t a L a n d I n t e g r a t e d C o m m e r c i a l Tr u s t 43Supporting Tenants via Loyalty Programme and
Omnichannel Strategy
Membership Loyalty Program
>1.2M >3.5M 15%(1) >3,000 Awarded Excellence in
Loyalty Marketing
CapitaStar Monthly Customer Retailers (Bronze) by Marketing
Members App Views Onboard Excellence Awards 2021
Stickiness
✓ Driving Better Experiences For Members ✓ Omnichannel Support for Retailers
1 Workspace Solutions Complements offline presence in malls
Offers convenience and connectivity to office >400 163% 87%
community at 10 workspace properties brands Uplift in Uplift in Y-O-Y
onboard Y-O-Y GMV Transactions
2 Payment Platform
>$100M >128% >95%
Annual Sales Y-O- Y Growth in Acceptance >250 73% 38%
eCapitaVoucher Sales(2) Rate brands Uplift in Uplift in Y-O-Y
onboard Y-O-Y GMV Transactions
3 Leverage Partnerships’ Benefits
Notes:
(1) Based on annual gross turnover spending on a year-on-year comparison
(2) Sales of eCapitaVoucher based on 2021 vs 2020.
C a p i t a L a n d I n t e g r a t e d C o m m e r c i a l Tr u s t 44Ongoing Commitment to ESG
ESG Ratings
• Rated overall Low Risk by Sustainalytics
• Rated A by MSCI
Launched Fraud, Bribery & Corruption awareness online training completed by almost
100% of employees
All suppliers with new or renewal contracts in 2021 have signed CapitaLand’s Supply
Chain Code of Conduct
All term contractors underwent online training on Fraud, Bribery & Corruption in 2021
Piloted automated trash sorting bins at one of our malls
Teamed up with NEA to place more Reverse Vending Machine (RVM) at 13 of our malls.
The RVMs have collected more than 290,000 beverage containers as of December 2021
C a p i t a L a n d I n t e g r a t e d C o m m e r c i a l Tr u s t 45Fostering a Caring and Inclusive Community
Essential packs handed to close to
2,900 seniors in partnership with 7
local charities across Singapore from
16 to 20 Nov 2021
More than 310 staff and 25 tenant companies
community volunteers from volunteered
CapitaLand volunteered
C a p i t a L a n d I n t e g r a t e d C o m m e r c i a l Tr u s t 46Strategy
and Outlook
Capital Tower, SingaporeCICT’s Value Creation Strategy
To deliver stable distributions and sustainable returns to unitholders
• Investing through property market
cycles in Singapore, Germany and
• Undertaking appropriate divestment of other developed markets
assets that have reached their optimal
life cycle Portfolio • Guide for overseas exposure not more
reconstitution Acquisition than 20% of portfolio value
• Redeploying divestment proceeds into
higher yielding properties or other • Seeking opportunities from third
growth opportunities parties and CapitaLand
• Asset class focus: Retail, office and
Asset enhancement integrated developments
and redevelopments
• Achieving the highest and best use for properties
• Repositioning or repurposing single use assets in line with changing real
estate trends and consumers’ preferences
• Redeveloping properties from single use to integrated projects
C a p i t a L a n d I n t e g r a t e d C o m m e r c i a l Tr u s t 48Strengthening Operations to Tap on Broadly Positive
Economy and Market Outlook
Positive Economic Outlook
• 2021 GDP growth was 7.2% year-on-year based on advance estimates(1)
in Singapore
• 2022 GDP growth expected between 3.0% and 5.0%(1)
• Overall unemployment rate declined 2.6% in Oct 2021 to 2.5% in Nov 2021(2)
Office(3)
• Grade A CBD office rents continued to rise Q-o-Q in 4Q 2021
• Grade A market supported by strong demand from sectors such as technology and non-
banking financial services amidst stable office market fundamentals
• Office rents in Singapore remain competitive vis-à-vis other Asian gateway markets and
Positive outlook for Singapore will continue to remain as an attractive strategic location for businesses
retail and office markets
Retail (3)
• Gap between Orchard and Suburban retail prime rents continued to narrow
• Retail beneficiary of reopening of economy
• Orchard Road rents to stabilise and flatten out in 1H 2022, and thereafter may register rental
growth in 2H 2022. Suburban expected to remain resilient in 2022 and beyond
Further relaxation • Relaxation of dining-in capacity limit to 5 pax since 22 November 2021
favourable to operations • 50% of employees can work from office from 1 Jan 2022
CICT will focus on strengthening operations by being agile and flexible in managing portfolio and manage cost
and capital prudently. Additionally, CICT will seek growth via acquisition.
Notes:
(1) Source: Ministry of Trade and Industry.
(2) Source: Ministry of Manpower.
(3) Source: CBRE Research, 4Q 2021.
C a p i t a L a n d I n t e g r a t e d C o m m e r c i a l Tr u s t 49CICT’s Investment Merits
Largest proxy for Singapore’s commercial real estate market with proven track record
Well-diversified quality portfolio in strategic locations that offers resilience and stability
through market cycles
Ability to tap on opportunities in Singapore and other developed markets to drive
performance and growth
Committed to generate stable distributions and sustainable returns to unitholders
Backed by a strong sponsor with highly experienced fund and property management
teams
C a p i t a L a n d I n t e g r a t e d C o m m e r c i a l Tr u s t 50Market Information Gallileo, Frankfurt, Germany
Singapore's Private Retail Floor Space Per Capita (FSPC)
Significantly Lower Than Most Developed Cities
Singapore’s Retail FSPC increased from 8.6 sq ft NLA per capita in 2020 to 9.1 sq ft NLA per
capita in 2021 due to population contraction
                                                                       Shopping Centre Floorspace Per Capita (sq ft)

          London                                                                                                                                                                    17.4

  Hong Kong(1)                                                                                                                                                                 16.9

       Bangkok                                                                                                                                                   15.2

    Singapore                                                                                              9.1

       Australia                                                                                          9.0

       Notes:
       (1) Includes retail premises and other premises designed or adapted for commercial use.
       Sources: CBRE, PCA, Australia Bureau of Statistics, Rating and Valuation Department Hong Kong, Census and Statistics Department Hong Kong, Gov.UK, URA, Singapore Department of Statistic

C a p i t a L a n d I n t e g r a t e d C o m m e r c i a l Tr u s t                                                                                                                               52
CICT Market Share
Largest owner of private retail stock in Singapore(1)
CICT, 9.1%
Mercatus, 4.4%
Frasers Centrepoint Trust, 4.1%
Far East Organization, 3.5%
Lendlease, 2.6%
Mapletree Commercial Trust, 2.4%
Changi Airport Group, 2.1%
Others/Unknown,
66.1% United Industrial Corporation Limited, 2.0%
City Developments Limited, 1.9%
Suntec REIT, 1.8%
Notes:
(1) Based on the total private stock recorded by Urban Redevelopment Authority (URA).
Sources: URA, CBRE Singapore, 4Q 2021
C a p i t a L a n d I n t e g r a t e d C o m m e r c i a l Tr u s t 53Limited Retail Supply Between 2022 and 2024
Total retail supply in Singapore averages approximately 0.4 million sq ft (2022 - 2024), lower than:
― Last 3-year historical annual average supply (2019 - 2021) of 0.5 million sq ft
― Last 5-year historical annual average supply (2017 - 2021) of 0.8 million sq ft
Singapore Retail Supply (million sq ft)
0.44
0.41
0.38 0.06
0.05
0.11
0.33 0.36
0.16
0.02 0.03
0.03 0.06
0.02
2022 2023 2024
Orchard Road Downtown Core Fringe Outside Central Region Rest of Central Region
Source: CBRE Singapore, 4Q 2021
Figures might not add up due to rounding.
C a p i t a L a n d I n t e g r a t e d C o m m e r c i a l Tr u s t 54Known Future Retail Supply in Singapore (2022 – 2024)
Expected Completion Proposed Retail Projects Location NLA (sq ft)
2022 Grantral Mall @ Macpherson (Citimac A&A) Macpherson Road 67,500
2022 Boulevard 88 Cuscaden Road/Orchard Boulevard 32,000
2022 Shaw Plaza Balestier(A/A) Balestier Road 67,500
2022 Sengkang Grand Mall Sengkang Central 109,000
2022 Guoco Midtown Beach Road 24,300
2022 Club Street Retail/Hotel Development Club Street 33,300
2022 Wilkie Edge (A/A) Wilkie Road 21,200
2022 Le Meridien Singapore (A/A) Beach View 20,500
Subtotal (2022): 375,300
2023 IOI Central Central Boulevard 30,000
2023 Komo Shoppes Upper Changi Road North/Jalan Mariam 27,000
2023 One Holland Village Holland Road 117,000
2023 Dairy Farm Residences Dairy Farm Road 32,300
2023 The Woodleigh Mall Bidadari Park Drive / Upper Aljunied Road 208,000
2023 Odeon Towers (A/A) North Bridge Road 25,000
Subtotal (2023): 439,300
2024 Pasir Ris 8 Pasir Ris Drive 288,100
2024 T2 Airport (A/A) Airport Boulevard 67,000
2024 Labrador Villa Road Labrador Park 28,300
2024 Faber House (A/A) Orchard Road 20,000
Subtotal (2024): 403,400
Total forecast supply (2022-2024) 1,218,000
Sources: URA and CBRE Research, 4Q 2021
C a p i t a L a n d I n t e g r a t e d C o m m e r c i a l Tr u s t 55Suburban Rents Rose by 0.5% While Orchard Rents
Stabilised Q-o-Q in 4Q 2021
15.0% $40.00
$35.00
10.0%
$30.00
5.0%
$25.00
0.0% $20.00
(1)
Q2 2013
Q4 2018
Q1 2010
Q2 2010
Q3 2010
Q4 2010
Q1 2011
Q2 2011
Q3 2011
Q4 2011
Q1 2012
Q2 2012
Q3 2012
Q4 2012
Q1 2013
Q3 2013
Q4 2013
Q1 2014
Q2 2014
Q3 2014
Q4 2014
Q1 2015
Q2 2015
Q3 2015
Q4 2015
Q1 2016
Q2 2016
Q3 2016
Q4 2016
Q1 2017
Q2 2017
Q3 2017
Q4 2017
Q1 2018
Q2 2018
Q3 2018
Q1 2019
Q2 2019
Q3 2019
Q4 2019
Q1 2020
Q2 2020
Q3 2020
Q4 2020
Q1 2021
Q2 2021
Q3 2021
Q4 2021
$15.00
-5.0%
$10.00
-10.0%
$5.00
-15.0% $0.00
GDP Q-o-Q growth Orchard Rents Suburban Rents
Notes:
(1) CBRE revised its basket of prime retail properties since 1Q 2021 by removing some of the older malls in Orchard Road.
(2) Based on advance estimates by Ministry of Trade and Industry.
Sources: CBRE Research and Department of Statistics Singapore.
C a p i t a L a n d I n t e g r a t e d C o m m e r c i a l Tr u s t 56Singapore Retail Sales Performance
Positive year-on-year retail sales growth since Sep 2021
(S$ billion)
4.5 30.0%
4.0 26.2%
3.9 25.0%
3.5 3.7
3.5 3.6
3.0 3.2 3.3 20.0%
21.0% 3.1 3.1 19.3%
20.0% 2.8 2.9 2.8 2.9 2.8 2.8 2.9 2.9 2.9
2.5 2.8 2.8 16.3% 2.7 17.6% 16.3%
2.6 2.7 18.0%
18.4% 16.4% 15.0%
16.2%
2.0 2.3 16.1% 14.7%
2.0 13.4% 12.4% 14.4% 13.3%
12.6% 12.7% 12.5% 12.0% 11.7%
1.5 1.7 10.0%
10.5%
1.0 9.0%
6.3% 5.0%
0.5
0.0 0.0%
Y-o-Y +0.6 -10.2 -9.7 -32.8 45.2 -24.2 -7.7% -8.4 -12.7 -11.2 -2.9 -4.5 -8.4 +7.7 +4.4 +39.2 +61.6 +19.0 +2.0 0 +5.1 +2.3 +4.1 +8.6 +15.8
(%)
Jan Feb Mar Apr May Jun Jul Aug Sep Oct Nov Dec Jan Feb Mar Apr May Jun Jul Aug Sep Oct Nov Dec Jan
2020 2020 2020 2020 2020 2020 2020 2020 2020 2020 2020 2020 2021 2021 2021 2021 2021 2021 2021 2021 2021 2021 2021 2021 2022
Retail Sales (excl. motor vehicles) Online Sales Proportion
Source: Department of Statistics Singapore
C a p i t a L a n d I n t e g r a t e d C o m m e r c i a l Tr u s t 57Singapore Office Stock as at end-4Q 2021
Island-wide office stock
Singapore Stock % of Grade A office
Decentralised, (sq ft) total Core CBD
23.3% stock
Core CBD 32.0 mil 51.5% 14.8 mil sq ft
(46.2% of Core
Core CBD, CBD stock)
51.5% Fringe CBD 15.7 mil 25.3%
Decentralised 14.5 mil 23.3%
Fringe CBD,
25.3% Total 62.2 mil (23.8% of total
island wide stock)
Source: CBRE, 4Q 2021
Figures may not add up due to rounding.
C a p i t a L a n d I n t e g r a t e d C o m m e r c i a l Tr u s t 58Annual New Supply Averages 0.9 Mil Sq Ft Over 3 Years;
CBD Core Occupancy at 93.3% as at end-2021
Singapore Private Office Space (Central Area)(1) – Net Demand & Supply
2.5
2.2 Forecast average annual gross new supply
1.9
1.9
(2022 to 2024): 0.9 mil sq ft
2.0 1.8
1.6 1.6 1.7
1.5 1.4 1.3
sq ft million
1.0
1.0 0.7 0.7 0.8 0.8 0.8
0.6
0.5 0.5
0.5 0.3 0.3
0.2 0.2 0.2 0.2 0.2
0.0
-0.03
-0.5 -0.8
-1.0 (2)
2010 2011 2012 2013 2014 2015 2016 2017 2018 2019 2020 2021 2022F 2023F 2024F
Net Supply Net Demand Forecast Supply
Periods Average annual net supply(3) Average annual net demand
2012 – 2021 (through 10-year property market cycles) 0.7 mil sq ft 0.6 mil sq ft
2017 – 2021 (through 5-year property market cycles) 0.8 mil sq ft 0.5 mil sq ft
2022 – 2024 (forecast gross new supply) 0.9 mil sq ft N.A.
Notes:
(1) Central Area comprises ‘The Downtown Core’, ‘Orchard’ and ‘Rest of Central Area’.
(2) Office component of CapitaSpring is included in the FY 2021 net supply.
(3) Supply is calculated as net change of stock over the quarter and may include office stock removed from market due to conversions or demolitions.
Sources: Historical data from URA statistics as at 4Q 2021; Forecast supply as at 4Q 2021 and CBD Core occupancy rate from CBRE Research.
C a p i t a L a n d I n t e g r a t e d C o m m e r c i a l Tr u s t 59Known Future Office Supply in Central Area (2022 – 2024)
No commercial sites on Government Land Sales Confirmed List (13 Jan 2022); Two white sites(2) on
reserve list, namely Kampong Bugis and Woodlands Ave 2 (Fringe Area)
Expected Completion Proposed Office Projects Location NLA (sq ft)
2022 Hub Synergy Point Redevelopment Tanjong Pagar 131,200
2022 Guoco Midtown Beach Road / City Hall 667,100
Subtotal (2022): 798,300
2023 Central Boulevard Towers Marina Bay 1,258,000
2023 333 North Bridge Road Beach Road / City Hall 40,000
Subtotal (2023): 1,298,000
2024 Keppel Towers Redevelopment Tanjong Pagar 526,100
Subtotal (2024): 526,100
Total forecast supply (2022-2024) 2,622,400
Notes:
(1) Details of the two white sites:
(a) Kampong Bugis: GFA of 390,000 sqm; up to 4,000 housing units and commercial GFA of 10,000 sqm (on reserve list since 4Q 2019)
(b) Woodlands Ave 2: Site area of 2.75 ha, gross plot ratio of 4.2; estimated 440 housing units, 78,000 sqm commercial space (on reserve list since 4Q 2018)
Sources: URA as at 4Q 2021, CBRE Research as at 4Q 2021 and respective media reports
C a p i t a L a n d I n t e g r a t e d C o m m e r c i a l Tr u s t 60Grade A Office Rent Rose for Two Consecutive Quarters
1Q 19 2Q 19 3Q 19 4Q 19 1Q 20 2Q 20 3Q 20 4Q 20 1Q 21 2Q 21 3Q 21 4Q 21
Mthly rent (S$ / sq ft ) 11.15 11.30 11.45 11.55 11.50 11.15 10.70 10.40 10.40 10.50 10.65 10.80
Q-o-Q Change 3.2% 1.3% 1.3% 0.9% -0.4% -3.0% -4.0% -2.8% 0% 1.0% 1.4% 0.5%
S$18.80
20
18
Monthly gross rent by per square foot
16
S$11.40 S$11.55
14 S$11.06
12 S$10.80
10
8
6 S$9.55 S$8.95
4
S$8.00
2 Global Euro-zone
Post-SARs, Dot.com crash financial crisis crisis
0
1Q02
2Q02
3Q02
4Q02
1Q03
2Q03
3Q03
4Q03
1Q04
2Q04
3Q04
4Q04
1Q05
2Q05
3Q05
4Q05
1Q06
2Q06
3Q06
4Q06
1Q07
2Q07
3Q07
4Q07
1Q08
2Q08
3Q08
4Q08
1Q09
2Q09
3Q09
4Q09
1Q10
2Q10
3Q10
4Q10
1Q11
2Q11
3Q11
4Q11
1Q12
2Q12
3Q12
4Q12
1Q13
2Q13
3Q13
4Q13
1Q14
2Q14
3Q14
4Q14
1Q15
2Q15
3Q15
4Q15
1Q16
2Q16
3Q16
4Q16
1Q17
2Q17
3Q17
4Q17
1Q18
2Q18
3Q18
4Q18
1Q19
2Q19
3Q19
4Q19
1Q20
2Q20
3Q20
4Q20
1Q21
2Q21
3Q21
4Q21
Source: CBRE Research (figures as at end of each quarter)
C a p i t a L a n d I n t e g r a t e d C o m m e r c i a l Tr u s t 61Demand and Supply in Frankfurt Office and its Two
Submarkets
(%)
(‘000 sq m) Frankfurt Office
800 15
600
10
400 7.5
5
200
0 0
2015 2016 2017 2018 2019 2020 2021
New Supply ('000 sqm) Demand ('000 sqm) Vacancy rate (%)
(%) (%)
(‘000 sq m) Banking District (‘000 sq m) Airport Office District
240 15.0 40 15
200
30
160 10.0 10
120 20
5.9 5.0 6.0
80 5
10
40
0 0.0 0 0
2015 2016 2017 2018 2019 2020 2021 2015 2016 2017 2018 2019 2020 2021
Source: CBRE Research, 4Q 2021
C a p i t a L a n d I n t e g r a t e d C o m m e r c i a l Tr u s t 62Rental Range in Frankfurt Rental range by submarket
(€ / square metre / month)
Frankfurt
West City CBD
C
B 45.50 45.50
Westend
Gallileo
D 35.40
Banking
District
27.00
21.57 22.00 19.75
A5 (%)
18.00
B43
Niederrad
South
7.00
MAC A3
Frankfurt Total Banking District Airport District
Region D Region A
A
Maximum Minimum Weighted Average Rent
ICE S-Bahn Expressway / Highway
Source: CBRE Research, 4Q 2021
C a p i t a L a n d I n t e g r a t e d C o m m e r c i a l Tr u s t 63Sydney CBD: Improving Market and Demand Sentiment
Sydney CBD Sydney CBD Office
Rents
Net Supply/Net Absorption ('000 sq m)
120 10%
Net Effective Rent (A$/sq m/annum)
100 9.2% 9%
1,000
80 8% 900
60
7% 800
40 700
6%
20 600
5%
0 500
4%
-20 400
3%
-40 300
-60 2%
200
-80 1% 100
-100 0% 0
2022F
2023F
2024F
1Q 2017
2Q 2017
3Q 2017
4Q 2017
1Q 2018
2Q 2018
3Q 2018
4Q 2018
1Q 2019
2Q 2019
3Q 2019
4Q 2019
1Q 2020
2Q 2020
3Q 2020
4Q 2020
1Q 2021
2Q 2021
3Q 2021
4Q 2021
Dec-21F
Dec-22F
Jun-22F
Dec-17
Dec-18
Dec-19
Dec-20
Jun-17
Jun-18
Jun-19
Jun-20
Jun-21
Net Supply Net Absorption Vacancy
Prime Net Effective Rents Secondary Net Effective Rents
Note: CBRE Research, 4Q 2021
C a p i t a L a n d I n t e g r a t e d C o m m e r c i a l Tr u s t 64North Sydney CBD: New Supply to Rejuvenate CBD and
Demand to Pick Up
North Sydney CBD North Sydney CBD Office
Rents
Net Supply/Net Absorption ('000 sq m)
120 18%
Net Effective Rent (A$/sq m/annum)
100 16.4% 16%
1,000
80 14% 900
60 12% 800
700
40 10%
600
20 8% 500
0 6% 400
300
-20 4%
200
-40 2% 100
-60 0% 0
2022F
2023F
2024F
1Q 2017
2Q 2017
3Q 2017
4Q 2017
1Q 2018
2Q 2018
3Q 2018
4Q 2018
1Q 2019
2Q 2019
3Q 2019
4Q 2019
1Q 2020
2Q 2020
3Q 2020
4Q 2020
1Q 2021
2Q 2021
3Q 2021
4Q 2021
Dec-21F
Dec-22F
Dec-17
Dec-18
Dec-19
Dec-20
Jun-22F
Jun-17
Jun-18
Jun-19
Jun-20
Jun-21
Net Supply Net Absorption Vacancy
Prime Net Effective Rents Secondary Net Effective Rents
Note: CBRE Research, 4Q 2021
C a p i t a L a n d I n t e g r a t e d C o m m e r c i a l Tr u s t 65The End
For enquiries, please contact:
Ms Ho Mei Peng, Head, Investor Relations
Direct: (65) 6713 3668 | Email: ho.meipeng@capitaland.com
CapitaLand Integrated Commercial Trust Management Limited
(http://www.cict.com.sg)
168 Robinson Road, #25-00 Capital Tower, Singapore 068912
Tel: (65) 6713 2888 | Fax: (65) 6713 2999Additional Information CapitaSpring, Singapore
Well-located Properties Across Singapore
Integrated Developments Office
1 CapitaSpring (45.0%) 1 Asia Square Tower 2
2 Funan 2 CapitaGreen
3 Raffles City Singapore 3 Capital Tower
4 Plaza Singapura 4 Six Battery Road
5 The Atrium@Orchard 5 21 Collyer Quay
Retail
1 Bedok Mall
2 Bugis+
3 Bugis Junction
4 Bukit Panjang Plaza
5 Clarke Quay
6 IMM Building
7 JCube
8 Junction 8
9 Lot One Shoppers’ Mall
10 Tampines Mall
11 Westgate
PROPERTIES IN SUBURBAN AREAS
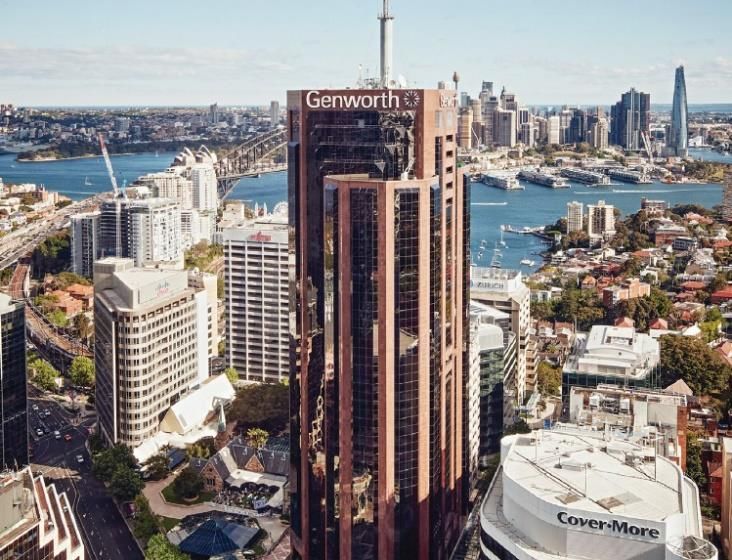
C a p i t a L a n d I n t e g r a t e d C o m m e r c i a l Tr u s t 68Exposure to Germany’s Office Market with 2 Strategically Located
Properties in Frankfurt Airport Office District and Banking District
Excellent connectivity between Frankfurt airport and Frankfurt city centre via a comprehensive
transportation infrastructure network
Close proximity between 1
Frankfurt airport office district and
Frankfurt city centre
1
20 mins by Car
• Via A3 / A5 motorways
Gallileo
11 mins by Train
2
• Inter City Express (ICE) high speed
trains offer 204 domestic and
2
regional connections
15 mins by S-Bahn commuter
railway
• 4 stops to Frankfurt city centre
Main Airport Center
(Frankfurt central station)
C a p i t a L a n d I n t e g r a t e d C o m m e r c i a l Tr u s t 69You can also read