21st Century Forecasting for the Travel & Hospitality Industry
←
→
Page content transcription
If your browser does not render page correctly, please read the page content below

21st Century Forecasting for the
   Travel & Hospitality Industry
   Reinventing forecasting with Machine Learning and
   Artificial Intelligence

COPYRIGHT 2021, AMAZON WEB SERVICES, INC. OR ITS AFFILIATES

Forecasting is a decision-making tool that helps businesses cope with the impact of the future’s uncertainty
      by examining historical data and trends. Businesses across every industry need to forecast components of
      their operations, and that is particularly important, and challenging, in times of uncertainty. Actionable
      forecasts in the Travel and Hospitality industry bring particular value: how many guests will arrive and when,
      how to staff accordingly, adjust their inventory positions, model the impact of promotions/events on business
      performance, optimize pricing/revenue management, and project revenue/cash flow.

      Forecast too high and the business will be inefficient with resources: likely buying too much product, facing
      potential spoilage or waste, while also missing opportunities to invest capital elsewhere. Forecast too low and
      the company will have missed sales opportunities while decreasing customer experiences and satisfaction
      levels.

      Despite unpredictability, accurate forecasting is critical for Travel and Hospitality companies. Working with
      companies around the world, in all segments of the industry, we observe three common traits of the most
      successful organizations. Those who excel at both the “Art and Science” of forecasting have:

      1.    resources, a mix of talent and experience aligned by a strong culture

      2.    procedures that support the continuous improvement of the forecasting process

      3.    technology that enables the capture of genuine patterns and relationships in data, while removing noise

      This white paper explores these three areas with the goal of assisting Travel and Hospitality companies
      improve their forecasting to better operate in the 21st century.

COPYRIGHT 2021, AMAZON WEB SERVICES, INC. OR ITS AFFILIATES   2
Table of Contents
         Overview

         Foreword

         Chapter 1: Travel & Hospitality – The Art of Forecasting

         Chapter 2: Travel & Hospitality – The Science of Forecasting

         Chapter 3: Travel & Hospitality – Customer Success

         Chapter 4: Getting Started with AWS

         Additional Resources
         •   Reference Architectures
         •   AWS Services and Forecasting
         •   AWS Travel & Hospitality Partner Competency
         •   About the Authors
         •   About AWS Travel & Hospitality

COPYRIGHT 2021, AMAZON WEB SERVICES, INC. OR ITS AFFILIATES   3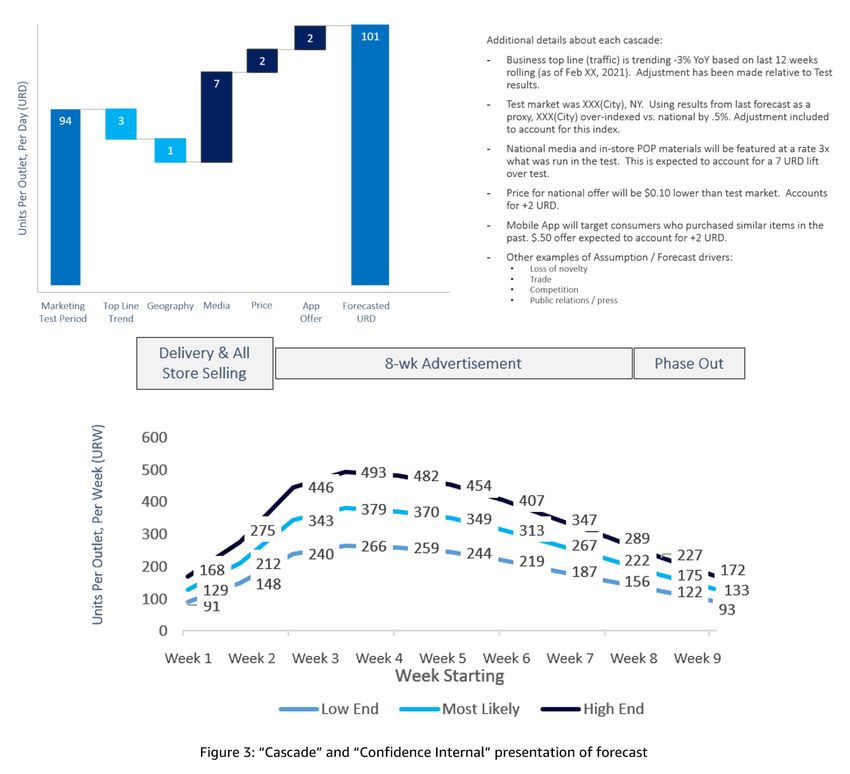
4   21st Century Forecasting for the Travel & Hospitality Industry

      Overview

      This white paper serves to review improvements in forecasting, the use of Machine Learning (ML) and
      Artificial Intelligence (AI), and metrics to assess a forecasts value. The simple construction of a forecast is
      highlighted. It is then built upon with additional attributes to improve accuracy. Factors that affect forecast
      complexity are considered, alongside methods to temper them and arrive at a better forecast.

      As you read, we encourage the use of the ‘Mental Model’
      presented below. Mental models are frameworks for thinking.
      They simplify complex things so your brain can reason through
                                                                                                 Mental models are
      them. We use mental models to make better decisions without
      knowing every detail about a situation. In other words, mental                      frameworks for thinking.
      models are thinking tools—shortcuts for reasoning. They help                           They simplify complex
      our brain go ‘I’ve seen this type of problem before!’ Charlie                        things so your brain can
      Munger, the vice chairman of Berkshire Hathaway, believes that
                                                                                              reason through them.
      “you can’t really know anything if you just remember isolated
      facts... you’ve got to have models in your head.”

      The Model we propose reveals that for an average airline route, hotel property, or restaurant that generates
      $2.7 Million per year in Revenue, a 1% forecasting improvement results in more sales and increases
      Operating Income by 4.9%, while a 1% forecasting improvement that results in optimization of controllable
      costs, increases Operating Income by 6.5%. Reflect on the impact of a forecast that enables a company to do
      both, while plugging in your company’s figures to generate a mental model as you continue to read the
      white paper:

      Throughout this document, we propose that forecasting is a collaborative and iterative effort, one that will
      require tuning over time, where enhancements to the forecast may come from the forecasting team or the
      users of the forecast. The final section of the white paper covers key questions to ask when beginning a
      forecasting project, and that you and your team should consider as you continue on your forecasting
      journey.

COPYRIGHT 2021, AMAZON WEB SERVICES, INC. OR ITS AFFILIATES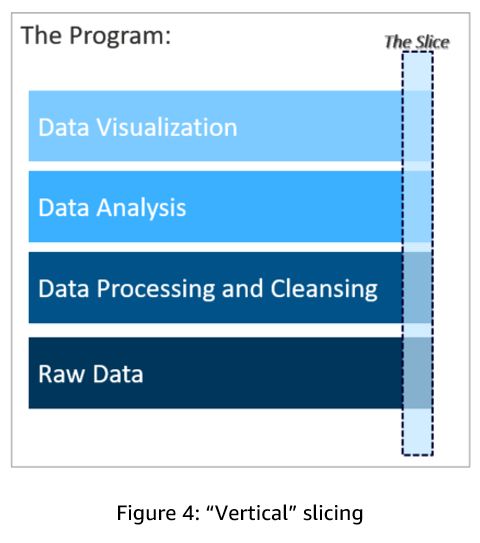
5   21st Century Forecasting for the Travel & Hospitality Industry

      Foreword
      by Wesley Story, Enterprise Strategist, AWS

      Travel and Hospitality companies have faced many disruptive events over
      the years. The industry has survived extreme weather, financial crises, acts
      of terror, business events like deregulation, and of course pandemics. Yet
      the industry has proven to be resilient over time. These moments of
      extreme pressure have yielded innovations that improved operational
      efficiencies, travelers and guests’ experiences, and expanded offerings.

      Airline deregulation in the United States in 1978 for example, stimulated
      the creation of loyalty programs that are still in place today. A few years
      later, you see loyalty programs emerging in hotel and restaurant chains as
      well. Loyalty programs didn’t just reward customers for their dedication to
      a particular hotel or airline brand. They also delivered volumes of data
      once considered unfathomable. This data combined with yield
      management could arguably have birthed the practice of revenue
      management. Revenue management, an emerging practice in the 1980s,
      became a best practice for efficient operators by the 1990s.

      Fast forward 30 years and the rudimentary forecasting spreadsheets have
      been replaced by robust systems and processes. As revenue management
      expanded and matured as a practice it also increased the importance of
      forecasting and expanded the scope from sales, labor, and inventory
      forecasts to multi-dimensional forecasts feeding downstream activities.
      These forecasts become more than internal processes but the heartbeat
      for the entire value chain. Accurate forecasting has never been easy, but it
      became a consistent process for most, even through “typical” events (think
      holidays, conferences, sports, and normal bad weather). However, with the
      pandemic, it’s never been harder when you consider the extreme variances
      of the inputs.

      The conversations I’ve had with peers in the industry inform me that this
      isn’t an isolated challenge. It is also not isolated to the travel and
      hospitality industry. Based on one industry customer group I work with,
      forecasting cycles that were once monthly are now weekly, weekly cycles
      are daily and in some critical cases you may be reforecasting throughout
      the day as you monitor the dynamic inputs. However, this is putting strain
      on the forecasting processes and systems as they just weren’t designed to
      work this way. It’s stimulating many to look towards technology and
      advanced techniques to address the pain.

      In a recent study conducted by leading travel and hospitality media outlet
      Skift, 78% of travel and hospitality executives said digital transformation
      was more important now than ever. Digital Transformation is a broad
      topic that can mean different things to different people. Based on the
      conversations we have as Enterprise Strategists with AWS customers, the
      prevailing business outcomes sought are enterprise agility, time to market,
      and cost reduction. By building on AWS, companies are able to save
      valuable expenses and respond quickly to these ever-changing market
      dynamics. While I can’t predict the future, I do know AWS, along with our
      partners, will be there to help customers build for what’s next.
      Innovations, born out of disruption, will impact and improve the way we
      fly, sleep, eat, and experience the world in the years ahead.

COPYRIGHT 2021, AMAZON WEB SERVICES, INC. OR ITS AFFILIATES
6 21st Century Forecasting for the Travel & Hospitality Industry
Despite the diversity of companies across travel and hospitality, and incredible disruption, I tell people the core
benefits of AWS still come down to two main drivers, our ability to help:
Enhance Customer Experiences Increase Operational Efficiency
A functional area that cuts clear across both of these industry drivers is forecasting. Earlier I mentioned that
forecasts had expanded beyond sales, labor, and inventory. To that end, recently I have observed companies
leveraging forecasting technology to automate:
• New outlet/route development - Determine where to open outlets/routes, relocate outlets/routes, and better
understand trade areas with competition down to the local level. Handling dynamic closures.
• Human Resources – Predicating workforce intelligence such as turnover, team member retention, and
absenteeism or sickness outbreaks.
• Marketing / R&D – Projecting shifts to segmentation, demographics, population densities, and footfall/traffic
patterns.
• Revenue Optimization – Modeling impacts of dynamic pricing including cannibalization and price elasticity.
Many of these use cases benefit from the use of Machine Learning (ML) and Artificial Intelligence (AI) in primarily
two modes: passive and active decisioning. In passive decisioning, human interpretation or action is typically
required in the process. Whereas in active decisioning, cognitive frameworks drive decision making without
human intervention. At this point, more use cases tend to use passive decisioning, but I expect that to change as
companies gain confidence in their cognitive models in domains such as dynamic pricing and customer targeting.
Travel and Hospitality companies are looking to transform their businesses and adapt to whatever the next
trends will be. Given the changing dynamics in the world, improving and expanding forecasting should be a high
priority for the foreseeable future. We hope this white paper motives you to do many things including:
• Evaluate your current practice
• Ensure you have the right mix of resources and corporate culture behind your team
• Assess the processes and confirm the procedures promote continuous improvement
• Evaluate your technology
• Embrace cloud technology, such as AWS, which offers the key benefits of: agility, cost savings, elasticity,
faster innovation, and the ability to go global in seconds.
While we can’t predict the future, when these things are done, we can get a lot closer.
COPYRIGHT 2021, AMAZON WEB SERVICES, INC. OR ITS AFFILIATESCHAPTER ONE
Travel & Hospitality:
The Art of Forecasting
COPYRIGHT 2021, AMAZON WEB SERVICES, INC. OR ITS AFFILIATES 78 21st Century Forecasting for the Travel & Hospitality Industry
The Art of Forecasting
For travel and hospitality companies, the management of inventory, resources and staff is critical to protect
operating margins. Having an effective operation and supply chain to reduce inventory and carrying costs, avoid
stock out, and tie production back to actual demand requires accurate forecasting and demand planning.
Forecasting has typically been based on historic trends, purchase patterns, and stocking capabilities for
products, items, services, and promotions that are known and have been purchased in the past. However, where
there is no history, like when the products, services or resources are new, or when there is a disruptive event
that radically changes behaviors, traditional models no longer work. For these reasons, companies including
Amazon use Machine Learning to perform forecasting and planning, based on adaptive models that rely on
real-time signals – and can be adjusted with additional signals and events, as required.
Reflecting on Wesley Story’s foreword for the Travel and The Art of Forecasting is
Hospitality Industry in this white paper, the “Art of Forecasting” presented in the areas of
is presented in the areas of: People, Process, and Technology.
While each has its own subtleties for an organization to
People, Process, and
transform itself, our customers tell us that all three must move Technology – all three
in harmony. must move in harmony.
People are what makes the organization; their knowledge, experiences, and ability to collaborate. Amazon
is known for forming nimble ‘two pizzas’ team, a team no larger than two pizzas can reasonably feed. This
establishes a framework to maximize the effectiveness of communication, interactions, decision-making,
scaling, and meetings. For an organization to succeed, a small-dedicated team needs to own the forecast.
Project Management tools, such as ‘Responsible Accountable Consulted Informed’ (RACI) matrix can be used
to ensure proper involvement and communication of the forecast to the many reliant/dependent upon the
forecast in the organization. Speaking of Project Management tools, the “project management triangle’ has
popularized the concept that quality is impacted by the constraints of Scope, Time, and Cost. For forecasting,
in the most successful organizations, we observe a similar triangle. One that constructs a truly cross-
functional forecasting team with resources from Marketing, Operations, and Supply Chain working in
orchestration with each other.
Many organizations view the forecasting process as linear; originating with a Marketing projection, which is
informed by operations ability to execute, and then the constraints of the Supply Chain. Advanced
organizations have embraced the reality that initiatives that require forecasting are launched by all three of
the functional areas. Supply Chain obtains a partner offer for a significant discount on a product, Marketing,
identifies a viral trend that the brand wishes to capitalize on, or Operations observes a consistent behavior
from travelers or guests which can be leveraged.
COPYRIGHT 2021, AMAZON WEB SERVICES, INC. OR ITS AFFILIATES9 21st Century Forecasting for the Travel & Hospitality Industry
Processes enable the people to achieve solid forecasting outputs. While forecasts can be communicated in
a number of ways, utilizing an artful, ‘Cascade’ diagram is a method we observe the mature organizations in
the industry utilize to capture and communicate both the additive and subtractive inputs. This artful diagram
enables organizations to understand the value of the forecast and to instill the practice of continuous
improvement to increase its value, which is covered in depth in the next chapter. Additionally, a confidence
interval is presented so that all parties can plan for a high and low range possibility. A sample cascade
forecast is presented below:
COPYRIGHT 2021, AMAZON WEB SERVICES, INC. OR ITS AFFILIATES10 21st Century Forecasting for the Travel & Hospitality Industry
For successful customers, we observe a second process that accelerates forecasting improvements. They
practice the art of ‘Vertical’ slicing over ‘Horizontal’ slicing. Defined as, the sum of the work required in every
layer that is involved in obtaining a specific business answer or output. By diving into the ‘Cascade’ example
above, we can illustrate the vertical slicing practice if an organization did not have access to the impact of
geography on their forecast. Initiating a ‘Vertical slice’ project to obtain, analyze, report, and measure its
impact on a small number of (statistically significant) markets instead of what other organizations do, which
is engage in a lengthy program to produce analysis for all cities. By slicing vertically, an organization can
determine the true value of the insight, with speed.
Technology is the underlying repositories and systems that enable the production of forecasts. Using our
mental model concept presented earlier in the white paper, examine your technology, engineering resources,
and functional ability to generate value from the technology in your stack. Use the right technology, with
the right resources, to generate a forecast for your organization. You will need a method to store your data,
perform analysis, and incorporate the insights back to your customer and employee facing applications. In
Chapter 2, we examine the “Science of Forecasting,” while in the Additional Resources section, we view the
technology stack from the top down.
COPYRIGHT 2021, AMAZON WEB SERVICES, INC. OR ITS AFFILIATESCHAPTER TWO
Travel & Hospitality:
The Science of Forecasting
COPYRIGHT 2021, AMAZON WEB SERVICES, INC. OR ITS AFFILIATES 1112 21st Century Forecasting for the Travel & Hospitality Industry
What Goes in to Forecasting
Business analysts or forecasting managers develop forecasts by reviewing
historical sales volumes, looking at overall trends, and leveraging their
subject matter expertise. Managers perceive forecasting is an important
part of their job, but recognize that getting the forecast “right” is nearly
impossible and the time that it takes to develop the forecast takes away
from other management activities. As businesses try to reduce manual
effort, while increasing forecasting accuracy, many move to simple
trending, statistical forecasting, or choose Machine Learning methods to
make their forecasts more accurate.
This document has shared examples of forecasting in the Travel &
Hospitality Industry. The term ‘forecasting” was liberally applied for ease
of reading, when in reality there are sub-practices which are used in the
Industry. This chapter focuses on the “Science of Forecasting.” The Oxford
Dictionary defines science as: a systematically organized body of
knowledge on a particular subject. Therefore, it is best to present the
‘body of knowledge’ on the individual sub-practices of Demand
Forecasting and Revenue Management, prior to revealing how to measure
and improve their value.
Travel & Hospitality Forecasting Explained
Forecasting is a decision-making tool that helps businesses cope with the
impact of the future’s uncertainty by examining historical data and
trends.
Straight-line Forecasting works particularly well when the cost of an
item is constant, (the cost of the item to forecast is not linked to the
demand for it), supply is unlimited (you can always order extra items),
and is non-perishable (if the item is not sold today, it can be sold
tomorrow.) For example; pepperoni use at a restaurant, housekeepers for
hotels room cleaning/turnaround, or how many parts to stock in a hangar
depending on the aircraft/airplane maintenance prediction. In these
cases, the items to forecast (e.g., ingredients, labor, parts, etc..) are
virtually unlimited, and the objective is to consume just enough to satisfy
the demand. Forecast too much and there is “waste”, forecast
insufficiently and some demand will go un-answered. Given that each
item that satisfies the demand has a “cost”, an added objective is to keep
the cost to the minimum.
Within the Travel and Hospitality industry, we encounter situations where
there are a finite number of products to sell, and when the product is
perishable, that is after a certain date / time, the product is no longer
sellable. As such, forecasting demand is critical as an organization desires
to maximize sales, at the highest price, before the product expires. Given
these conditions, the best means to directly influence demand is by
changing the price of the product sold. For price elastic products,
lowering the price will increase demand, while raising the price will
reduce demand. Restaurants utilize this principle with promotions such as
2-for-1’s, happy hours, early-birds special, and pre-fixe menus. The airline
and hotel industries have taken this concept to the next level with
Revenue Management; an application that is, Revenue Management is the
application of analytics that predicts consumer behavior at the micro-
market level and optimizes product availability and price, to maximize
revenue.
COPYRIGHT 2021, AMAZON WEB SERVICES, INC. OR ITS AFFILIATES13 21st Century Forecasting for the Travel & Hospitality Industry
Revenue Management Invented in the early 1980’s, given there are a limited number of seats on a plane, and
of rooms in a hotel, the objective is to sell as many seats / rooms to maximize the revenue, so by the time the
plane takes off or the night passes, no seat or room goes unsold. An added complication is that given seats and
rooms might be all the same there is a need to “create” distinctive products satisfying different demand. To
accomplish this, a company must have the ability to clearly identify and separate the demand for each product,
by defining product attributes so demand for one product is not cannibalized by another, and to be able to
change availability of each product dynamically with real-time inventory. The best-known example is the
airlines creation of the changeable and non-changeable ticket. Demand is clearly different: a passenger, whose
travel plans are not finalized, would not buy a non-changeable ticket. Given people are willing to pay a
premium for such convenience, changeable tickets are more expensive than non-changeable ones. The
question becomes how many seats should be allocated for changeable tickets? And how many for non-
changeable? To maximize revenue, all seats should be available for purchase for changeable tickets, but given
not everybody can afford them, and to avoid having the plane depart with empty seats, the amount of non-
changeable ticket availability should gradually grow depending on the sales of the changeable ones.
Simultaneously, every time a non-changeable ticket is sold, the availability for changeable ticket would be
reduced by one. A company must balance overprotection and dilution:
Revenue management requires forecasting various elements such as demand, inventory availability, market
share, and total market. Performed properly, the pricing and availability of the product is managed to ensure
maximum profitability:
COPYRIGHT 2021, AMAZON WEB SERVICES, INC. OR ITS AFFILIATES14 21st Century Forecasting for the Travel & Hospitality Industry
Measuring and Improving the Value of Travel & Hospitality Forecasts
Businesses desire to measure forecast accuracy to assess how well their forecasts are performing, regardless
of what is being forecasted or the method they are currently using.
Common metrics, such as Mean Absolute Percentage Error (MAPE), Percentage Accuracy (% Accuracy), or
Mean Percent Error (MPE) are often used to communicate how well the forecast is performing.
Unfortunately, these metrics are problematic because:
• Errors penalize more when forecasts are low
• Penalties for over- and under-forecasting are not equivalent
• Different accuracy metrics are obtained depending on the level of aggregation, and
• Accuracy metrics are ignored when true demand is 0
Rather than using a forecast metric calculated to estimate how closely the forecasts match the actuals,
mature organizations measure the outcomes of the forecast(s) using Forecast Value Add and Impact of
Revenue.
• Forecast Value Add: Measures the improved performance of the business derived by using the forecast,
rather than relying on the current process. The same metrics are used to compare the current forecast to
the Machine Learning generated forecast; most commonly MAPE, % Accuracy, or MPE are compared.
• Impact on Revenue: Measures expected net revenue using the Machine Learning generated forecast
versus revenue using a different approach.
COPYRIGHT 2021, AMAZON WEB SERVICES, INC. OR ITS AFFILIATES15 21st Century Forecasting for the Travel & Hospitality Industry
While Forecast Value Add is a relatively straightforward calculation of how
well the Machine Learning generated forecast performs, Impact on Revenue
is often difficult to calculate. Impact on Revenue however, measures the true
impact of the forecast on business performance ultimately, the reason for
producing a forecast in the first place. Once the calculations of Forecast
Value Add and Impact on Revenue are obtained, utilize them to assess
multiple forecasts to determine which forecast provides the best business
Impact on Revenue.
Impact on Revenue compares the net revenue obtained from existing
forecasts to what the Machine Learning generated forecast would have
obtained, taking into consideration the impact of both under- and over-
forecasts. Factors to consider include:
Labor/Staffing Costs: Change in labor costs attributed to the staffing
changes needed to meet demand.
Inventory/Product Costs: Increase or decrease in the inventory spend.
Change in Sales: Increase or decrease in the sales revenue.
Cost of Holding Merchandise: Dollars spent on excess inventory where the
money could have been invested in an alternative.
Cost of Product Transfers and Expediting: Money spent to expedite or
transfer the products(s) to meet demand if supply has been depleted.
Spoilage and Waste: Cost of products that either spoiled prior to selling or
were overproduced due to over-anticipating demand (e.g. promotional time-
sensitive paper goods, and toys).
Impact on Customer Satisfaction: A soft measure that may impact future
revenue and demand.
COPYRIGHT 2021, AMAZON WEB SERVICES, INC. OR ITS AFFILIATES16 21st Century Forecasting for the Travel & Hospitality Industry
What Goes into a Forecast?
A forecast attempts to estimate future behavior, such as sales or
demand, using previous behavior and attributes that impact that
behavior. Most relatively-sophisticated algorithms attempt to find:
• Trends: Continuous increase or decrease in the series value.
• Periodicity: Periodic cyclical patterns that occur in systemically, such
as hourly, daily, monthly, and seasonally. These may even be longer-
term cycles such as El Nino and La Nina.
• Autocorrelation: The degree to which prior behavior influences
future behavior.
Trends, periodicity, and autocorrelation alone will not create an accurate
forecast, as there are a number of other features to consider:
• Events: One-time events that change the demand for a few cycles,
but not permanently. Examples of these can be power outages,
storms, holidays, or specialty promotions.
• Interventions: a functional change that persists that may altogether
alter the way the future values perform. Examples include changing
the signage outside the property, doing a property renovation, or a
competitive property opening nearby.
In some cases, it is difficult to know ahead of time whether something is
an event or an intervention. For example, the COVID-19 pandemic
shuttered properties and changed the way that consumers engaged
Travel and Hospitality companies during lockdown. We do not yet know
whether customer purchase behavior will change permanently once the
pandemic eases. Will consumers cook more at home, resulting in COVID-
19 being an intervention? Alternatively, will they go back to their prior
traveling behavior, resulting in the pandemic being an event? We will
learn over time.
If an organization were to forecast just using trend, periodicity,
autocorrelation, events, and interventions, forecasts would generally
approximate the actual metric. Forecasts could be improved by taking
into consideration both exogenous and endogenous attributes that may
influence the metric that is being forecast.
• Exogenous: Attributes from outside the system that an organization
has no control over. These are attributes such as GDP, unemployment
rate, competitor promotions, weather, competitors, proximity to
competition, regional socio-demographic characteristics, and
population in the trade area
• Endogenous: Attributes that an organization has control over; they
are within the system. These are attributes such as marketing spend
by channel, promotional offers such as coupons, price of product
sold, and competitive products (that have either halo or
cannibalization effects) sold
COPYRIGHT 2021, AMAZON WEB SERVICES, INC. OR ITS AFFILIATES17 21st Century Forecasting for the Travel & Hospitality Industry
Note that an organization can change demand for a product by changing the endogenous attributes that
influence demand. Exogenous attributes come from outside; an organization can only estimate these values in
the future. As an organization considers the attributes to include in the forecasting model, the organization has
to be cautious about the selection of the attributes needed to support forecasts. For exogenous attributes, an
organization may hold these constant or extrapolate a trend, based on prior values. For endogenous attributes,
an organization may know planned spend, promotions, prices, and competitive products. Note that an
organization may also decide to shape demand by changing the values of these attributes to see how
increasing marketing spend or decreasing competitive products influences demand.
Ultimately, the decision to include events and interventions as well as exogenous and endogenous attributes in
our forecasts is dependent upon the ability to provide estimates of these values for our forecast horizon.
Selection of useful, predictive attributes will be part of the initial Machine Learning efforts and users should
consider them periodically to ensure that the structure of the forecasting model has not changed. We
recognize that not every potentially predictive attribute can be included (due to data availability and ability to
operationalize), but the omission of valuable attributes will affect predictive accuracy.
Forecasting Complexity
Forecast Horizon
The closer an organization gets to the period that they would like to forecast, the more accurate the forecast
becomes. Unfortunately, for a forecast to be actionable, it needs to be able to valuably and efficiently project
into the future. A forecast is:
• Valuable if the results of those forecasts can be used for making decisions. A highly accurate forecast that
forecasts only one time-period ahead may not be valuable because an organization cannot meet any
process changes in the appropriate timeframe.
• Efficient if it does not require significant heavy lifting to create. A highly accurate forecast that requires too
high of an effort to create may not be efficient for the business to use – it is too costly.
Deciding if a forecast is deployable for business use must be a trade-off between accuracy, value, and
efficiency. Ultimately the forecasting team, working with the business needs to find a happy middle-ground - a
forecast that is accurate enough for the business to use, provides value over existing businesses processes, and
can be generated easily at low cost.
Granularity – Time, Product Hierarchy, and Location
Like the balancing act for forecast horizon, there is a delicate balancing act when considering granularity.
Models must be at the level of granularity, considering time, product hierarchy, and location, where they are
both accurate and actionable. Generally, model accuracy increases as the granularity decreases – the higher
level that an organization is at, the more accurate it may be. For businesses to consume forecasts, they need to
be at an actionable level.
• Time: When an organization aggregates forecasts to a daily level, and the business needs hourly, they will
lose meaningful signal in the data. The forecast may be accurate, but unusable.
• Product Hierarchy: When an organization wants to forecast at the SKU level, but many product substitutes
exist, a higher-level forecast may be more appropriate. When an organization assembles product upon
ordering (such as in a restaurant) where many of the component parts are the same, it may be appropriate
to forecast at the ingredient level, rather than the product level, especially if the products are substitutes.
Ultimately, an organization may need to evaluate all approaches to determine which provides the best
result: top-down, middle-out, bottom-up, or ingredient-based.
COPYRIGHT 2021, AMAZON WEB SERVICES, INC. OR ITS AFFILIATES18 21st Century Forecasting for the Travel & Hospitality Industry
Location: We must decide whether to forecast at the property, distribution center (DC), regional, or national
levels based on how an organization plans to use the forecasts. If the forecast affects how much product
should ship to a DC, then a DC level forecast meets that need. If a forecast determines property staffing or
assembling product, an organization should forecast at the property level. Ultimately, an organization needs to
recognize that socio-demographic characteristics and location greatly affect demand at the property level; an
organization should never assume that properties in the same geographic area have the same demand.
The forecasting team, along with management, should work collaboratively to determine the right level of
granularity, considering the usage of the forecast; there is a tradeoff between forecast accuracy and ability to
use the results at the level of granularity desired.
White Noise and Robustness
Forecasts estimate future demand; they should not be perfect. All time series data contains some white noise
component on top of the signal generated by the underlying process. This white noise represents random
fluctuations not explained by the data provided. White noise should have a mean of 0, should not be correlated
with any of the attributes included in the model, and should have the same variance across the training
interval. If a forecast meets this requirement, it is likely that the forecast has captured all of the information
possible in the model; any additional enhancements are likely to lead to an over-trained model.
An over-trained model, on its surface, appears to be a very good thing. The model very accurately fits the data;
there is minimal forecast error. While an organization can achieve high accuracy when developing forecasts,
they rarely have near-perfect accuracy - other than physics experiments in controlled environments. Ultimately,
the goal of a good forecast (or any model) is robustness – the ability to generalize well on unseen data. A
robust model will be able to perform well even as the environment changes, and even as unforeseen events
occur that alter the attributes included in the model. A robust model should perform well across all product
types, locations, and times.
Ultimately, an organization can expect a forecast model to have white noise, representing random, un-model-
able behavior. If a model becomes too accurate, it is likely not robust and cannot be generalized for future use.
Perfection is not the ultimate goal of machine forecasts. A new forecast should improve upon current forecasts,
resulting in improved business performance.
Data Availability
To develop a forecast, begin with a few cycles of time series data, at a minimum, 1-2 years. Even with cold-start
forecasting (a method of anticipating future performance), similar items or location attributes approximate
future behavior. The modeling algorithms need enough historical data to find cycles in the data, using those
cycles to project future behavior.
In some cases, a shock in the system may change demand so divergently that historical data becomes
irrelevant. When the government shuttered properties due to the COVID pandemic, toilet paper demand
spiked, drive-through usage grew, and gasoline usage fell. When the pandemic eases, good forecasting will
identify the pandemic, but will include enough historical data that the machine-learning algorithm recognizes
prior normal behavior, using it for the future forecasts.
COPYRIGHT 2021, AMAZON WEB SERVICES, INC. OR ITS AFFILIATES19 21st Century Forecasting for the Travel & Hospitality Industry
A User Mediated Forecast
While Machine Learning generated forecasts consistently have higher accuracy and positively influence
revenue for the business, business managers often are uncomfortable relying on these forecasts. These
managers have historically seen forecasting as an important component of their job. Managers often have
insights that do not exist in the data. For example, they are aware of special orders made over the phone,
special events, and unexpected weather events. Given their experience, they should be able to adjust the
forecasts with an override.
Our experience shows that business managers are more receptive to Machine Learning generated forecasts, if
they can be part of the forecasting effort. We propose a process outlined below in order to support the
businesses goals for forecast accuracy, while also allowing business managers the ability to provide input.
This diagram shows the movement from a current forecasting approach to a Machine Learning Generated
Forecast. Business Managers review and potentially override the forecast, explaining the reasons for the
override. Performance Monitoring compares Forecast Value Add and Impact on Revenue of the old
forecasting approach versus the Machine Learning Generated Forecast and the Machine Learning Generated
Forecast with the Business Override. If Business overrides become too frequent, the forecast team should
review the reasons and incorporate the reasons as new attributes (as much as possible) into the model.
Ultimately, the model becomes even more accurate over time.
COPYRIGHT 2021, AMAZON WEB SERVICES, INC. OR ITS AFFILIATES20 21st Century Forecasting for the Travel & Hospitality Industry
Advancing your Forecasting Journey
As you continue on your forecasting journey, consider:
• What metrics do we include to evaluate our forecast currently?
• What business impact do we want our forecasts to have? How can we measure them?
• What data will we have available to use for building a forecast model? Of this, what will be available when
we want to predict the forecast horizon (future)?
• How far ahead do we need to use the forecasts that were developed?
• At what level do we need to forecast based on location and product hierarchy?
• How much effort can we put into model refresh/rebuild and at what frequency?
• What level of granularity will result in valuable forecasts?
• Is perfection expected? Or is reliable and robust performance that will guide your business in the right
direction?
• Will my business accept the forecast as is? Alternatively, will they want to adjust it?
Remember that accurate forecasting requires iterative enhancements, meeting business expectations while
consistently improving results over time. Good forecasting leverages state-of the-art technology, but must be
an ongoing process where the business owners are willing to experiment to obtain the best result possible.
COPYRIGHT 2021, AMAZON WEB SERVICES, INC. OR ITS AFFILIATESCHAPTER THREE
Travel & Hospitality:
Customer Success
COPYRIGHT 2021, AMAZON WEB SERVICES, INC. OR ITS AFFILIATES 21Data analysis at petabyte scale Founded in 2007, sweetgreen is a destination for simple, seasonal, healthy food. They believe the choices we make about what we eat, where it comes from and how it’s prepared have a direct and powerful impact on the health of individuals, communities and the environment. That’s why they are building a transparent supply network, why they cook from scratch, and why they are building a community of people who support real food. sweetgreen desired to bring data together from 31 separate sources to derive sustainability and ingredient production forecasts. Their challenge: how to manage and deploy single-purpose, short lived data clusters to solve complex problems without a dedicated data engineering team? The solution was Amazon EMR (Elastic Map Reduce) which enabled the analytical teams the elasticity to run Petabyte-scale analysis for a fraction of the cost of traditional on-premises clusters and to focus on driving business outcomes, instead of engineering. “Our greatest insight was how much food to cook per day, per time period. It drives sustainability and minimizes waste while allowing us to present the best food possible, driving operational efficiencies,” said Gerard Bartolome, Principal Data Engineer. COPYRIGHT 2021, AMAZON WEB SERVICES, INC. OR ITS AFFILIATES 22
Forecasting for every location, every five minutes

Grubhub is a leading online and mobile food-ordering and delivery
marketplace. Grubhub strengthens a restaurant's online presence, helps
them market their business to local diners, and handles delivery if they want
freedom from managing their own drivers.

For the Grubhub team, operational excellence is at the core of getting
deliveries completed on time and having a good forecast is fundamental for
smooth operations. Orders have a short horizon of delivery expectations so
the team must ensure the right number of delivery drivers are on the road.
Oversupply of drivers increases operating costs while undersupply decreases
customer satisfaction.

In order to accurately forecast demand, the engineering and data science
teams leverage a combination of forecasting models running atop Amazon
S3, and Amazon Elastic Map Reduce (EMR.)

Said Sagar Sahasrabudhe, Director of Engineering, “AWS enables
flexibility in our forecasting library.” Grubhub must execute its
forecasting at an extraordinary level of spatial granularity, down to the
individual neighborhood level. William Cox, Senior Data Scientist, states,
“what was previously a CPU intensive process can occur in parallel on
AWS, enabling our production systems to continuously regenerate
forecasts for every location, every five minutes.”

COPYRIGHT 2021, AMAZON WEB SERVICES, INC. OR ITS AFFILIATES   23
Delivering Safety and Savings
Korean Air is the South Korea's largest airline and the country's flag carrier.
While Korean Air celebrates its 50-year anniversary— the company is
building on Amazon Web Services (AWS) with an eye towards the next 50
years of excellence.

Airplanes have defined maintenance cycles, but unexpected defects can occur.
Leveraging the 50 years of past operating data, Korean Air had insights and
hypotheses on the cause and impact of these unexpected defects.

Engines consist of thousands of individual components and airlines monitor the
wear and tear on each part. The physical act of taking off a plane causes the
most stress to these components. Using Amazon SageMaker, Korean Air was
able to prove component based hypotheses against their backwards facing data
and generate predictive failure/maintenance opportunities for the future.

Kenny Chang, Executive Vice President and Chief Marketing Officer of Korean
Air said, “This drives not only safety, but significant cost savings. A planned
engine overhaul costs Multiple-Millions of dollars, but an unplanned
maintenance issue costs significantly more and causes inconveniences to
passengers and disruptions to travel and crew schedules. Using the Forecasts
generated by Amazon SageMaker and Master Mechanics, Korean Air is
performing early detection of issues, preventative maintenance, increasing the
level of safety and service, all while driving cost savings.”

COPYRIGHT 2021, AMAZON WEB SERVICES, INC. OR ITS AFFILIATES   24
Driving efficiencies with the agility to experiment

As businesses grow, so does the complexity of managing a workforce. This
was the issue faced by Australian entrepreneur Steve Shelley when he hired
Ashik Ahmed to build a platform for automating time and attendance
management. Ten years on, Deputy software—designed to be managers’
“second-in-command” is now used by more than 100,000 people in over 70
countries. Deputy’s customer roster includes Fortune 500 companies such as
McDonald’s.

Deputy’s mission is to improve the lives of shift workers, who account for
some 60 percent of the global workforce. Its mobile application is unique in
its use of sentiment analysis, a feature built with Machine Learning (ML), to
influence scheduling decisions. Deputy is then able to quickly understand
how to optimize an individual’s schedule to enable them to bring the best
version of themselves to work each day.

The business is also focused on making work life easy for business owners
and employees. By empowering staff to be stakeholders in the scheduling
process, workplace engagement increases.

Ahmed and Shelley believe technology—especially cloud computing—is an
enabler that drives significant outcomes for their customers. In its decade-
long existence, Deputy has evolved its offerings as AWS has introduced new
services, and it continuously looks at ways to improve efficiency.

One of the aspects it values most about cloud computing is the agility
offered for experimentation. “You can always undo something with
AWS,” Ahmed explains.

COPYRIGHT 2021, AMAZON WEB SERVICES, INC. OR ITS AFFILIATES   25
Speed to production – in two weeks

Upserve provides online payment and analytical software to thousands of
restaurant owners throughout the U.S. Using AWS Machine Learning, it
quickly develops and trains more than 100 learning models, streams
restaurant sales and menu item data in real time, and gives restaurateurs the
ability to predict their nightly business.

Built upon Amazon EMR and Amazon SageMaker, “we can predict the total
number of customers who will walk through a restaurant’s doors in a night.
As a result, restaurateurs can better prep and plan their staffing for that
night. For us, speed to production was a key factor…It only took two weeks
from the time we decided to use the technology to the moment we started
using predictive data in the daily email we send out…we immediately saw
Amazon SageMaker beating the baseline to predicting nightly covers,” said
Bright Fulton, Director of Infrastructure Engineering.

COPYRIGHT 2021, AMAZON WEB SERVICES, INC. OR ITS AFFILIATES   26
Predicting orders, before they’re made

When it comes to the global pizza business, Domino’s Pizza Enterprises
Limited (Domino’s) has a large slice of the pie. The company, which is the
largest Domino’s franchise holder, represents the Domino’s brand in
Australia, New Zealand, Belgium, France, the Netherlands, Japan, Germany,
Luxembourg, and Denmark. Domino’s maintains a network of more than
2,600 stores globally and is based in Brisbane, Australia.

Domino’s is an increasingly digital business, with more than 70 percent of
sales coming from online orders. To enable faster pickup and delivery, the
company recently launched Project 3TEN, an initiative that aims to have a
pizza ready for pickup within 3 minutes or safely delivered within 10. To
support this initiative, the company wanted to use forecasting and predictive
technologies to help reduce pizza making and delivery times. Leveraging
Amazon S3 and Amazon SageMaker the company built and trained Machine
Learning models to predict the likelihood that an order will be placed, so a
store can begin making that order right before it is placed.

“This isn’t making pizzas and leaving them in a hot box for half an hour—
this is getting the pizzas lined up, coming out of the oven, and ready to go
as an order is placed. Customers are getting their pizza faster, hotter, and
fresher because of the improvements we’ve put into place with Project
3TEN. The solution we developed by using AWS is a big part of that.” said
Michael Gillespie, Chief Digital and Technology Officer.

COPYRIGHT 2021, AMAZON WEB SERVICES, INC. OR ITS AFFILIATES   27
What-if scenarios for uncertain times

App8 empowers restaurateurs to create the ideal contactless dining
experience for their guests. Whether dining in or taking out, guests can use
App8’s service to browse a digital menu, order food, and pay—all from their
mobile devices and without the need to create an account or install an app.
Looking to further improve the dining experience for guests and streamline
operations for restaurateurs, App8 set out to develop a tool that could
predict customer volume and demand for particular menu items.

App8 initially tried building its prediction solution in-house but struggled
with steep development overhead. The company discovered that Amazon
Forecast, a fully managed service that uses machine learning to deliver
highly accurate forecasts, offered much of the same capability as the
company’s in-house solution at a fraction of the overhead. App8’s solution
outputs predictions at three default quantiles to address each restaurant’s
sensitivity to over- and understocking. Perhaps most importantly, the tool
can help restaurants run “what-if” scenarios to prepare in times of
uncertainty.

“Improving Forecast Accuracy with Machine Learning helped us deliver
quick, reliable, and cost-effective forecasts to our customers,” says Hani
Jabbour, Chief Technology Officer. “We’ve been able to deepen our
relationships with restaurateurs and further help them streamline their
businesses and survive the pandemic.” Using an AWS Solution in
conjunction with its own innovative service, App8 offers restaurants one
more tool to help them not only survive—but thrive.

COPYRIGHT 2021, AMAZON WEB SERVICES, INC. OR ITS AFFILIATES   28
A million predictions per day

Quantiphi helped a leading US-based Quick Serve Restaurant chain innovate
their enterprise demand forecasting capabilities using state-of-the-art deep
learning. Addressing the challenges of fulfilling explosive demand was the
emphasis of the solution, including: sufficient stocking to serve guests while
reducing waste; optimal production line management to meet fluctuating
demand periods within a day (e.g., Lunch/Breakfast hours vs. normal hours);
and managing the labor force with appropriate coverage for high levels of
customer service and product quality.

For each of the above business challenges, delivering the optimal solution
required comprehension of the minutest details such as: dropping a bag of
fries into the fryer on a minute-based forecast (e.g., 11:43 AM); ordering the
right quantity of ingredients (e.g., two extra cases of pepper jack); and
scheduling team members at the right time and with the right skillset (e.g., 2
cashiers and 1 dining room attendant instead of the historic practice of 1
cashier during dinner time).

In the words of Reghu Hariharan, cofounder of Quantiphi, “we leveraged
the power of AWS including Amazon SageMaker to scale our solutions
like never before, resulting in a huge business impact to our client’s
ability to effectively serve their customers. Enabling over one million
predictions per day for each of the 2,200 locations leading to efficient
operations across their locations, and maintaining the highest quality of
service and food they are known for.”

COPYRIGHT 2021, AMAZON WEB SERVICES, INC. OR ITS AFFILIATES   29
Pricing analytics for improved margins

Every morning millions of people drive to work, and on the way, stop at a
Quick Serve Restaurant (QSR) to pick up a cup of coffee and a bakery item.
At noon they may return for a quick lunch, and in the evening on the way
home from work they may stop in to pick up dinner for the family. Or this
consumer may use several other, growing channels such delivery or online
order/in-store pickup. A key factor that influences which restaurant brand is
selected and the items ordered is menu board pricing. Price too high and the
consumer will go elsewhere; price too low and miss margin opportunities.

Complicating matters, the types of pricing opportunities can be very
different across locations of the same restaurant brand. For example, a store
in an airport that caters to a captive audience will often have more
opportunity to have higher prices than a store located near a college
campus.

To develop a more surgical approach, Deloitte partnered with AWS to
develop a Menu Item Pricing as a Service (PraaS) offering specifically
designed for the restaurant industry. This solution consists of three elements
– a pricing analytics engine to identify the opportunity, a user portal to
transmit recommendations to restaurant managers, and dedicated advisory
support.

The upside to getting pricing right is significant – leading restaurant
brands have seen over 200bps improvement to margins when
implementing Deloitte’s pricing solution. In conjunction with AWS Data
Analytics and Machine Learning Solutions, PraaS represents a leading-
edge margin improvement lever for the QSR industry.

COPYRIGHT 2021, AMAZON WEB SERVICES, INC. OR ITS AFFILIATES   30
Analyzing billions of data points daily
3Victors created a streaming airline ticket shopping insight service to provide
forecasts and predicative analytics to some of the world’s leading travel
companies to determine how to best engage travelers and what specific
marketing content to offer them to maximize engagement while optimizing
profit.

To achieve this, 3Victors implemented an AWS architecture to capture and
durably store over 10Tb of daily-streamed air shopping data messages into a
data lake. Dozens of ETL jobs run at regular intervals to populate use case
specific data ponds. Simultaneously, the implementation provides an
extensible, real-time predictive analytics pipeline for demand forecasting and
deal classification. Said Rick Seaney, Chief Executive Officer of 3Victors, “we are
growing at a rate of 20 terabytes of data every day, and we would have had to
quadruple the size of our infrastructure to support it in an on-premises
environment. There’s no way we could afford to do that. AWS enables us to
ingest and analyze as much data as we can.“

Using AWS, 3Victors can ingest more than a billion worldwide travel searches
and 230 billion priced itineraries every day from multiple data sources,
including the world’s largest reservations systems. Because 3Victors can process
more data faster, it can give its customers better insights. “The more data we
process, the better and more accurate the answers are to the questions our
customers have,” Seaney said. “We can help them improve the likelihood of
their customers booking flights. Using AWS, we are simplifying big data to help
our customers increase conversion and return on ad spend while optimizing
revenues.”

COPYRIGHT 2021, AMAZON WEB SERVICES, INC. OR ITS AFFILIATES   31
A fully managed service, no experience needed

Increasingly busy lifestyles and an affinity for international food chains are
driving growth in the Philippines’ fast-food sector. Fast-food outlets are a
mainstay of commercial zones in cities and rural areas, and Filipino
consumers are spoiled for choice. For Ramcar Group KFC, the group manages
its own poultry processing, warehouses, and trucking network that delivers
fresh ingredients to stores each day.

Ramcar wanted to take advantage of machine learning (ML) technology to
support its analytics goals but did not have a dedicated data team to develop
ML algorithms. Because Amazon Forecast is a fully managed service, Ramcar
requires no ML experience, just historical and relevant external data to feed its
ML model. The menu forecasts enable the creation of a cooking schedule, with
regular monitoring of inventory levels to avoid out-of-stock situations or delays
for customers waiting in line while their order is cooked. Forecasting leads to
lowering the cost of inventory on hand and right-sizing of stores as storage
space for food and packaging materials is better planned and managed.

Louie Quiogue, Chief Information Officer at Ramcar Group of Companies said
“Following the direction set by KFC Philippines President, Jerome Tuguin, we
wanted to build a business-intelligence platform that would enable us to make
better informed decisions about what and how we produce, and that all starts
with data. With a data warehouse on the AWS Cloud, we can come up with
improved ways to reach and satisfy our customers. Now the fun part really
begins. Once we see what data we have at the tip of our fingers in real time, we
can better understand the new things that we are capable of doing. We’re also
able to see breakdowns on sales from different channels such as our website to
monitor how each channel is performing and allocate resources appropriately
to improve sales. Being on the AWS Cloud makes it a lot easier to integrate our
workloads across divisions and geographies. Our teams have complimented IT
on the new platform, and we’re all looking forward to the next phase.”

COPYRIGHT 2021, AMAZON WEB SERVICES, INC. OR ITS AFFILIATES   32
You can also read