2023 Global Outlook - Recoveries and opportunities
←
→
Page content transcription
If your browser does not render page correctly, please read the page content below
2023 Global Outlook

Recoveries and opportunities

                      T I M H AY E S , C M T, C H I E F G L O B A L I N V E S T M E N T S T R A T E G I S T
A Special Report by                J O E K A L I S H , C H I E F G LO B A L M A C R O S T R AT E G I S T
                                             ALEJANDRA GRINDAL , CHIEF ECONOMIST
Ned Davis Research                 M A R K P H I L L I P S , E U R O P E A N E Q U I T Y S T R AT E G I S T
SPECIAL REPORT GLOBAL OUTLOOK
DECEMBER 14, 2022 email us
NDR 2023 Global Outlook
Special Report Executive summary
Entering 2022, we anticipated “a it is likely to stay higher for longer. continuing recovery in gold.
year of reversals,” with rising equity
Table of Contents
volatility and double-digit weak- Yield curve steepening can be We are watching for better
1 Executive Summary ness. We expect 2023 to include expected. And with interest rate Technology stock performance to
recoveries and present opportuni- volatility subsiding, MBS and support global breadth and U.S.
2 Global Allocation
ties, with most central banks long-term corporate spreads relative strength. While a risk for
7 Global Fixed Income ending their tightening cycles. should narrow, leading to outper- Europe is that too much good
formance. EM bonds should also news has been discounted too
9 Global Economy
The increased probability of a be supported. And EM equities are early, a choppy uptrend is likely for
13 Europe severe global recession adds an likely to recover as EM currencies European equities. Cyclical sectors
element of risk to the outlook. And strengthen and the U.S. dollar should outperform defensive
while inflation has peaked globally, weakens, consistent with a sectors.
Toplines for NDR’s 2022 Global Outlook
Global Allocation
• Cyclical bull market potential supported by pessimism extreme, rally confirmation and Global Balanced Account Model.
• Continuation of secular bull makes it likely that cyclical bear has ended.
• Watching for improved Tech sector performance to support U.S. relative strength, emerging markets to benefit from
dollar weakness, and continuing dollar downtrend, gold uptrend.
Global Fixed Income
Strategists
• Except for Japan, tightening cycles to end in the first half of 2023.
Tim Hayes, CMT, • We see opportunities building in bonds, spread product, and cash. Once again, bonds should provide an effective
Chief Global hedge against equity risks in balanced portfolios.
Investment Strategist • Yield curves should steepen later in the year.
Global Economy
Joe Kalish,
Chief Global Macro • We estimate 2.4% real global GDP growth in 2023 and assign a 65% chance of severe global recession.
Strategist • Recession in developed economies and a Chinese reopening present offsetting risks.
• Global inflation has peaked but will stay higher for longer.
Alejandra Grindal, Europe
Chief Economist
• Bullish technical indicators suggest risk appetite could continue into the start of 2023.
• But the full impact of central bank tightening on the European economy and falling earnings could result in choppy
Mark Phillips,
markets as 2023 progresses.
European Equity
Strategist • Falling inflation and yields and an improvement in the outlook for economic growth, could pave the way to a strong
year end.
PERIODICAL | ISSUE: #SP20221214 | NDR.COM Please see important disclosures at the end of this report. DECEMBER 14, 2022 1GLOBAL OUTLOOK A L LO CAT I O N
T I M H AY E S , C M T C H I E F G LO B A L I N V E S T M E N T S T R AT E G I S T
DECEMBER 14, 2022 email us
An equity uptrend
Expect cyclical bull confirmation within ongoing secular bull
Overweight equities, marketweight bonds, underweight cash
Key Takeaways NDR Global Stock/Bond/Cash Recommendations Daily Data 2008-02-28 to 2022-12-08
Equity Line Based on NDR Global Recommendations (2022-12-08 = 224.89)
Benchmark Equity Line (55/35/10 Stocks/Bonds/Cash) (2022-12-08 = 210.17)
Clip Notes: All lines = 100 on 2008-02-28
• Cyclical bull market potential 158 158
supported by pessimism extreme, 100 100
rally confirmation and Global Recommended Equity % (2022-12-08 = 65%)
80 Maximum 80
Balanced Account Model.
60 60
• Continuation of secular bull makes it 40
Equity Benchmark Weight = 55% Minimum Source: Ned Davis Research, Inc.
40
likely that cyclical bear has ended. 50
Recommended Bond % (2022-12-08 = 35%)
50
40 40
• Watching for improved Tech sector 30 30
performance to support U.S. relative
20 20
Bond Benchmark Weight = 35% Source: Ned Davis Research, Inc.
Recommended Cash % (2022-12-08 = 0%)
strength, emerging markets to
20 20
benefit from dollar weakness, and 10 10
continuing dollar downtrend, gold 0 0
Cash Benchmark Weight = 10% Source: Ned Davis Research, Inc.
uptrend. 2008 2009 2010 2011 2012 2013 2014 2015 2016 2017 2018 2019 2020 2021 2022
Strategy vs. Benchmark Returns Strategy vs. Benchmark Returns
Allocation recommendations follow I4000 prior Full History: 2005-07-29 - 2022-12-09 Chart View: 2008-02-28 - 2022-12-08
to 2008 and I04000 from 2008-01-01 to 2009-06-04.
Equity Line Gain/Annum Equity Line Gain/Annum
A choppy uptrend is likely in 2023. And a
For more details click here.
Minimum and Maximum Equity Allocations starting from 2008-01-01. Recommendations 5.9% Recommendations 5.6%
Benchmark 5.2% Benchmark 5.2%
severe global recession would increase the Customized version of I4001A © Copyright 2022 Ned Davis Research, Inc. Further distribution prohibited without prior
permission. All Rights Reserved. See NDR Disclaimer at www.ndr.com/copyright.html.
correction risk and elevate the volatility. For data vendor disclaimers refer to www.ndr.com/vendorinfo/
But our base case is that 2023 will include for the year is a conservative expectation. Global Sentiment Composite dropped below
increasing confirmation that global equities When pessimism has been excessive during 10 on September 23, as shown at the top of
have entered a cyclical bull market that the secular bull periods since 1995, the S&P the next page.
started with the October lows, reconfirming 500 has gained 32% per annum, while rising
the continuation of the secular bull market at a 13% per annum rate after entering the While those excessive fear signals have
that started in 2009. Even after the current neutral mode. A rise into that mode can be almost always been followed by rallying over
year’s decline, the ACWI is maintaining a expected as the uptrend gains strength in the subsequent three, six and 12-month
per annum gain of 10% per annum since the 2023. periods, the tendency has been especially
secular bull started. strong after a cyclical bear market has been
We have already gotten positioned for a followed by two consecutive signals. As
Reversing from sentiment better year in 2023, having increased our indicated by the highlighted sections of the
extreme global equity allocation to an overweight chart, the four second signals have been
As the strongest secular bull gains have of 65% versus the benchmark allocation followed by double-digit gains over the
tended to occur early in an advance when of 55% (above). The first hopeful sign was subsequent six months and returns of close
sentiment is still pessimistic, a 10% gain the extreme panic indicated when our DSI to 20% or more over the 12-month periods.
PERIODICAL | ISSUE: #SP20221214 | NDR.COM Please see important disclosures at the end of this report. DECEMBER 14, 2022 2GLOBAL OUTLOOK A L LO CAT I O N
3 | NED DAVIS RESEARCH
Strengthening uptrend Pessimism extremes followed by rallying
Daily Data 2002-12-31 to 2022-12-09 (Log Scale)
MSCI ACWI vs. DSI Global Sentiment Composite
We would never increase exposure based
MSCI ACWI
794 794
on sentiment alone. Broad-based trend 708 708
improvement is needed for assurance that 631 631
the lows are in place. And that’s what has 562 562
501 501
been indicated by our Rally Watch report. 447 447
After the aggregate has first risen above 398
ACWI X-Month Performance Following Initial*
398
355 DSI Global Sentiment Drops Below 10 355
50%, as it did on November 15, a rally has 316
1-Month 3-Month 6-Month 12-Month
316
2003-03-10 7.9 20.0 27.2 41.4
ensued in 81% of the cases since 1981, as 282
2008-09-17
2009-01-20
-18.8
-4.8
-21.4
5.2
-30.3
18.6
-3.8
39.7
282
shown in the chart below. The rallies have
2011-08-08 3.8 8.2 14.4 14.8
251 251
2012-06-01 5.9 8.8 12.1 27.3
224 2014-10-10 5.9 6.0 14.5 5.9 224
been followed be a median advance of 21% 200
Second 2015-08-21 -0.9 4.5 -6.1 4.9
200
signals
2016-01-15 -1.6 8.4 11.0 18.8
over the next 335 days.
2018-03-23 3.2 4.9 8.4 4.3
178 2018-12-24 9.3 15.3 19.1 28.8
178
2020-03-06 -11.2 5.2 10.6 26.2
158 158
2022-03-07 6.5 0.3 -4.7 -
141 2022-09-23 0.7 - - - 141
Model shift to equities 126
*First time DSI drops below 10 in three months Source: MSCI
Mean
Median
Percent Positive
0.5
3.2
61.5%
5.4
5.6
91.7%
7.9
11.5
75.0%
18.9
18.8
90.9%
126
Along with the bullish implications of the 100
DSI Global Sentiment Composite 2022-12-09 = 50.2
100
90 90
sentiment extreme and trend improvement, 80
70
80
70
our equity upgrade was a response to the 60
50
60
50
more favorable implications of our Global 40
30
40
30
Balanced Account Model. The model not 20
10
20
10
0 0
only includes sentiment and price-based Daily Sentiment Index (DSI) Global Sentiment Composite: Equal-weighted composite based futures trader expectations for
S&P 500, NASDAQ 100, Nikkei, FTSE 100, and Euro-Stoxx 50 (DAX and CAC 40 included prior to 2019-11-26) Source: DSI trade-futures.com
2003 2004 2005 2006 2007 2008 2009 2010 2011 2012 2013 2014 2015 2016 2017 2018 2019 2020 2021 2022 2023
indicators, but also macro factors related to I4121C © Copyright 2022 NDR, Inc. Further distribution prohibited without prior permission.
All Rights Reserved. See NDR Disclaimer at www.ndr.com/copyright.html
earnings and economic influences. For data vendor disclaimers refer to www.ndr.com/vendorinfo/
Rally Watch signals followed by rallying Consistent with the Rally Watch report,
Maximum Rallies in Global Stocks vs. Rally Watch Indicators Daily Data 2012-12-10 to 2022-12-09
Global Stock Price Index** (2022-12-09 = 2,288.59) the internal components of the model’s
Bullish Signal on 2022-11-15**
3,162
Market Return Since Signal: -0.7%
3,162
stock/bond composite model have shifted
2,512 2,512
to equities, with the composite ending
1,995 1,995
1,585 1,585
November at 75%. And following a buy
1,259 1,259
signal from its credit spread factor, the
1,000 21.9 19.9 21.4 1,000 model’s external composite ended the
15.3 8.9 35.8
794 ** MSCI World Index price returns used prior to 1988, MSCI ACWI price returns used thereafter. Source: MSCI 794 month in its neutral mode at 43%. As a
Percentage of Bullish Rally Watch Indicators (2022-12-09 = 37.50)
result, the model’s recommended allocation
70 70
60 60 moved from an October allocation of 47%
50 50
stocks, 40% bonds and 13% cash to a
40 40
30 30 November allocation of 58% stocks, 40%
20 20
10 10
bonds and 2% cash.
0 0
Bracket = 50 Source: MSCI
2013 2014 2015 2016 2017 2018 2019 2020 2021 2022 The model’s decisive reallocation from
** Bullish Signal Expires on 2023-11-15 or
cash to stocks was the primary reason for
After a 5% Correction from the Signal Date,
Whichever Occurs First. the upgrade, with the sentiment extreme
Bullish signals (vertical dashed lines) = % Bullish
Indicators first crosses above 50.
Total Valid Cases Signal Median Median Rally Length Median Length to Rally
Cases (>3% Rally) Accuracy (%) Rally (Calendar Days) (Calendar Days)
and Rally Watch implications supporting a
Repeat signals screened for 12 months.
After screening period the % bullish must reverse above
21 17 81.0 21.4 335 8 more aggressive upgrade than the model
the bracket from below to trigger a new signal.
Shaded periods = max rallies > 3% during the 12 months following signals has called for.
(signal dates followed by corrections of 5% or more excluded)
Customized version of I55G © Copyright 2022 Ned Davis Research, Inc. Further distribution prohibited without prior
permission. All Rights Reserved. See NDR Disclaimer at www.ndr.com/copyright.html.
For data vendor disclaimers refer to www.ndr.com/vendorinfo/
PERIODICAL | ISSUE: #SP20221214 | NDR.COM Please see important disclosures at the end of this report. DECEMBER 14, 2022 3GLOBAL OUTLOOK A L LO CAT I O N
4 | NED DAVIS RESEARCH
Receding rate hike fears 2022 decline consistent with cyclical bears within secular bulls
A History of Bear Markets: Dow Jones Industrial Average (1900-Present)
It was the fear of inflation and its -10
Sources:
influence on central bank policy that 1953
S&P Dow Jones Indices
2016 Ned Davis Research Calculations
drove the stock and bond downtrends this 2011 19711984
1960
1949 1980
-20 1998 1923
1957
year, culminating in the sentiment extreme. 1990
2022
19391934 1947
1982 1914
Stocks and bonds have since trended higher 1962
1966
1978 1911
-30
on the increasing evidence that inflation is 2002
2001
receding, which means that central banks 1987 1970
2020 1933
will be able to slow and eventually stop their -40
1917 1942
rate hiking initiatives. 1974
Loss %
1921 1903
1929 1907
-50 1938
Recognizing that the inflation of 2023 has 2009
been driven by supply disruptions rather -60
than a wage-price spiral, we have made
the case that the secular bear years of the -70
stagflationary 1970s, which were fueled
Cyclical Bears within Secular Bulls
by oil price shocks, are less comparable Mean for Cyclical Bears within Secular Bulls (-22.8% Loss, 198 Days)
-80 Cyclical Bears within Secular Bears
than the late 1940s, when the post-war Mean for Cyclical Bears within Secular Bears (-36.9% Loss, 371 Days)
Mean for All Bear Markets (-31.0% Loss, 299 Days)
reopening produced a short-lived inflation Current Bear Market 1932
spike driven by supply shortages, pent-up 25 50 75 100 125 150 175 200 225 250 275 300 325 350 375 400 425 450 475 500 525 550 575 600 625 650 675 700 725 750 775 800
Market Days
demand and the removal of price controls. S0202C © Copyright 2022 NDR, Inc. Further distribution prohibited without prior permission.
All Rights Reserved. See NDR Disclaimer at www.ndr.com/copyright.html
For data vendor disclaimers refer to www.ndr.com/vendorinfo/
Equities have usually advanced from last rate hike to first cut The earlier spike produced a cyclical bear
Data Updated Through 2022-11-22
MSCI ACWI Performance Between Fed's Last Rate Hike and First Cut
124 1989-02-24 to 1989-06-06 (4.9%) 124
market of -23% on the DJIA in 1946 and
123
122
1995-02-01 to 1995-07-06 (5.9%)
2000-05-16 to 2001-01-03 (-11.5%)
123
122
1947, within an ongoing secular bull. That
2006-06-29 to 2007-09-18 (19.2%)
120 2018-12-19 to 2019-07-31 (14.8%) 120 bear market low is therefore one of the
119 Mean (8.0%) 119
117 117 green dots in the chart above, indicating
116 116
115 115 that the cyclical bears within secular bulls
114 114
112 112 have tended to be shorter and more shallow
111 111
110 110 than the cyclical bears within secular bears
108 108
107 107 (red dots). The black dot identifies the
106
105
106
105
2022 drop of -22%, more consistent with a
104
102
104
102
secular bull than a secular bear.
101 101
100 100
99 99 Considering that the U.S. accounts for 61%
98 98
97 97 of the ACWI’s weight, it would be especially
95 95
94 94 influential if the Fed would end its tightening
93 93
92 92 cycle, with the markets expecting an
91 91
90 90 eventual cut. The chart at left shows that
89 89
88 88 in four of the last five cases, the ACWI has
87
86 Source: MSCI
87
86
moved higher during the period between
85 Based on periods between Federal Reserve Board's last fed funds rate increase in a tightening cycle and first rate cut in an easing cycle
03 12 21 01 10 21 30 08 19 28 09 18 27 07 16 27 06 15 26 04 15 24 02 13 22 05 14 23 03 12 23 02 11 22 31 11 20 29 10 19 30 08 17 28 06 17
85
the last hike and first cut. The exception
Jul '06 Aug '06 Sep '06 Oct '06 Nov '06 Dec '06 Jan '07 Feb '07 Mar '07 Apr '07 May '07 Jun '07 Jul '07 Aug '07 Sep '07
STH22_49A_C © Copyright 2022 NDR, Inc. Further distribution prohibited without prior permission.
All Rights Reserved. See NDR Disclaimer at www.ndr.com/copyright.html
followed the final hike in 2000, during the
For data vendor disclaimers refer to www.ndr.com/vendorinfo/
early stages of the secular bear.
PERIODICAL | ISSUE: #SP20221214 | NDR.COM Please see important disclosures at the end of this report. DECEMBER 14, 2022 4U.S. FOCUS EQUITIES
5 | NED DAVIS RESEARCH
Severe recession scenario Valuations have improved
MSCI ACWI Trailing and Forward Earnings Yield Daily Data 2003-06-30 to 2022-12-09
A similar failure to respond would reflect MSCI ACWI (2022-12-09 = 745.75)
the onset of a severe global recession. With 794 794
631 631
earnings estimates proving to be overly 501 501
optimistic, the disappointments would 398
316
398
316
send equities back to new lows. Instead of 251 251
200 200
considering valuations reasonable at current Source: MSCI
12-Month Trailing Earnings Yield (2022-12-09 = 5.9%)
Global
levels, seeing equities as a far better value recession
10.0 10.0
than a year ago, investors would require extremes
8.0 8.0
much better valuations, as they did
6.0 6.0
around the bottoms in 2009 and 2020. 4.0 4.0
Source: MSCI
12-Month Forward Earnings Yield (2022-12-09 = 6.7%)
12.0 12.0
10.0 10.0
8.0 8.0
6.0 6.0
4.0 Source: MSCI 4.0
2004 2005 2006 2007 2008 2009 2010 2011 2012 2013 2014 2015 2016 2017 2018 2019 2020 2021 2022
2003-06-30 to 2022-12-09 Mean Median
Trailing Earnings Yield 5.8% 5.7%
Forward Earnings Yield 7.1% 6.9%
Customized version of I182 © Copyright 2022 Ned Davis Research, Inc. Further distribution prohibited without prior
permission. All Rights Reserved. See NDR Disclaimer at www.ndr.com/copyright.html.
For data vendor disclaimers refer to www.ndr.com/vendorinfo/
Tech has most weight in U.S. Otherwise in the absence of a severe
Daily Data 1994-05-31 to 2022-12-09
MSCI United States Sector Weights
Energy Materials Industrials Consumer Discretionary Consumer Staples Health Care Information Technology Communication Services Utilities Financials Real Estate
recession, with interest rate pressures
(4.6%) (2.7%) (8.5%) (10.6%) (7.4%) (15.3%) (26.4%) (7.6%) (2.9%) (11.2%) (2.7%)
100%
BEAR BULL
100%
abating, the Information Technology sector
95% 95% would be better positioned to participate in
90% 90% a global market advance, potentially leading
85% 85%
it.
80% 80%
75% 75%
70% 70%
As the sector’s weight is 26% of the MSCI
65% 65% U.S. Index, (left) better Tech performance
60% 60% would increase the chances that after
55% 55% weighing down the global benchmark with
50% 50%
its underperformance for most of the
45% 45%
year, the U.S. would outperform during a
40% 40%
35% 35%
2023 market advance. Continuing Tech
30% 30% sector breadth improvement would be an
25% 25% encouraging development for the sector and
20% 20%
in turn the relative strength prospects for
15% 15%
the U.S. index.
10% 10%
5% 5%
Source: MSCI
0% 0%
1996 1998 2000 2002 2004 2006 2008 2010 2012 2014 2016 2018 2020 2022
ICS_400C_US © Copyright 2022 NDR, Inc. Further distribution prohibited without prior permission.
All Rights Reserved. See NDR Disclaimer at www.ndr.com/copyright.html
For data vendor disclaimers refer to www.ndr.com/vendorinfo/
PERIODICAL | ISSUE: #SP20221214 | NDR.COM Please see important disclosures at the end of this report. DECEMBER 14, 2022 5U.S. FOCUS EQUITIES
6 | NED DAVIS RESEARCH
We are also watching for improved relative
Strengthening emerging market currencies support EM equities
Daily Data 2019-12-09 to 2022-12-09
strength in the MSCI Emerging Markets MSCI Emerging Markets vs. Equal-Weighted Emerging Market Currency Composite
Index now that the U.S. dollar is weakening 79,433
MSCI Emerging Markets (2022-12-09 = 58,968.29)
79,433
(below, top clip), helping our equal-weighted 70,795 70,795
Emerging Market Currency Composite rise 63,096 63,096
above its 50-day moving average (right). 56,234 56,234
When the composite has been above the 50,119 50,119
smoothing, the EM Index has gained more 44,668 44,668
than 20% per annum since 2000 and during
Source: MSCI
Equal-Weighted Emerging Markets Currency Index vs. USD(2022-12-09 = 63.0)
the three years shown in the chart. 50-Day Moving Average (2022-12-09 = 61.8)
72.0 72.0
70.0 70.0
The U.S. Dollar Index downtrend can be 68.0 68.0
expected to continue as long as nominal 66.0 66.0
and real U.S. bond yields continue to fall 64.0 64.0
relative to non-U.S. yields. The widening 62.0 62.0
spreads underpinned the dollar this year
60.0 Source: Ned Davis Research, Inc. 60.0
Jan Apr Jul Oct Jan Apr Jul Oct Jan Apr Jul Oct
until it became clear that the Fed would be 2020 2021 2022
tightening less aggressively. MSCI EM Index Performance
Full History: 2000-03-13 to 2022-12-09
MSCI EM Index Performance
Chart View: 2019-12-09 to 2022-12-09
Equal-Weighted EM % Gain/ % of Equal-Weighted EM % Gain/ % of
Currency index based on 22 emerging market currencies Currency Index is: Annum Time Currency Index is: Annum Time
Above 50-Day MA 22.71 48.45 Above 50-Day MA 25.07 40.24
Below 50-Day MA -10.21 51.55 Below 50-Day MA -13.79 59.76
Buy/Hold = 4.50% Gain/Annum Buy/Hold = 0.13% Gain/Annum
Customized version of I2051 © Copyright 2022 Ned Davis Research, Inc. Further distribution prohibited without prior
permission. All Rights Reserved. See NDR Disclaimer at www.ndr.com/copyright.html.
For data vendor disclaimers refer to www.ndr.com/vendorinfo/
As dollar weakens, gold and EM performing better Aligned with our models, we are entering
U.S. Dollar Index, Gold Futures & Emerging Markets Relative Strength Daily Data 2021-12-09 to 2022-12-09
U.S. Dollar Index (2022-12-09 = 104.93) 2023 with the bearish dollar position
50-Day Moving Average (2022-12-09 = 109.28)
200-Day Moving Average (2022-12-09 = 105.75) assumed in November. And in recognizing
110 110
the dollar’s inverse correlation with gold
105 105 (middle clip), the positive influence of
100 100 declining yields, and the recent buy signal
95 95
from the aggregate indicators in our Gold
91 Source: Bloomberg Finance L.P. 91
Gold Futures (2022-12-09 = 1,817.90) Watch report, we moved to bullish on gold
50-Day Moving Average (2022-12-09 = 1,726.72)
200-Day Moving Average (2022-12-09 = 1,802.01) last week.
1,995 1,995
1,905 1,905
While the S&P GSCI Energy Index has
1,820 1,820
1,738 1,738 continued to trend lower, the Precious
1,660 1,660 Metals Index has reversed higher, as has the
Source: Commodity Systems, Inc. (CSI) www.csidata.com
MSCI Emerging Markets/MSCI ACWI (2022-12-09 = 7,907.22) Industrial Metals Index. The metals recovery
50-Day Moving Average (2022-12-09 = 7,684.52)
200-Day Moving Average (2022-12-09 = 7,891.82) would not be likely to continue with a severe
8,710 8,710
global recession developing.
8,318 8,318
7,943 7,943
7,586 7,586
7,244 Source: MSCI
7,244
Jan Feb Mar Apr May Jun Jul Aug Sep Oct Nov Dec
2022
Customized version of I210 © Copyright 2022 Ned Davis Research, Inc. Further distribution prohibited without prior
permission. All Rights Reserved. See NDR Disclaimer at www.ndr.com/copyright.html.
For data vendor disclaimers refer to www.ndr.com/vendorinfo/
PERIODICAL | ISSUE: #SP20221214 | NDR.COM Please see important disclosures at the end of this report. DECEMBER 14, 2022 6GLOBAL OUTLOOK FIXED INCOME
J O S E P H F. K A L I S H , C H I E F G LO B A L M A C R O S T R AT E G I S T
DECEMBER 14, 2022 email us
A better year for fixed income!
Look for steeper curves and more opportunities
Yields should break to the downside on recession fears
Key Takeaways Yields on Key 10-Year Governments Daily Data 2017-12-11 to 2022-12-09
U.S. (2022-12-09 = 3.57%)
U.K. (2022-12-09 = 3.18%)
Germany (2022-12-09 = 1.93%)
Japan (2022-12-09 = 0.26%)
4.5 4.5
• Except for Japan, tightening
4.0 4.0
cycles to end in the first half of 3.5 3.5
2023. 3.0 3.0
2.5 2.5
• We see opportunities building 2.0 2.0
in bonds, spread product, and 1.5 1.5
cash. Once again, bonds should 1.0 1.0
provide an effective hedge 0.5 0.5
against equity risks in balanced 0.0 0.0
portfolios. -0.5 -0.5
-1.0 -1.0
Source: Bloomberg Finance L.P., Federal Reserve Board
• Yield curves should steepen later Jan
2018
Apr Jul Oct Jan
2019
Apr Jul Oct Jan
2020
Apr Jul Oct Jan
2021
Apr Jul Oct Jan
2022
Apr Jul Oct
in the year. Full History Chart History
Correlation Matrix Correlation Matrix
1992-01-02 to 2022-12-09 2017-12-08 to 2022-12-09
Assets U.S. U.K. Germany Japan Assets U.S. U.K. Germany Japan
U.S. 1.00 U.S. 1.00
U.K. 0.96 1.00 U.K. 0.88 1.00
With most developed economies expected Germany 0.95 0.98 1.00 Germany 0.87 0.97 1.00
Japan 0.86 0.93 0.90 1.00 Japan 0.47 0.69 0.73 1.00
to flirt with, or fall into, recession in B190 © Copyright 2022 Ned Davis Research, Inc. Further distribution prohibited without prior
permission. All Rights Reserved. See NDR Disclaimer at www.ndr.com/copyright.html.
2023, central banks are also expected For data vendor disclaimers refer to www.ndr.com/vendorinfo/
to slow, and then end, their tightening
cycles sometime in the first half of next MBS and long-term corporate spreads to Japan remains the exception. The BOJ
year. The market expects the Fed’s terminal ease, leading to outperformance. Lower remains on hold with yield curve control
rate to be around 5.00%, while the ECB’s volatility will also be appealing for EM firmly in place through Q1. But at that
should peak below 3.00%. A 4.50% terminal bonds. point, an expected policy assessment
rate is anticipated for the Bank of England. coinciding with the end of Governor
For the first time in years, discounted Kuroda’s term could result in a policy shift
Bonds could easily rally through yield bonds will be attractive for those investors should inflation continue to run above the
support levels shown on the chart on who favor capital gains over interest BOJ’s 2% target. Core inflation excluding
evidence of recession, slowing inflation, and income. fresh food is current running at 3.6% y/y. In
shifting policy. Once again, bonds could a new regime, JGB yields would likely
provide an effective hedge for equities Cash will also earn a positive nominal rise, putting upward pressure on global
against growth and earnings concerns. return and maybe a positive real return, bond yields. Japan is already favored on a
and be a viable alternative for conservative currency-hedged basis compared to the
With most central banks on hold, rate investors. U.S. and Europe. That could stifle any Q1
volatility should subside, allowing agency bond rally.
PERIODICAL | ISSUE: #SP20221214 | NDR.COM Please see important disclosures at the end of this report. DECEMBER 14, 2022 7GLOBAL OUTLOOK FIXED INCOME
8 | NED DAVIS RESEARCH
Prepare for a steepener in 2023
Government Yield Curve for Select Countries (10-Year minus 2-Year) Daily Data 2021-12-10 to 2022-12-09
U.S. (2022-12-09 = -76.0 bps)
U.K. (2022-12-09 = -24.5 bps)
Germany (2022-12-09 = -22.7 bps)
Japan (2022-12-09 = 26.8 bps)
80 80
60 60
40 40
20 20
0 0
Except for Japan, developed market yield -20 -20
curves are inverted. With recessions likely -40 -40
and policy tightening to end, we anticipate -60 -60
that yield curves will start to produce a -80 -80
bull steepener. -100 -100
Source: Bloomberg Finance L.P., Federal Reserve Board
15 3 18 1 1 15 1 18 2 16 1 15 1 18 1 15 1 16 3 17 1 15 30
1
Jan 2022 Feb 2022 Mar 2022 Apr 2022 May 2022 Jun 2022 Jul 2022 Aug 2022 Sep 2022 Oct 2022 Nov 2022 Dec 2022
Available Term Structures: Full History Chart History
10-Year - 2 Year Correlation Matrix Correlation Matrix
10-Year - 3 Year
1992-01-02 to 2022-12-09 2021-12-13 to 2022-12-09
10-Year - 5 Year
30-Year - 2 Year Assets U.S. U.K. Germany Japan Assets U.S. U.K. Germany Japan
30-Year - 3 Year U.S. 1.00 U.S. 1.00
30-Year - 5 Year U.K. 0.69 1.00 U.K. 0.56 1.00
30-Year - 10 Year Germany 0.64 0.57 1.00
Germany 0.27 0.53 1.00
5-Year - 2 Year
5-Year - 3 Year Japan 0.00 -0.05 0.40 1.00 Japan -0.64 -0.12 -0.06 1.00
B1591 © Copyright 2022 Ned Davis Research, Inc. Further distribution prohibited without prior
permission. All Rights Reserved. See NDR Disclaimer at www.ndr.com/copyright.html.
For data vendor disclaimers refer to www.ndr.com/vendorinfo/
Global credit unlikely to continue its outperformance Global credit has had a remarkable year
Major Sector Credit Performance Relative to the Global Aggregate Daily Data 2017-12-11 to 2022-12-09
Global IG Corporate Credit (USD) / Global Aggregate ex-CNY (2022-12-09 = 120.05) relative to the Global Agg, particularly
120.0 120.0
118.0 118.0
for Europe. But this had more to do with
116.0 116.0 the shorter duration of European credit
114.0 114.0
112.0 112.0
compared to the broader indexes, as credit
110.0 110.0 spreads widened modestly over the course
108.0 108.0
106.0 106.0
of the year. We’re looking for credit to
Source: Bloomberg Barclays Indices
Global HY Credit (USD) / Global Aggregate ex-CNY (2022-12-09 = 193.90) underperform in the first half of next year,
200 200
190 190
creating a better opportunity for credit
180 180 outperformance later in the year.
170 170
160 160
150 150 Although we recently closed out our local
140 140 currency Chinese bond trade, dollar-
130 Source: Bloomberg Barclays Indices 130
Emerging Markets (USD) / Global Aggregate ex-CNY (2022-12-09 = 196.57) denominated emerging market debt has a
195 195 mixed outlook. Although a declining dollar
190 190
is bullish for EM debt, falling commodity
185 185
prices and weak growth tend to result in
180 180
175 175
wider spreads. We are currently neutral and
170
Source: Bloomberg Barclays Indices
170 stuck in a trading range, but are looking to
Jan Apr Jul Oct Jan Apr Jul Oct Jan Apr Jul Oct Jan Apr Jul Oct Jan Apr Jul Oct establish bullish EM positions sometime
2018 2019 2020 2021 2022
B1196C © Copyright 2022 Ned Davis Research, Inc. Further distribution prohibited without prior in 2023.
permission. All Rights Reserved. See NDR Disclaimer at www.ndr.com/copyright.html.
For data vendor disclaimers refer to www.ndr.com/vendorinfo/
PERIODICAL | ISSUE: #SP20221214 | NDR.COM Please see important disclosures at the end of this report. DECEMBER 14, 2022 8GLOBAL OUTLOOK ECONOMICS
ALEJANDRA GRINDAL , CHIEF ECONOMIST
DECEMBER 14, 2022 email us
Severe global recession risk rising for 2023
U.S. and China present offsetting risks
We’ve been in a global slowdown since early 2022
Key Takeaways Global Recession Probability Model Monthly Data 1970-03-31 to 2023-01-31
Global Recession Probability Model (2023-01-31 = 97.00)
High Recession Risk
100 100
95 95
90 90
• We estimate 2.4% real global GDP 85 85
growth in 2023 and assign a 65% 80
75
80
75
chance of severe global recession. 70 70
65 65
60 60
55 55
50 50
• Recession in developed economies 45 45
and a Chinese reopening present 40
35
40
35
offsetting risks. 30 30
25 25
20 20
15 15
10 10
• Global inflation has peaked but will 5 5
stay higher for longer. 0
-5 Low Recession Risk Source: Ned Davis Research, Inc.
0
-5
1972 1974 1976 1978 1980 1982 1984 1986 1988 1990 1992 1994 1996 1998 2000 2002 2004 2006 2008 2010 2012 2014 2016 2018 2020 2022
Analysis Dates: 1970-03-31 - 2023-01-31
Actual:
Probability Recession No Recession
Shaded Areas Represent OECD-Defined
Model (% of Time) (% of Time)
Global Slowdown Periods
Above 70 84.24 15.76
2022 saw global growth slow markedly, Between 30 and 70 58.21 41.79
Below 30 15.20 84.80
albeit from extremely elevated levels, amid IE90 © Copyright 2022 Ned Davis Research, Inc. Further distribution prohibited without prior
permission. All Rights Reserved. See NDR Disclaimer at www.ndr.com/copyright.html.
waning monetary and fiscal support, stub- For data vendor disclaimers refer to www.ndr.com/vendorinfo/
bornly high inflation eating into incomes,
and supply shocks emanating from the downside, and we assign a 65% chance global economy in 2023. Historically, global
Russia’s war in Ukraine and China’s ze- of severe global recession. growth rates under 2.5% have been asso-
ro-COVID policy. Indeed, we began to see ciated with severe global recession. Based
evidence of this slowdown in early 2022, Most of the downside risks that plagued on historical norms, the peak-to-trough
as our Global Recession Probability Model, 2022 will likely continue in 2023, but from decline in global equities we’ve seen this
which is designed to identify OECD-de- a much lower starting point. Global savings year has already priced in a moderate
fined global slowdowns, jumped into the have been depleted, while labor markets global slowdown. However, a severe global
high-risk zone in February (see chart). are starting to show signs of slowing. More- recession has not. This would suggest that
over, given the lagged impact of monetary if severe global recession develops, there
Global recession risk for 2023 policy on the economy, the indicators, will be more global equity volatility in 2023.
For most of the year, we have characterized many of which are already on the cusp of
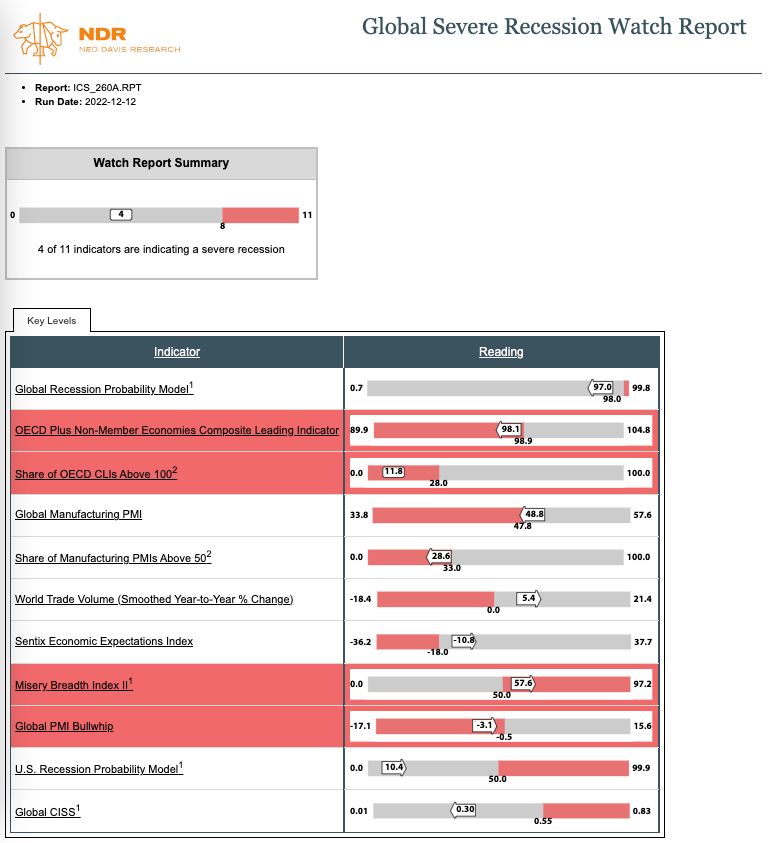
the global slowdown as being moderate, levels associated with global recession, are Our Severe Global Recession Watch
given insufficient evidence from our Severe likely to worsen in the coming months. report is showing that four out of the
Global Recession Watch report. Howev- eleven indicators are at severe recession
er, going into 2023, the risks are to the We estimate 2.4% real GDP growth in the levels. We’d like to see a firm majority
PERIODICAL | ISSUE: #SP20221214 | NDR.COM Please see important disclosures at the end of this report. DECEMBER 14, 2022 9GLOBAL OUTLOOK ECONOMICS
10 | NED DAVIS RESEARCH
before making the call. Many, including
Four out of 11 indicators are at severe recession levels
the composite PMI and PMI breadth, are
extremely close to generating negative
signals. Although the sample size is limited Source: Haver Analytics, Ned Davis Research, Inc., OECD, Main Economic Indicators
(MEI), www.oecd.org, S&P Global PMI
to just two severe recessions (GFC and
Indicators which have fallen below their key severe recession level are highlighted red.
COVID recessions), we haven’t seen more 1 A rise in this indicator indicates an increased probability of recession.
2 This indicator must be past the key recession level for three consecutive months to
than four indicators giving negative signals indicate an increased probability of recession
without imminent recession.
Global central banks have engaged in the
broadest and fastest monetary tightening
since at least the late 1990s, when our
data begins. As shown in the chart below,
since monetary policy happens with a lag,
the global economy has yet to see the
full economic impact derived from this
aggressive global tightening.
U.S. recession risk rising
Like the global economy, the risk of reces-
sion weighs on the outlook for U.S. economic
growth in 2023. We project real GDP growth
Tight global monetary policy hasn’t fully fed into the economy will end the year in a range of -0.5% to 0.5%.
Global PMI vs. Central Bank Breadth Monthly Data 1998-01-31 to 2023-11-30
Global Manufacturing PMI (Scaled Left) (2022-11-30 = 48.84) We see a 75% chance that the economy
58.0
Percent of central banks whose last rate change was a decrease (Advanced Twelve Months, Scaled Rig…(2023-11-30 = 11.8%)
100
contracts for part of 2023 and give 25%
57.0
56.0 95 odds to a soft-landing scenario. Historically,
55.0
54.0
90
severe global recessions have always been
85
53.0
80
accompanied by U.S. recession. A soft landing
52.0
51.0 75 depends on continued resilience of the labor
50.0
49.0
70
market, smooth domestic policy, and dimin-
65
48.0
47.0 60 ishing geopolitical tensions. For more details,
46.0
45.0
55 see our 2023 U.S. Outlook publication.
50
44.0
43.0 45
42.0
41.0
40 China’s COVID crisis
40.0
35
China’s economy presents the greatest un-
39.0 30
38.0 25
certainty to the global outlook. In response to
37.0
36.0
20 protests and unrest, the government has dra-
35.0
34.0
15
matically pared back its extremely restrictive
10
33.0
32.0 Source: Haver Analytics, S&P Global PMI
5 COVID protocols. As we wrote in our Novem-
1999 2000 2001 2002 2003 2004 2005 2006 2007 2008 2009 2010 2011 2012 2013 2014 2015 2016 2017 2018 2019 2020 2021 2022 2023 ber 17 publication, a clean reopening could
see a boost of 2.0-2.5 points to real GDP
Full History
Shaded Areas Represent OECD-Defined
Global Slowdown Periods
1998-01-31 to 2022-11-30 growth, which could bring growth to over 6%.
Correlation Coefficient = 0.50
IE253 © Copyright 2022 Ned Davis Research, Inc. Further distribution prohibited without prior
permission. All Rights Reserved. See NDR Disclaimer at www.ndr.com/copyright.html.
For data vendor disclaimers refer to www.ndr.com/vendorinfo/ But this goal is highly elusive. First, the easing
PERIODICAL | ISSUE: #SP20221214 | NDR.COM Please see important disclosures at the end of this report. DECEMBER 14, 2022 10U.S. FOCUS EQUITIES
11 | NED DAVIS RESEARCH
of measures must actually happen and go
An end to zero-COVID could be a boon for Chinese economy
Daily Data 2020-04-01 to 2022-12-09
COVID Indicators for China
smoothly. Given the abrupt and premature 500,000
Weekly New Cases 2022-12-09 = 233,355
500,000
450,000 450,000
nature of the reopening, there’s no guarantee. 400,000 400,000
350,000 350,000
Large swaths of the population could choose 300,000 300,000
to disengage from the economy given the 250,000
200,000
250,000
200,000
rising risk of infection and death. Also, other 150,000
100,000
150,000
100,000
elements of the economy, such as external 50,000 50,000
0 0
demand and real estate remain fragile. As a 60.0
China Markit Services PMI 2022-11-30 = 46.73
Source: Johns Hopkins University
60.0
57.5 57.5
result, we project the Chinese economy will 55.0 55.0
grow 4.25% to 4.75% in 2023. 52.5
50.0
52.5
50.0
47.5 47.5
Eurozone’s mild recession
45.0 45.0
42.5 42.5
40.0 40.0
Based on the weight of evidence presented 37.5 37.5
35.0 35.0
in our Eurozone Recession Watch report, it’s 57.5
China CFLP Services PMI 2022-11-30 = 46.70
Source: S&P Global PMI
57.5
highly likely that the economy fell into re- 55.0 55.0
cession in Q4 2022 due to the energy shock 52.5 52.5
50.0 50.0
brought by Russia’s war and tighter monetary
47.5 47.5
policy. We forecast a 0.0% to 0.5% growth rate 45.0 45.0
for the eurozone in 2023, as the recession 42.5 42.5
continues into next year. May Jul Sep Nov Jan Mar May Jul Sep Nov Jan Mar May Jul
Source: Haver Analytics
Sep Nov
2020 2021 2022
IE15254A © Copyright 2022 NDR, Inc. Further distribution prohibited without prior permission.
All Rights Reserved. See NDR Disclaimer at www.ndr.com/copyright.html
But given a starting point of low unem- For data vendor disclaimers refer to www.ndr.com/vendorinfo/
Eurozone likely already in recession ployment, a cushion of savings due to the
Monthly Data 2005-01-31 to 2022-11-30
Number of Indicators Past Key Recession Level in NDR Eurozone Recession Watch Report pandemic, and fiscal support to households
8.0
Number of Indicators Past Key Recession Level (2022-11-30 = 7)
8.0
to help combat the cost of higher food and
7.5 7.5 energy prices, we expect the recession to be
7.0 7.0 mild. The outlook, however, is uncertain and
6.5 6.5
is almost entirely driven by energy. Cold-
6.0 6.0
er-than-normal weather and an escalation in
5.5 5.5
5.0 5.0
geopolitical tensions could easily see energy
4.5 4.5 prices spike again, posing risks to the econo-
4.0 4.0 my and inflation.
3.5 3.5
3.0
2.5
3.0
2.5
Peak inflation behind us
2.0 2.0 The global inflation rate has likely carved
1.5 1.5 out a top due to waning demand and global
1.0 1.0 supply chain pressures and peak oil and food
0.5 0.5
prices. As shown in the top chart on Page 12,
0.0 0.0
-0.5 -0.5
global supply chain pressures have eased
Source: Ned Davis Research, Inc.
2006 2007 2008 2009 2010 2011 2012 2013 2014 2015 2016 2017 2018 2019 2020 2021 2022 significantly, which should continue to put
downside pressure on inflation.
Shading indicates ECRI-defined recessions
The NDR Eurozone Recession Watch Report (ICS_260_EU.RPT) includes 8 key economic indicators.
Once a majority turn negative, a recession is more likely
IE1030 © Copyright 2022 Ned Davis Research, Inc. Further distribution prohibited without prior However, inflation is likely to stay higher for
permission. All Rights Reserved. See NDR Disclaimer at www.ndr.com/copyright.html.
For data vendor disclaimers refer to www.ndr.com/vendorinfo/ longer. Continued adjustment to pandemic
PERIODICAL | ISSUE: #SP20221214 | NDR.COM Please see important disclosures at the end of this report. DECEMBER 14, 2022 11U.S. FOCUS EQUITIES
12 | NED DAVIS RESEARCH
imbalances, tight labor markets, and the Global inflation is peaking
OECD CPI vs. Global Supply Chain Pressure Index I Monthly Data 2009-01-31 to 2023-08-31
risk of further supply shocks (either geo- OECD Area CPI (Year-to-Year Change, Scaled Left)(2022-10-31 = 10.7%)
political or weather related) will likely see Global Supply Chain Pressure Index (Advanced Nine Months, Scaled Right)(2023-08-31 = 1.20)
10.5
inflation rates remain above central bank 10.0 4.0
targets through the end of 2023, indicating 9.5
9.0
3.5
pivots are unlikely in the near-term. 8.5
3.0
8.0
7.5
2.5
7.0
A quick reopening of the Chinese economy 6.5
2.0
provides upside risk to global inflation, but 6.0
5.5 1.5
likely not in the traditional consumer goods 5.0
4.5 1.0
sense. The potential upside could come 4.0
from energy prices, as consumers see an 3.5
3.0
0.5
increase in domestic mobility. 2.5 0.0
2.0
1.5 -0.5
1.0
The U.S., however, as the world’s largest 0.5 -1.0
consumer, is a much bigger player in the 0.0
-0.5
-1.5
global economy and inflation. Indeed, as -1.0
Source: Federal Reserve Bank of New York, OECD, Main Economic Indicators (MEI), www.oecd.org
-2.0
-1.5
shown in the chart at below, the U.S. CPI 2009 2010 2011 2012 2013 2014 2015 2016 2017 2018 2019 2020 2021 2022 2023
tends to lead the rest of the world by
Full History Chart View
around six months. Although we expect U.S. 1998-06-30 to 2022-10-31 2009-01-31 to 2023-08-31
Correlation Coefficient = 0.61 Correlation Coefficient = 0.83
inflation to ease, it too is likely to remain IE770 © Copyright 2022 Ned Davis Research, Inc. Further distribution prohibited without prior
permission. All Rights Reserved. See NDR Disclaimer at www.ndr.com/copyright.html.
above the Fed’s target by the end of 2023. For data vendor disclaimers refer to www.ndr.com/vendorinfo/
U.S. inflation usually leads the rest of the world The jury is still out as to whether we’re
Global ex U.S. CPI vs. U.S. CPI Monthly Data 1981-02-28 to 2023-04-30
Global ex U.S. CPI (Year-to-Year Change, Scaled Left)(2022-09-30 = 7.3%) entering a new high-inflation regime in the
21.0
U.S. CPI (Year-to-Year Change, Advanced Six Months, Scaled Right)(2023-04-30 = 7.7%)
21.0 long-term. Prior to pandemic, most devel-
20.0
19.0
20.0
19.0
oped economies were experiencing strong
18.0
17.0
18.0
17.0
disinflationary trends. Many of those
16.0 16.0 secular disinflationary factors, including
15.0 15.0
14.0 14.0 technology, demographics, and high private
13.0
12.0
13.0
12.0
debt and inequality, remain intact.
11.0 11.0
10.0 10.0
9.0 9.0 Other influences that were disinflationary
8.0 8.0
7.0 7.0 prior to the pandemic are at risk of disinte-
6.0
5.0
6.0
5.0
grating. Globalization is one factor. Remov-
4.0 4.0 ing Russia as an energy source to the West
3.0 3.0
2.0 2.0 is an obvious change. The rise of tariffs,
1.0 1.0
0.0 0.0 protectionist policies, and onshoring may
-1.0
-2.0
-1.0
-2.0
also contribute to long-term inflation. The
-3.0
Source: Bureau of Labor Statistics, Haver Analytics
-3.0 biggest risk, however, is inflation expec-
-4.0 -4.0
1982 1984 1986 1988 1990 1992 1994 1996 1998 2000 2002 2004 2006 2008 2010 2012 2014 2016 2018 2020 2022 tations becoming unanchored. If inflation
Full History
stays higher for longer, inflation expec-
1981-02-28 to 2022-09-30
Correlation Coefficient = 0.61
tations could turn permanently higher,
IE708 © Copyright 2022 Ned Davis Research, Inc. Further distribution prohibited without prior becoming a self-fulfilling prophecy.
permission. All Rights Reserved. See NDR Disclaimer at www.ndr.com/copyright.html.
For data vendor disclaimers refer to www.ndr.com/vendorinfo/
PERIODICAL | ISSUE: #SP20221214 | NDR.COM Please see important disclosures at the end of this report. DECEMBER 14, 2022 12GLOBAL OUTLOOK EQUITIES
M A R K P H I L L I P S E U R O P E A N E Q U I T Y S T R AT E G I S T
DECEMBER 14, 2022 email us
European equities
A better year, but risks remain
Technical indicators positive
Key Takeaways MSCI Europe vs. Pattern Matched Composite
30
MSCI Europe
25
MSCI Europe Pattern Matched Composite
2022-12-09
• Bullish technical indicators suggest
20
risk appetite could continue into
the start of 2023. 15
10
• But the full impact of central
5
bank tightening on the European
0
economy and falling earnings could
result in choppy markets as 2023 -5
progresses. -10
-15
• Falling inflation and yields, and an
improvement in the outlook for -20
Pattern matched composite based on 10 closest matches
to path of MSCI Europe price index in last year
economic growth, could pave the -25 according to NDR's euclidian matching algorithm
based on over 50 years of price data.
way to a strong year end. -30 Shading shows maximum loss and gain.
-35
-40
Inflation and growth shocks Jan Feb Mar Apr May Jun Jul Aug Sep Oct Nov Dec Jan Feb Mar Apr May Jun Jul Aug Sep
Source: MSCI
Oct Nov Dec
2022 2023
As this year draws to a close, many PUB_CHARTS © Copyright 2022 NDR, Inc. Further distribution prohibited without prior permission.
All Rights Reserved. See NDR Disclaimer at www.ndr.com/copyright.html
investors will be happy to see the back For data vendor disclaimers refer to www.ndr.com/vendorinfo/
of 2022. It is fair to say that European
economic growth and inflation have been inflation stands at 10%. The MRO rate has An inflation shock, a sharp deterioration
worse than most economists predicted at been raised to 2% and the futures market is in the outlook for economic growth, and
the end of 2021. pricing another 75 bps in rate rises by the rapidly tightening monetary policy has
first quarter of 2023. Lagarde last month provided a confluence of factors driving
At the end of 2021 the average economist stated that the bank was still in “highly down asset prices across European
surveyed in the ECB’s Survey of accommodative territory”. equities and fixed income this year. The
Professional Forecasters was predicting MSCI Europe index fell 21% from January to
eurozone growth of 4.5% and inflation at Moreover, the ECB will continue to tighten September and is down 10% year-to-date.
1.9% for 2022. And ECB president Christine even as the eurozone has most likely In inflation-adjusted terms, these numbers
Lagarde stated that the bank was very entered a recession this quarter, as the are significantly worse at 27% and 17%.
unlikely to raise interest rates in 2022, Russian invasion of Ukraine has resulted in
keeping the main refinancing operations spiralling energy and food costs on top of
(MRO) rate at 0%. the inflationary pressures which followed
the lockdowns and unprecedented fiscal
Fast forward one year, and eurozone and monetary stimulus.
PERIODICAL | ISSUE: #SP20221214 | NDR.COM Please see important disclosures at the end of this report. DECEMBER 14, 2022 13U.S. FOCUS EQUITIES
14 | NED DAVIS RESEARCH
Early signs of hope Economic nadir in sight
MSCI Europe vs. OECD Europe CLI Momentum and Acceleration Daily Data 1969-12-31 to 2022-12-09
With leading economic indicators still MSCI Europe Price Index (EUR) (2022-12-09 = 2,654.55)
deteriorating and the ECB set to tighten into 2,512 2,512
the first quarter of next year, the macro- 1,585
1,000
1,585
1,000
economic regime remains challenging for 631
398
631
398
equities as we move into 2023. 251 251
158 158
100 100
63 Source: MSCI, OECD, Main Economic Indicators (MEI), www.oecd.org 63
But since September, European equities Q/Q Point Change in Q/Q Point Change in CLI(2022-11-30 = 0.51)
have staged a strong rally, triggering several OECD Europe Composite Leading Indicator (2022-11-30 = -2.39)
Q/Q Point Change in CLI (2022-11-30 = -0.58)
bullish technical signals. The chart on Page
14 illustrates that similar recoveries have 10 10
2 2
tended to be followed by a year of robust
0 0
equity returns. Confirmation of returning risk
-2 -2
appetite has also come from other sources,
-10 -10
such as cyclical industry relative strength,
1970 1975 1980 1985 1990 1995 2000 2005 2010 2015 2020
small-cap relative strength, and falling risk
indicators. MSCI Europe (EUR)
MSCI Europe Next Period Returns
1969-12-31 to 2022-12-09
1969-12-31 to 2022-12-09
Arrows show buy signals. % Gain/ % of
Buy signal when CLI negative and falling, Europe CLI Annum Time Buy signal 3-Months 6-Months 12-Months
Further, economic data has been surprising but rate of fall is decelerating.
Statistics apply reporting lag.
Rising + Accelerating
Rising + Decelerating
15.40 29.73
0.45 21.90
Average 3.5 6.8 15.6
Percent Positive 72.0 79.2 75.0
to the upside as economists became Falling + Accelerating -0.94 31.34
* Falling + Decelerating 13.31 17.03
Average All Periods 1.9 3.9 8.2
too pessimistic as to the outlook for EUR_CLI2 © Copyright 2022 Ned Davis Research, Inc. Further distribution prohibited without prior
permission. All Rights Reserved. See NDR Disclaimer at www.ndr.com/copyright.html.
the eurozone economy, and surveys of For data vendor disclaimers refer to www.ndr.com/vendorinfo/
Market ahead of itself? economic sentiment have improved from
Daily Data 2021-09-30 to 2023-09-28
Inflation, Interest Rates and Yields Around Recessionary Bear Market Bottoms record lows.
11 Eurozone Y/Y CPI % Change (LHS) (2022-11-30 = 10.02%) Recessionary Bear Market Average (RHS)
3.25
10
Average = mean around the 7 previous
9 recessionary bear market bottoms since 1970 3.00 Leading indicators also point to an
8 1975-01-02, 1981-09-28, 1992-08-25, 2001-09-21,
7
2009-03-09, 2011-09-22, and 2020-03-18. 2.75 economic outlook that while deteriorating,
6 2.50 is doing so at a slower pace, pointing to a
5 German CPI before 1991.
4 2.25 potential upturn in leading indicators early
MSCI Europe 2022 / Bear Market Low
3 Source: MSCI, Economist Magazine, Haver Analytics in 2023 (above), in line with a growing
ECB Main Refinancing Rate (LHS) (2022-12-09 = 2.00%) Recessionary Bear Market Average (RHS)
2.5
4.25 consensus that the eurozone economy will
2.0 4.00 experience a relatively short and shallow
1.5 3.75 recession and return to growth later in 2023.
German data before 1999.
1.0
3.50
0.5
3.25 Risks remain
0.0
Source: European Central Bank, www.ecb.int
5.1
On balance, we expect 2023 to be a choppy
2.5 10-Year German Bond Yield (LHS) (2022-12-09 = 1.93%) Recessionary Bear Market Average (RHS)
2.0
5.0
4.9
year, not least because the market may be
Long-term bond yield before 1990. 4.8
1.5 4.7 discounting too much good news too early.
4.6
1.0 4.5 In the past, inflation, interest rates and
4.4
0.5 4.3 yields have tended to fall before a sustained
4.2
0.0 4.1
4.0
recovery in equities has gotten underway
-0.5 Source: Bloomberg Finance L.P., International Monetary Fund, International Financial Statistics
Oct Nov Dec Jan Feb Mar Apr May Jun Jul Aug Sep Oct Nov Dec Jan Feb Mar Apr May Jun Jul Aug Sep Oct
3.9
(left). And while there are some signs that
2022 2023
SP20221214B_C © Copyright 2022 NDR, Inc. Further distribution prohibited without prior permission.
All Rights Reserved. See NDR Disclaimer at www.ndr.com/copyright.html
yields and inflation have peaked, never
For data vendor disclaimers refer to www.ndr.com/vendorinfo/
has a European recessionary bear market
PERIODICAL | ISSUE: #SP20221214 | NDR.COM Please see important disclosures at the end of this report. DECEMBER 14, 2022 14U.S. FOCUS EQUITIES
15 | NED DAVIS RESEARCH
bottomed before the central bank has market in the second half of 2023. stocks since the sector became excessively
finished raising rates. oversold in May. European consumer
Sectors confidence has improved from record lows,
As Chief Economist Alejandra Grindal notes, Our broad market outlook also informs our and with disinflation likely in 2023 this could
Europe could easily see energy prices spike allocation to equity sectors. In line with provide a further tailwind.
again, posing risks to both the economy our broad market indicators, our sector
and inflation, pressuring the ECB to keep indicators point to a moderate tactical tilt A reopening of the Chinese economy during
monetary policy tight. toward Cyclical over Defensive sectors. 2023 could also provide a positive boost to
the sector which derives a high percentage
Secondly, analysis of past recessions shows However, given the intermediate term risks of sales from Asia and Asian tourism.
earnings on average fall around 20% per we would caution against becoming overly
annum for nearly two years (below). With aggressive in allocating to Cyclical sectors. Among the Defensive sectors, we prefer the
analysts forecasting 3% earnings growth for Therefore, a more nuanced approach will Consumer Staples and Health Care sectors,
the MSCI Europe index over the next year, make sense in 2023. due to a history of higher profitability
a potential fall in earnings is a major risk to and stronger returns on invested capital.
European equities. We still see value and positive underlying Conversely, we would underweight the
trends in the Energy and Materials sectors Communication Services sector, which has
Therefore, equities could be volatile until we with our commodity-based indicators seen a long-term decline in relative earnings
see clear evidence that interest rates have supportive. due to competition, regulation, and high
peaked, and that inflation and yields are capex requirements.
falling. Potentially this could occur later in We also see potential for further
the year and pave the way to a strong equity outperformance by Consumer Discretionary
Earnings risk
MSCI Europe Earnings Decline Around Recessions Monthly Data 1969-12-31 to 2023-11-30 (Log Scale)
Interested in
126 MSCI Europe Trailing 12-Month Earnings per Share (EUR) 126
100
EPS after 2022-11-30 based on forecast earnings.
Shading from September 2022 to March 2023 based on forecast.
100 customizing these
79 79
63
50
63
50
insights?
40 40
32 32
25 25
20
16
20
16
Learn more
13
10
Dark shading represents CEPR-defined recessions.
Light shading from March to December 2001 represents period
when both Germany and Italy were in recession.
13
10
about our
Custom Research
and eurozone real economic growth was near zero.
8 8
6 6
4
Source: MSCI
4
Solutions
1970 1975 1980 1985 1990 1995 2000 2005 2010 2015 2020
MSCI Europe Earnings Declines Around Recessions
Recession Earnings Total Decline Annualized
Recession End Earnings Peak # Months
Start Trough (%) Decline (%)
1974-09-30 1975-03-31 1974-11-29 1976-04-30 17.0 -37.2 -28.0
1980-03-31 1982-09-30 1981-01-30 1982-01-29 12.0 -29.3 -29.4
1992-03-31 1993-09-30 1990-07-31 1993-05-31 34.0 -39.7 -16.4
2001-03-31 2001-12-31 2001-05-31 2003-05-30 24.0 -47.4 -27.5
2008-03-31 2009-06-30 2008-01-31 2009-12-31 23.0 -50.9 -31.0
2011-09-30 2013-03-31 2011-11-30 2013-12-31 25.0 -14.4 -7.2
2019-12-31 2020-06-30 2019-04-30 2021-04-30 24.0 -35.5 -19.7
www.ndr.com/custom-
Average 22.7 -36.4 -22.7
SP20221214C_C © Copyright 2022 NDR, Inc. Further distribution prohibited without prior permission.
All Rights Reserved. See NDR Disclaimer at www.ndr.com/copyright.html
research-solutions
For data vendor disclaimers refer to www.ndr.com/vendorinfo/
PERIODICAL | ISSUE: #SP20221214 | NDR.COM Please see important disclosures at the end of this report. DECEMBER 14, 2022 15SPECIAL REPORT GLOBAL OUTLOOK
NDR HOUSE VIEWS (Updated December 9 , 2022)
For global asset allocation, NDR recommends an overweight Economic Summary December 12, 2022
allocation to stocks, marketweight allocation to bonds, and an
Near term activity: Accelerating Neutral Decelerating
underweight allocation to cash. Our overweight equity
allocation is in response to improving model readings and a
shift in Fed rate hike expectations.
Global Economy U.S. Economy U.S. Inflation
(2.9%) (1.5%-2.0%) (4.0%-4.5%)
Economic gauges reflect changes in near-term economic activity. Numbers in parenthesis
Equity Allocation refer to NDR 2022 forecasts.
U.S. | We are neutral on stocks on an absolute basis and
Global Asset Allocation
relative to bonds and cash. Macro and earnings concerns are Overweight Marketweight Underweight
offset by extreme pessimism and technical improvements. We Stocks (65%)
favor small-caps over large-caps and Value over Growth. Bonds (35%)
Cash (0%)
INTERNATIONAL | We are overweight Europe ex. U.K. and Benchmark: Stocks (55%), Bonds (35%), Cash (10%)
marketweight on all other regions.
Equities — Regional Relative Allocation
Europe ex. U.K. (14%)
U.S. (61%) | Emerging Markets (11%) | Japan (5%) | U.K. (4%) |
Macro Pacific ex. Japan (2%) | Canada (3%)
ECONOMY | The global economy is in a sustained slowdown
Benchmark – U.S. (61.5%), Europe ex. U.K. (12%), Emerging Markets (11.2%), Japan (5.4%),
due to waning monetary and fiscal support, stubbornly high U.K. (3.8%), Pacific ex. Japan (3%), Canada (3.1%)
inflation, and rising geopolitical risk. While the slowdown
Global Bond Allocation
remains moderate, the risk of severe recession increases in
Europe (28%)
2023. Global inflation pressures are easing but will remain U.S. (55%) | Japan (14%)
historically elevated in the foreseeable future. U.K. (3%)
Benchmark: U.S. (55%), Europe (26%), Japan (14%), U.K. (5%)
FIXED INCOME | We raised our bond exposure to 100% of
U.S. Allocation
benchmark duration and are neutral on the yield curve. We Small-Cap | Value
are overweight Treasurys and MBS and underweight high Stocks (55%) | Bonds (35%) | Cash (10%) | Mid-Cap
yield, ABS and TIPS. We are marketweight everything else. Large-Cap | Growth
Benchmark: Stocks (55%), Bonds (35%), Cash (10%)
GOLD | We are currently bullish. The majority of our Gold Sectors
Health Care (17%) | Energy (5%) | Materials (4%)
Watch report indicators are now bullish and gold stands to
Consumer Discretionary (8%)
benefit from seasonality and declining bond yields. Benchmark: Technology (27.4%), Health Care (13.8%), Financials (10.7%), Communication
Services (9.3%), Consumer Discretionary (12.1%), Consumer Staples (7.0%), Industrials
(7.9%), Energy (4.0%), Utilities (2.7%), Real Estate (2.7%), Materials (2.5%)
DOLLAR | We are bearish due to worsening momentum and
model readings. U.S. Bonds — 100% of Benchmark Duration
PERIODICAL | ISSUE: #SP20221214 | NDR.COM Please see important disclosures at the end of this report. DECEMBER 14, 2022 16You can also read