2022 State of the EU ETS Report - Andrei Marcu, Juan Fernando López Hernández, Emilie Alberola, Anouk Faure, Bo Qin, Mariko O'Neill, Stefan ...
←
→
Page content transcription
If your browser does not render page correctly, please read the page content below
2022 State of the EU ETS Report

                                                             The Library Company of Philadelphia

Andrei Marcu, Juan Fernando López Hernández, Emilie Alberola, Anouk Faure, Bo Qin,
 Mariko O’Neill, Stefan Schleicher, Jean-Yves Caneill, Elena Bonfiglio, Anita Vollmer
Disclaimer
The views expressed in this Paper are attributable only to the authors in a personal capacity,
and not to any institution, which they are associated with, or to the funders of the Paper.
This Paper has been the subject of stakeholder consultations, including a workshop convened
by the authors with stakeholders including NGOs, think tanks, academia, policy makers,
market participants and representatives of industry.

A grant to produce this report was provided by the French Ministry of Ecological and Solidary
Transition. The authors thank them for their continued support for this report.

The European Roundtable on Climate Change and Sustainable Transition (ERCST) is a Brussels-based think-tank
incorporated as non-profit organisation under Belgian law. ERCST provides rigorous intellectual analysis of EU
and international climate change developments and policies, by using the experience and research of its staff, as
well input from stakeholders who participate in its activities. ERCST provides original ideas and research into
European and international debates on climate change policy. It represents its own views and strives to ensure
in a very strict way its independence and integrity.

BloombergNEF (BNEF) is a strategic research provider covering global commodity markets and the disruptive
technologies driving the transition to a low-carbon economy. Our expert coverage assesses pathways for the
power, transport, industry, buildings and agriculture sectors to adapt to the energy transition. We help
commodity trading, corporate strategy, finance and policy professionals navigate change and generate
opportunities.

The Wegener Center for Climate and Global Change is an interdisciplinary, internationally oriented institute of
the University of Graz, which serves as a core research center for pooling the competences of the University in
the areas of climate change and the related issues in climate physics, meteorology, and economics. An evidence-
based approach to the transformation of energy systems, innovative analytical modelling concepts, and the
design of energy and climate policies are focal points of current research activities.

EcoAct is an international advisory consultancy and project developer created in 2005, which joined the Atos
Group in 2020. EcoAct works with clients to meet the demands of climate change. We work with many large and
complex multinational organisations to offer solutions to their sustainability challenges.

                                                                                                               II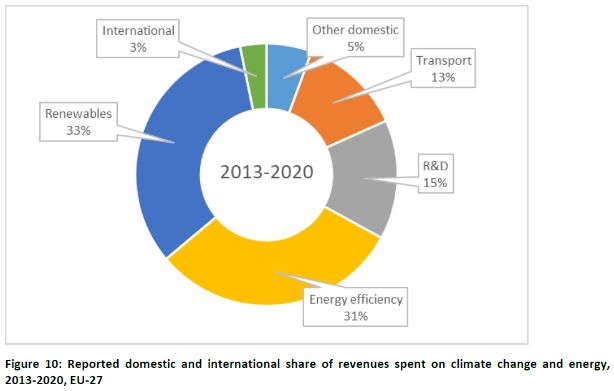
2022 State of the EU ETS Report
                                                  Table of Contents

Key Takeaways............................................................................................... 1
1. Background .............................................................................................. 2
2. An EU ETS “fit for purpose” ...................................................................... 3
3. Phase 3: a comprehensive analysis ........................................................... 5
  3.1.    The recovery Phase of the EU ETS ...............................................................................5
  3.2.    Climate delivery ...........................................................................................................5
  3.3.    Economic delivery ........................................................................................................6
4. Regulatory developments ...................................................................... 10
  4.1.    EU developments.......................................................................................................10
  4.2.    International carbon price developments .................................................................13
5. Market Sentiment Survey ....................................................................... 15
6. Environmental delivery .......................................................................... 17
  6.1.    Delivery against Phase 4 target ................................................................................17
  6.2.    Delivery against EU long-term domestic environmental commitments ....................20
7. Socio-economic delivery......................................................................... 20
  7.1.    Is the EU ETS a driver for change? .............................................................................21
  7.2.    Social impacts ............................................................................................................22
  7.3.    Industrial decarbonization ........................................................................................23
  7.4.    Innovation .................................................................................................................25
  7.5.    Carbon Leakage .........................................................................................................26
8. Market functioning ................................................................................ 28
  8.1.    Market functioning trackers ......................................................................................28
  8.2.    Supply-demand balance and evolution of TNAC .......................................................32
  8.3.    Price forecasts ...........................................................................................................33
  8.4.    Market participation .................................................................................................33

                                                                                                                                     III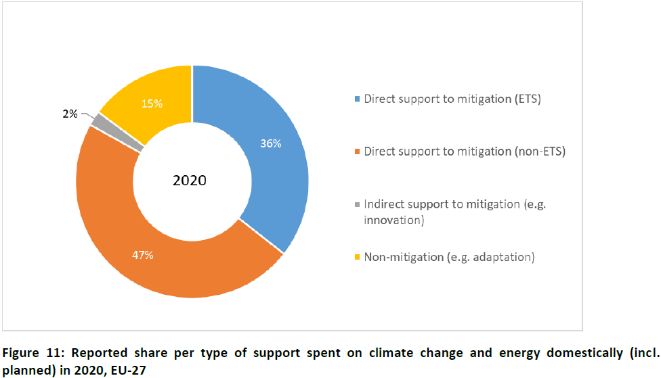
List of Figures
FIGURE 1: TIME SERIES OF VERIFIED EMISSIONS BY ETS SECTOR. ............................................................................................ 5
FIGURE 2: ANNUAL AND CUMULATIVE ALLOWANCE SURPLUS, ALL STATIONARY INSTALLATIONS EXCEPT COMBUSTION. ...................... 6
FIGURE 3: COST OF GREENHOUSE GAS EMISSIONS (€/TCO2E). ............................................................................................. 8
FIGURE 4: SHARE OF AUCTION REVENUES EARMARKED FOR CLIMATE PURPOSES, 2013-2020, EU-27. ......................................... 8
FIGURE 5: AUCTIONING REVENUES AND REPORTED USAGE (€ BN), 2013-2020, EU-27. ........................................................... 9
FIGURE 6: SELF-REPORTED USE OF ETS AUCTIONING REVENUES SPENT ON ............................................................................... 9
FIGURE 7: TIMELINE OF THE SECONDARY LEGISLATION RELATED TO THE EU ETS. .................................................................... 11
FIGURE 8: HISTORICAL EVOLUTION OF UK AND EU ALLOWANCE FUTURES. ............................................................................ 14
FIGURE 9: MARKET SENTIMENT SURVEY - RESULTS ........................................................................................................... 15
FIGURE 10: PROJECTED EMISSIONS AND TARGET PATHS FOR PHASE 4 IN THE COMBUSTIONS AND INDUSTRY SECTORS (A) AND IN THE
     ALLOWANCE ALLOCATION METHODS (B). ................................................................................................................ 18
FIGURE 11: TOTAL NUMBER OF ALLOWANCES IN CIRCULATION (TNAC) AND EU CARBON PRICE. ............................................... 19
FIGURE 12: POSSIBLE LONG-TERM TARGET PATHS FOR EU ETS AFTER 2030. ........................................................................ 20
FIGURE 13: DRIVERS OF GHG EMISSIONS VARIATIONS IN THE POWER SECTOR IN THE EU (2013-2020). .................................... 21
FIGURE 14: ANNUAL DRIVERS OF EMISSIONS VARIATIONS IN THE POWER SECTOR IN THE EU (2003-2020). ................................ 21
FIGURE 15: COAL AND GAS-FIRED POWER GENERATION IN THE EU27 PLUS THE UK SINCE JANUARY 2018. ................................. 22
FIGURE 16: STRUCTURE AND EMISSIONS FROM POWER GENERATION. ................................................................................... 22
FIGURE 17: EMISSIONS INTENSITIES IN SELECTED INDUSTRY SECTORS. ................................................................................... 24
FIGURE 18: NET COSTS OF ALLOWANCES. ....................................................................................................................... 24
FIGURE 19: CUMULATIVE BALANCE OF ALLOWANCES. ........................................................................................................ 25
FIGURE 20: HIGH-END ESTIMATION OF INDIRECT COSTS FOR FOUR SECTORS EXPOSED TO CARBON LEAKAGE DUE TO INDIRECT EMISSION
     COSTS (MILLION EUROS). ..................................................................................................................................... 27
FIGURE 21: TRADED EUA VOLUMES. ............................................................................................................................. 29
FIGURE 22: AGGREGATE OPEN INTEREST SEASONALITY. ..................................................................................................... 29
FIGURE 23: MONTHLY AVERAGE AUCTION PARTICIPATION. ................................................................................................. 30
FIGURE 24: EU ETS AUCTION COVERAGE RATIO. .............................................................................................................. 30
FIGURE 25: MONTHLY AVERAGE DIFFERENCE BETWEEN AUCTION AND SPOT PRICE. ................................................................. 30
FIGURE 26: COST OF CARRY – EUA VERSUS AAA EU 5-YEAR BONDS. .................................................................................. 31
FIGURE 27: ASK-BID SPREAD ON ICE.............................................................................................................................. 31
FIGURE 28: VOLATILITY. .............................................................................................................................................. 31
FIGURE 29: EU ETS ARTICLE 29A COST CONTAINMENT MECHANISM TRIGGER PRICES FOR EACH SIX-MONTH PERIOD. .................... 32
FIGURE 30: SUPPLY AND DEMAND OF EUAS AND TNAC. .................................................................................................. 32
FIGURE 31: EUA PRICE FORECASTS. ............................................................................................................................... 33
FIGURE 32: NET POSITION HOLDERS. ............................................................................................................................. 34
FIGURE 33: INVESTMENT FUNDS’ NET POSITIONS. ............................................................................................................. 34

                                                                                                                                                                    IV
List of Tables
TABLE 1: YEARLY ALLOWANCE SURPLUS (GREEN) AND DEFICIT (RED) IN PHASE 3 BY ETS SECTOR, IN PERCENTAGE OF THE SECTOR'S
VERIFIED EMISSIONS. ............................................................................................................................................ 7
TABLE 2: ESTIMATED PURCHASES OF ALLOWANCES IN PHASE 3 BY ETS SECTOR TAKING INTO ACCOUNT ALLOWANCE BANKING SINCE
2013, IN PERCENTAGE OF SECTOR'S VERIFIED EMISSIONS............................................................................................. 7
TABLE 3: BREAKDOWN OF ALLOWANCES USED BY EU AND SWISS ETS INSTALLATIONS FOR COMPLIANCE IN 2020. ........................ 14
TABLE 4: INDIRECT CARBON COST COMPENSATION PAID OUT BY EU MEMBER STATES AND THE UK IN 2020................................ 27
TABLE 5: MARKET FUNCTIONING TRACKER. .......................................................................................................... 28
List of Abbreviations
CA Corresponding adjustment (under Article 6)
CBAM Carbon Border Adjustment Mechanism
CCU Carbon capture and utilization
Commission European Commission
COP26 The 26th UN Climate Change Conference of the Parties
CORSIA Carbon Offsetting and Reduction Scheme for International Aviation
CRC-M Carbon Removal Certification Mechanism
EEA European Economic Area
EEX European Energy Exchange
EGD European Green Deal
ESMA European Securities and Markets Authority
ETS Emissions Trading System
EUA EU emission allowances
GHG Greenhouse gas
GST Global stocktake (of the Paris Agreement)
IMF International Monetary Fund
IMO International Maritime Organization
KPI Key Performance Indicator
LRF Linear Reduction Factor
MSR Market Stability Reserve
NIMs National Implementation Measures
OMGE Overall Mitigation in Global Emissions
REDD+ Reducing Emissions from Deforestation and Forest Degradation
SOP Share of proceeds
TNAC Total number of allowances in circulation
UKA UK emission allowances
V2022 State of the EU ETS Report
Key Takeaways
• This report marks the beginning of Phase 4 of the European Union’s Emissions Trading System (EU ETS),
which started in 2021 and is marked by debates in line with a new climate ambition target. The European
Climate Law is providing a new reality to become net zero by 2050. However, the EU ETS debate may
not be as visible as in the past since other elements of the Fit for 55 package such as the CBAM, have
become the focus of attention. ERCST would argue that the focus must remain on the EU ETS.
• The year 2021 was not only marked by a period of completing secondary legislation coming from the
revision of the EU ETS Directive in 2018 but has also brought a proposal from the Commission to revise
the current framework. The new rules are expected to apply from 2023, pending the success or failure
of the upcoming negotiation process between the European Parliament and Council.
• While some elements are still at stake, Phase 4 of the EU ETS is the first one without UK installations.
The need to achieve a worldwide climate compromise and the recent discussions in international forums
(i.e., COP 26) has showed the need to further envisage the role of the EU ETS and international carbon
markets, aiming for potential links under Article 6 of the Paris Agreement.
• In 2021, ahead of the Commission proposal to revise the EU ETS Directive, presented in July 2021, the
stakeholder community looked optimistic about the possibilities of the EU ETS embracing the climate
goal. Nevertheless, the annual market sentiment survey shows some questioning of the role of the EU
ETS in some areas. Still, stakeholders consider the EU ETS as the pillar of the EU climate policy and as
one of the best, if not the best, of the instruments to drive decarbonisation.
• Following the previous year’s reports, this report shows the dynamics of emissions in different sectors.
Estimates based on preliminary data indicate a 9.1% increase of total emissions in 2021 compared to
2020. Still, the dip in emissions caused by lower economic activity due to the COVID-19 crisis in 2020
had not yet been overcome in 2021.
• We cannot disregard that last year the EU was impacted by an unprecedent increase in energy prices.
The discussion has also been revolved around the relationship between the energy and the carbon
market and the increased high volatility of carbon prices. The role of speculators and the different
treatment of compliance entitles, for which the EU ETS is a compromise to achieve efficient
decarbonisation rather than an opportunity to obtain profits, has raised questions about the current
provisions to address excessive market price fluctuations, and the need to include these considerations
in the EU ETS review.
• Finally, some see this as the time to start exploring the role of the EU ETS post 2030.
11. Background
This “State of the EU ETS” Report is an independent effort which is not intended to duplicate or replace
mandated work undertaken by the Commission. It focuses on identifying issues and assessing the
performance of the EU ETS at the time when the report is produced.
This report is intended as a “snapshot”, providing policymakers and stakeholders with an overview of how
the EU ETS is doing by April of each year, based on previous year data. Within the constraints posed by the
availability of publicly accessible data, the Report tries to assess the question of whether the EU ETS is “fit
for purpose”.
As background, following the completion of the review of the EU ETS in early 20181 many stakeholders
assumed that the EU ETS was “fit for purpose” until 2030. However, much has happened since then. The
European Green Deal (EGD)2 and the endorsement of the climate neutrality objective by the European
Council3 in late 2019 has put us on a very different path. Subsequently, the European Climate Law was
passed, which provides the legal basis for the EU’s economy and society to reduce (net) Greenhouse Gas
(GHG) emissions by 55% (vs 1990) by 2030 and achieve (net) climate neutrality by 2050.
Today, we are in the middle of a new review process, not only for the EU ETS, but for all climate and energy
policies as part of the “Fit for 55” package, which was adopted by the Commission on July 14th, 20214. The
European Parliament and Council are currently defining their own positions, which are expected to be
adopted before the summer. The negotiations between the EU institutions, so-called “trilogues”5, on the
final form of the revised EU ETS are expected to begin in September under the Czech Republic Presidency
of the EU Council.
The aim is to have the revised EU ETS in place in 2023, the year of the first global stocktake of the Paris
Agreement (GST). The global stocktake is a process envisioned in Article 14 of the Agreement and aims to
assess the collective progress of countries towards achieving the goals set out in the Paris Agreement6.
Article 30(3) of the EU ETS Directive mandates the Commission to report to the European Parliament and
to the Council in the context of each global stocktake agreed under the Paris Agreement about the need for
additional Union policies and measures to achieve the full implementation of the Paris Agreement by
Member States7.
As part of the Fit for 55 Package, the Commission set out a new target for the sectors covered by the EU
ETS: reducing emissions by 61% (vs 2005 levels) by 2030, compared to the previous target of 43%. To
achieve this new target, a tightening of current ETS parameters is envisioned, including a lowering of the
cap and a reduction in the provision of free allowances. In addition to these measures, the Commission has
proposed the so-called "ETS 2”, which would introduce an ETS for road transport and buildings starting in
2026. This proposal has led to a heated debate in the European Parliament and Council where opinions
1 Directive (EU) 2018/410. Available at: https://eur-lex.europa.eu/legal-content/EN/TXT/PDF/?uri=CELEX:32018L0410&from=EN (Accessed
on 12 April 2022).
2 European Commission (2019). The European Green Deal. COM (2019) 640 final. Available at:
https://ec.europa.eu/info/sites/info/files/european-green-deal-communication_en.pdf (Accessed on 12 April 2022).
3 European Council (2019). European Council meeting (12 December 2019) – Conclusions EUCO 29/19. Available at:
https://www.consilium.europa.eu/media/41768/12-euco-final-conclusions-en.pdf (Accessed on 12 April 2022).
4 European Commission (2021). ‘Fit for 55’: delivering the EU’s Climate Target on the way to climate neutrality. COM (2021) 550 final. Available
at: https://eur-lex.europa.eu/legal-content/EN/TXT/PDF/?uri=CELEX:52021DC0550&from=EN (Accessed on 12 April 2022)
5 Trilogues are “informal tripartite meetings on legislative proposals between representatives of the Parliament, the Council and the
Commission. Their purpose is to reach a provisional agreement on a text acceptable to both the Council and the Parliament”. European
Parliament. (n.d.). “Interinstitutional negotiations”. Available at: https://www.europarl.europa.eu/olp/en/interinstitutional-negotiations
(Accessed on 13 April 2022)
6 UNFCCC (n.d.) “Global Stocktake”. Available at: https://unfccc.int/topics/global-stocktake (Accessed on April 11, 2022)
7Directive (EU) 2003/87. Available at: https://eur-lex.europa.eu/legal-content/EN/TXT/?uri=celex%3A32003L0087 (Accessed on 13 April
2022)
2continue to be divided. Chapter 4 will provide a detailed overview of the different elements of the “Fit for
55” package as they apply to the EU ETS.
Moreover, in 2020 the measures put in place to address COVID-19 and the developments in Ukraine have
impacted the EU ETS and Europe has experienced a dramatic increase in both carbon and energy prices.
The Commission published the ‘Energy Prices Toolbox’ in October8 outlining available measures to address
prices. This will be discussed in Chapter 6.
2021 is also a year marked by the 26th UN Climate Change Conference of the Parties (COP26) in Glasgow,
which was postponed from November 2020 to November 2021 due to the Covid-19 pandemic. The results
of the COP26 negotiations emphasized continued global agreement to keep global warming as close as
possible to no more than 1.5°C above pre-industrial levels, as well as an agreement on the Article 6
Rulebook. This could sway the EU to take a more internationalist approach for the EU ETS.
Finally, the EU ETS does not exist in a vacuum. It should not be compared to an ideal world, but to real
options that are available to address climate change.
The EU ETS and EU climate policy are put in place to decarbonize the EU while ensuring that the outcome
is a prosperous and industrial Europe. The EU ETS operates in a highly interconnected environment and is
affected by climate change and other policies at different levels: global, EU, EU Member State, and sub-
national jurisdictions. It must live with that reality and respond to it.
2. An EU ETS “fit for purpose”
To assess whether the EU ETS is “fit for purpose”, we first need to identify the parameters which measure
its success. Simply put, “what do we expect the EU ETS to deliver?”. Indicators have emerged gradually, as
experience is gained with these mechanisms, both in the EU, but also around the world. Experience from
other, non-carbon, markets may also provide benchmarks for success. Nevertheless, some of these
assessments will have a level of subjectivity and judgement (sometimes political) attached to them.
In this context, we need to remind ourselves that Article 1 of the EU ETS Directive9 outlines its broad
objectives:
“This Directive establishes a scheme for greenhouse gas emission allowance trading within the
Community in order to promote reductions of greenhouse gas emissions in a cost-effective and
economically efficient manner. This Directive also provides for the reductions of greenhouse
gas emissions to be increased so as to contribute to the levels of reductions that are considered
scientifically necessary to avoid dangerous climate change.”
Some objectives are clearly enunciated and identified, while some stakeholders may see other objectives
as implicit. The direct deliverables assessed by this report include:
1. Environmental delivery. Does it deliver against absolute environmental targets?
2. Socio-economic delivery. Does it deliver macro-economic efficiency and cost effectiveness for
compliance? Does it provide effective, and proportional, protection against the risk of carbon
leakage? Is it a driver for change? Does it ensure a just transition?
3. Market functioning. The ETS, which is a regulatory market, should only be the instrument of choice
if it functions well and leads to good price discovery.
Over time, other deliverables or indicators have come to be “expected” or “understood”. Some have come
to equate the good functioning of the EU ETS, wrongfully in our view, with the delivery of a “right price”
8 European Commission (2021): Tackling rising energy prices: a toolbox for action and support. COM (2021) 660 final. Available at: https://eur-
lex.europa.eu/legal-content/EN/TXT/?uri=COM%3A2021%3A660%3AFIN&qid=1634215984101 (Accessed on 11 April 2022).
9 Directive (EU) 2003/87. Available at : https://eur-lex.europa.eu/legal-content/EN/TXT/PDF/?uri=CELEX:02003L0087-
20180408&qid=1587648079332&from=EN (Accessed on 13 April 2022)
3which could incentivize certain technologies or approaches. This report will not judge the success or failure
of the EU ETS based on price levels. The EU ETS needs to be technologically neutral, and not an instrument
to increase prices and revenue.
Long-term competitiveness
One indicator not explicitly mentioned is the expectation that the EU ETS will contribute to a long-term
(competitive) advantage for Europe. This has become more explicit with the EGD, which was presented by
the Commission as Europe’s “New Growth Strategy”, aimed at transforming the EU into a fair and
prosperous society.
The main issue is perceived to be the magnitude and source of upfront investments that need to be made
in order to put Europe firmly on a new path of sustainable and inclusive growth, as well as the question of
how to manage the transition.
Some stakeholders see the EU ETS as a key instrument of economic and social engineering that will help
accelerate the transition to a low-carbon economy by:
• Providing a price signal to accelerate economic transition, as well as change societal values,
behaviour and systems;
• Addressing the socio-economic impacts associated with the transition to a low-GHG economy;
• Contributing to the creation of a market for low-carbon products.
Some of the objectives can be considered as being more explicit, as they are clearly captured in the EU ETS
Directive by the legislators. They encourage investments in low-carbon technologies, help address socio-
economic impacts, and facilitate a “Just Transition”.
For these objectives, the inputs are clear and KPIs can be developed, e.g., in terms of the amount of
investment leveraged; new jobs created; retraining of workers, etc. The others could be considered as being
less “mature” and transparent in the policy debate, and KPIs more difficult to develop.
Promote carbon pricing
The EU ETS has become a pioneer in promoting carbon markets as a tool for addressing climate change.
Many studies, including the Annual ICAP Status Report10 and the annual State and Trends of Carbon Pricing
report from the World Bank11, show that carbon pricing is spreading across the world. Some other actors,
for instance the International Monetary Fund (IMF), are calling for an international carbon price floor12. The
internationalization of the EU ETS, including in linking it with other markets, as well as the use of Article 6
of the Paris Agreement for offsets, need to be considered as part of the vision during the transition period.
The EU is using multiple approaches to promote the use of carbon markets around the world. Firstly,
through “leading by example” and persuasive climate diplomacy, resulting in other jurisdictions taking
inspiration from the EU ETS. Secondly, the EU is able to leverage climate ambition or the use of carbon
markets as a condition in free trade agreements or its accession process. Lastly, the EU can use a “stick”
approach in its interaction with other countries to persuade them to adopt more ambitious climate policies
and/or carbon pricing mechanisms. The proposed use of a Carbon Border Adjustment Mechanism (CBAM)
is a move in this direction.
10ICAP (2022). “Emissions Trading Worldwide: 2022 ICAP Status Report”. Available at: https://icapcarbonaction.com/en/icap-status-report-
2021 (Accessed on 11 April 2022)
11 World Bank (2021). “State and Trends of Carbon Pricing 2021”. Available at: http://hdl.handle.net/10986/33809 (Accessed on 11 April
2021)
12 Parry, I. Black, S. Roaf, J. (2021). “Proposal for an International Carbon Price Floor Among Large Emitters”. IMF. Available at:
https://www.imf.org/en/Publications/staff-climate-notes/Issues/2021/06/15/Proposal-for-an-International-Carbon-Price-Floor-Among-
Large-Emitters-460468 (Accessed on 11 April 2022).
43. Phase 3: a comprehensive analysis
3.1. The recovery Phase of the EU ETS
Phase 2 (2008-12) of the EU ETS was known for the low carbon prices it delivered. In particular, the 2009
European Union Allowances (EUA) price crash brought to light structural issues that prevented the EU ETS
from coping with economic shocks and from providing a good price discovery given the regulatory nature
of the EU ETS.
A series of reforms were implemented in Phase 3 (2012-2020) to make the EU ETS fit for delivering a price
signal that was aligned with the EU’s long-term emission reduction goal. The surplus of allowances
accumulated due to overlapping policies and the economic downturn was addressed through the
backloading of auctioned allowances, and the progressive reduction of free allocation.
In addition, a new mechanism – the Market Stability Reserve (MSR) – was implemented to improve the EU
ETS’ resilience to demand shocks. Finally, the revision of the EU ETS Directive for Phase 4, adopted in 2018,
set a new 2030 target aligned with the Paris Agreement. Subsequently, the announcement of the EGD
increased confidence in the EU’s climate ambition for 2050 and signalled the EU’s willingness to design the
EU ETS accordingly.
3.2. Climate delivery
Figure 1: Time series of verified emissions by ETS sector.
Phase 3 of the EU ETS met the emission
reduction targets. The target of a 21%
reduction of GHGs in 2020 compared to 2.000
Millions tCO2e
2005 levels had already been achieved in
2014. Based on EUTL data from the 1.500
European Environmental Agency (EEA)13,
CO2 emissions of all stationary installations14 1.000
fell by 29% over Phase 3 or 20% excluding
2020, which can be considered an outlier 500
due to the COVID-19 pandemic. This
0
reduction was driven to a large extent by
2005
2006
2007
2008
2009
2010
2011
2012
2013
2014
2015
2016
2017
2018
2019
2020
combustion installations whose emissions
decreased by 38% over Phase 3, while Aviation Combustion of fuels
Refining and coke Metallurgy
emissions from other stationary installations
decreased by 9%. Source: Ecoact based on EEA data.
The combustion sector not only includes
electric utilities, but also combustion plants of other sectors where they exceed the 20 MW participation
threshold15. Emissions of other sectors in Figure 1 therefore correspond to process emissions only.
13 To reflect changes in scope between trading periods (i.e., addition of new countries and sectors except for aviation), the data was re-
treated to derive a time-series for stationary installations starting from 2005 consistent with the scope of the third trading period. See EEA’s
background note for details available at https://www.eea.europa.eu/data-and-maps/dashboards/emissions-trading-viewer-1 (accessed on
12 April 2022).
14 The information on the type of activity of the entities covered by the EU ETS is based on the EUTL classification (which differs from UNFCCC
nomenclature for GHG emission source categories or NACE codes).
15 The scope of the EU ETS includes all combustion installations exceeding 20 MW and all installations where activities listed in Annex I of the
ETS Directive are carried out (EU, 2003). The combustion sector therefore includes electricity production (up to 54% of installations according
to euets.info data) but also other economic activities using boilers, burners, turbines, heaters, furnaces, incinerators, calciners, kilns, ovens,
dryers, engines, fuel cells, chemical looping combustion units, flares, and thermal or catalytic post-combustion units falling over the 20 MW
participation threshold.
5Additionally, the potential mis-categorization of emissions in the EUTL data (e.g., combined heat and power
emissions not included in industrial sectors) is not accounted for here.
Over Phase 3, the rate of decrease of emissions turned out to be more than twice as high as the LRF, with
an average decrease of 5% per annum (6.4% in combustion, 1.3% in other stationary installations). The
largest annual decrease of emissions took place from 2019 to 2020 because of the impact of COVID-19 on
economic activity, with a decrease of 11% in stationary installations’ emissions. Furthermore, emissions
from aviation decreased by 63% as air travel almost halted during the pandemic.
Overall, several signs demonstrate the start of the decarbonization over Phase 3. The carbon intensity of
combustion plants decreased by about 30% from 2013 to 2019 due to an increased share of renewable
energy in the power mix and fuel switching opportunities.16 In other installations of most sectors, carbon
intensity improvements were modest but consistent over the period.17
One matter is important to note: most of the reductions in Phase 3 were achieved in the power sector, and
while the EU ETS played a guiding role, it is generally accepted that it was not the driving factor. this
decarbonization is largely due to other policies and measures as well as a significant level of subsidies
received by the power sector. This, coupled with the low carbon prices, made it possible for the power
sector to move aggressively away from fossil fuel generation.
3.3. Economic delivery
3.3.1. Key figures
The second Phase of the EU ETS was characterized by an accumulation of allowances due to the structural
shortcomings already identified. Supply-
curbing measures implemented over Phase Figure 2: Annual and cumulative allowance surplus, all
3 and the phase-down of free allocation stationary installations except combustion.
resulted in a stabilization of the cumulative 1.500 50%
allowance surplus (Figure 2). Since 2017, the
Millions tCO2e
1.300
manufacturing sector experiences a yearly 40%
1.100
allowance deficit of between 2% and 3% of 900 30%
total emissions. 700
20%
While Figure 2 provides a macroeconomic 500
view of the balance between free allocation 300 10%
and verified emissions, breaking down these 100
0%
volumes by sector uncovers important -100
5 07 09 11 13 15 17 19
0
heterogeneity. As Table 1 shows, -300 20 20 20 20 20 20 20 20 -10%
combustion installations experienced an Cumulative surplus Annual surplus (% of emissions)
allowance deficit of up to 85% of annual
emissions, counting from 2013, in 2020, Source: Ecoact based on EEA data.
mainly due to the power sector transition to
full auctioning. Regarding process emissions (i.e., stationary installations other than combustion), the
aggregate deficit experienced since 2017 was mainly driven by the refining of mineral oil, production of
coke, as well as cement and chemical industries to a smaller extent. On the other hand, metallurgy and
paper process installations had a positive allowance balance throughout Phase 3.
Differences in allowance balances can be explained by the data’s high level of aggregation and differences
in the origin of emissions between economic sectors, e.g., if metallurgy has a large share of combustion
16 See details in LMDI analysis in section 7.
17 Details in section 6.
6installations, the allowance balance of metallurgy’s process emissions would appear large by comparison
to a sector whose emissions mainly originate from process installations.
Table 1 provides a static overview of sectors’ allowance balances, but it does not account for allowance
banking. Banking gives the option to account holders to save unused emission allowances for use in future
trading periods. Indeed, since 2013, allowances delivered can be used in any further trading period,
according to Article 13 of Directive 2003/87/CE.
Table 2, therefore, tries to quantify the actual allowance deficit when considering banking. It results in the
number of emissions exceeding installations’ total allowance holdings, i.e., yearly free allocation plus the
accumulated bank, if any, which can be interpreted as the number of allowances purchased on the
secondary market. In aggregate, the banking flexibility enabled stationary installations of most sectors
except for combustion to keep a positive allowance balance during Phase 3. In other words, process
installations could have relied on the aggregate accumulated bank to cover emissions, without a need to
purchase allowances on the secondary market. By contrast, combustion installations, and process
installations of the refining and coke7 sectors would have had to purchase allowances in the market due to
a lack of reserves since 2013.
Table 1: Yearly allowance surplus (green) and deficit (red) in Phase 3 by ETS sector, in percentage of the
sector's verified emissions.
Source: Ecoact based on EEA data.
Sectors based on the EU ETS classification. Metallurgy: metal ore roasting or sintering, production of pig iron or steel, production or
processing of ferrous & non-ferrous metals, production of primary & secondary aluminum ; cement: production of cement clinker, lime
or calcination of dolomite/magnesite, ceramics, mineral wool ; chemicals: production of nitric acid, adipic acid, glyoxal and glyoxylic acid,
ammonia, bulk chemicals, soda ash and sodium bicarbonate, production of carbon black, hydrogen or synthesis gas ; paper: production
of gypsum or plasterboard, pulp, paper or cardboard ; other: capture of greenhouse gases, activity opted-in under Art. 24.
Table 2: Estimated purchases of allowances in Phase 3 by ETS sector taking into account allowance
banking since 2013, in percentage of sector's verified emissions.
Source: Ecoact based on EEA data.
The annual bank is calculated as the positive difference between annual free allocation and emissions, plus the bank of the preceding
year. As the bank cannot be negative, it is assumed that when there is no allowance left to cover emissions, the sector has to purchase
permit in the market.
7These results assume that banked allowances remained in account holders’ hands over the years, which
may not be the case in practice as part of the
allowances in circulation are in the hands of
the banking sectors and other financial Figure 3: Cost of greenhouse gas emissions (€/tCO2e).
players for hedging purposes. These results 25
should rather be seen as an indication that
the banking flexibility can be effective to 20
smooth carbon costs over time.
15
Having estimated the aggregate need of
allowance purchases of installations, Figure 10
3 quantifies the carbon cost paid in €/tCO2e.
It does so by dividing the product of 5
estimated permit purchases and the yearly
average EUA price by the sector’s aggregate 0
emissions. The carbon cost should not be 2013 2014 2015 2016 2017 2018 2019 2020
Aviation Combustion of fuels
interpreted as the carbon price signal, i.e., Refining and coke Other stationary installations
the EUA market price. The price signal Total
provides the same abatement incentive to
every installation despite the amount of free Source: Ecoact based on EEA data.
allocation received.
Figure 3 also shows that, as a whole, the effective carbon cost has increased more than sevenfold from
2013 to 2020, due to the phase down of free allocation coupled with increasing EUA prices. This trend has
been mainly driven by the scarcity of allowances in aviation, combustion installations, and process
installations in the refining and coke sectors. Process emissions in other manufacturing sectors could have
been almost entirely covered by free allowances (Table 1), hence the effect of carbon cost is negligeable
for these sectors.
Figure 4: Share of auction revenues earmarked for climate
3.3.2. Auction revenues
purposes18, 2013-2020, EU-27.
Consistent with the carbon price increase in
Phase 3, Member State revenues from the 90%
auctioning of EUA rose from €3.1 billion in 85%
2013 to 14.4€ billion in 2020 in the EU-27 80%
(Figure 5). Based on annual reporting, it is 75%
estimated that 75% of total revenues (€56.5 70%
billion) was used for climate and energy 65%
19
purposes during Phase 3 and 72% in 2020 . 60%
Although it remains well above the 55%
50% required in the legislation, the share of 50%
revenues earmarked for climate and energy 2013 2014 2015 2016 2017 2018 2019 2020
purposes has varied without showing a
constant trend since 2013, with a low of 63% Source: Ecoact based on Staff Working Document accompanying
20 EU Climate Action Progress Report (2021).
in 2018 (Figure 4).
18 Only revenues that are earmarked on climate and energy purposes are considered, therefore this chart in not representative of the total
domestic spending on climate and energy. In some Member States, auction revenues can be pooled in the general budget and spent on
climate issues, and other sources of income can also finance climate policies.
19 European Commission (2021). EU Climate Action Progress Report 2021. COM(2021) 960. Available at: https://eur-lex.europa.eu/legal-
content/EN/TXT/PDF/?uri=CELEX:52021DC0960 (Accessed on 19 April 2022)
20 It should be stressed that only a portion of auction revenues is earmarked for climate and energy purposes, however, since a quarter of it
goes to the general budget of Member States.
8In 2021, Member States reported on the type of support used domestically for the first time.21 In 2020,
most of the reported revenues were spent on direct support (Figure 5), i.e., on the installation of
technologies that reduce emissions. In particular the development of renewable energy to meet the EU’s
targets, measures to encourage a shift to low-emission and public forms of transport, and energy efficiency
measures were the main beneficiaries of auction revenues. Interestingly, around 60% of the EU ETS
revenues was spent in non-ETS sectors.
Figure 5: Auctioning revenues and reported usage (€ bn), 2013-2020, EU-27.
Source: EU Climate Action Progress Report (2021).
Figure 6: Self-reported use of ETS auctioning revenues spent on
climate change and energy in 2020. 1
100%
80%
60%
40%
20%
0%
hu l
Cr e n
Es us
Bu hia
rm k
Slo ce
ria
Ro ary
Po tvia
Cy d
Fr m
m d
De ania
M g
ce
tia
Po ly
H u an d
Slo nia
ain
Sw nia
Gr ta
Ire ia
Be nia
Au ny
Cz kia
Lit uga
Ge ar
ur
lan
xe lan
Ita
r
u
al
an
pr
ee
a
ed
lga
oa
st
va
ec
ve
a
Sp
to
ng
nm
lgi
bo
La
l
rt
m
Lu Fin
Renewable Transport Energy Efficiency R&D Other domestic
Source: Ecoact based on Reportnet dataflows1.
21 As per Article 5 of the Implementing Regulation (EU) 2020/1208. Commission Implementing Regulation (EU) 2020/1208 of 7 August 2020
on structure, format, submission processes and review of information reported by Member States pursuant to Regulation (EU) 2018/1999
of the European Parliament and of the Council and repealing Commission Implementing Regulation (EU) No 749/2014 (Text with EEA
relevance).
9By looking at the numbers more closely (Figure 6), it is possible to identify some trends among Member
States on how they used auctioning revenues in 2020. Particularly countries from Northern and Southern
Europe used them mainly to develop renewable energy to meet the EU’s target, while Central and Eastern
European Member States gave preference to encouraging a shift to low-emission and public forms of
transport. Countries from Eastern Europe invested in energy efficiency measures. An important share goes
to other domestic GHG reduction measures, especially among some of the biggest countries in the EU, such
as Germany, France, and Italy, which use, respectively, 75%, 42% and 20% of these revenues for those
policies.
3.4. Resilience of the EU ETS
Phase 3 of the EU ETS succeeded in restoring the scarcity of allowances in the market, which, as expected,
impacted the carbon price. It was also the phase of a major structural change, the Market Stability Reserve
(MSR), implemented in 2019 to (i) address the existing surplus of allowances and (ii) improves the system’s
resilience to major shocks. The MSR operates by altering the total number of allowances in circulation
(TNAC) according to pre-defined rules and by cancelling allowances when the TNAC exceeds a specified
threshold.
There is little history to evaluate the impact of the MSR on environmental and economic outcomes of the
EU ETS, yet its implementation evidently coincided with a strong increase in EUA prices. The role played by
the MSR in the recent price rise is not clear, however. No correlation has yet been found22 between the
TNAC and EUA prices.23
Some, who equate high prices with success of the EU ETS, would argue that the MSR’s support function can
be perceived as a success as prices remained high during the COVID-19 pandemic. The recent escalation in
prices (+50% between October 2021 and February 2022) creates doubts about the success of the EU ETS to
incentive effective decarbonisation.
Several studies have raised concerns about the MSR’s ability to bring stability to the market. First, the MSR’s
action is based on past TNAC volumes, which has been criticized as being contrary to the forward-looking
nature of the EU ETS. For instance, the decision to bank allowances for hedging purposes can result in the
MSR cancelling allowances, further reinforcing allowance scarcity and triggering price spikes.24 Secondly,
the cancellation mechanism has been pointed out as a potential factor in creating short-term price volatility
as it creates uncertainty around the future cap on emissions.
4. Regulatory developments
4.1. EU developments
4.1.1. Secondary legislation for Phase 4 of the EU ETS
Having started in 2018, work on the secondary legislation to implement the provisions in Phase 4 of the EU
ETS has continued in 2021. Except for the exclusion of incoming flights from the UK from the scope of the
EU ETS, developments have been mainly focused on setting the conditions for the update of free allocation
for the 1st sub-period (2021-2025) of the EU ETS, following the submission of data by Member States. The
indicative timeline of secondary legislation is presented in Figure 7.
22 EU ETS: The Market Stability Reserve should focus on carbon prices, not allowance volumes. Energypost. June 16, 2020. S.Quemin & M.
Pahle.
23 Other factors such as hedging and speculation could have played an equally important role in driving prices.
24 The TNAC is computed based on the difference between past volumes of allowances freely allocated or sold (supply), and emissions plus
allowances in the MSR (demand). It therefore does not represent the balance of the market, which also depends on anticipation of future
prices and hedging behaviors.
10On 25 February 2021, the Figure 7: Timeline of the secondary legislation related to the EU ETS.
Commission adopted the
Decision concerning
National Implementation
Measures (NIMs).25 The
NIMs Decision outlines the
treatment of installations
under the EU ETS.
Member States were
required to submit their
NIMs to the Commission
over the period 2014-2018,
comprising a list of
installations on their Source: ERCST (2022).
territory covered by the
Directive 2003/87/EC.
The NIMs included information on production activity, transfers of heat and gases, electricity production
and emissions at sub-installation level. The NIMs were used by the Commission to calculate the benchmark
values which are used to determine the level of free allocation.
On 12 March 2021, the Commission adopted the Implementing Regulation determining the revised
benchmark values for free allocation of emission allowances, for the period 2021 to 2025.26
On 31 May 2021, the Commission adopted its Decision on the Cross Sectoral Correction Factor (CSCF)27. The
CSCF adjusts the free allocation of emission allowances if demand from industry exceeds the free allocation
quota under the EU ETS Directive.
For each year in the allocation period from 2021 to 2025, the CSCF will be 100%, thus the CSCF will not
reduce the level of free allocation further.
The publication of the National Allocation Tables (NATs)28 on 29 June 2021 was the last stage of the
legislative process for the update of the benchmarks in the first subperiod of the EU ETS. Using the revised
benchmark values, the NATS determine the list of installations under the EU ETS eligible to receive free
allocation and the level of free allocation provided to them for each year in the period 2021-2025.
25 Commission Decision (EU) 2021/355 of 25 February 2021 concerning national implementation measures for the transitional free allocation
of greenhouse gas emission allowances in accordance with Article 11(3) of Directive 2003/87/EC of the European Parliament and of the
Council (notified under document C(2021) 1215). Available at: https://eur-lex.europa.eu/legal-
content/EN/TXT/PDF/?uri=CELEX:32021D0355&rid=17 (Accessed on 11 April 2022)
26 Commission Implementing Regulation (EU) 2021/447 of 12 March 2021 determining revised benchmark values for free allocation of
emission allowances for the period from 2021 to 2025 pursuant to Article 10a(2) of Directive 2003/87/EC of the European Parliament and of
the Council. Available at: https://eur-lex.europa.eu/legal-content/EN/TXT/PDF/?uri=CELEX:32021R0447&qid=1617870888213&from=en
(Accessed on 13 April 2022)
27 Commission Implementing Decision (EU) 2021/927 of 31 May 2021 determining the uniform cross-sectoral correction factor for the
adjustment of free allocations of emission allowances for the period 2021 to 2025 (notified under document C(2021) 3745). Available at:
https://eur-lex.europa.eu/legal-content/EN/TXT/?uri=CELEX:32021D0927 (Accessed on 11 April 2022)
28 European Commission (2021). Commission Decision of 29 June 2021 instructing the Central Administrator of the European Union
Transaction Log to enter the national allocation tables of Belgium, Bulgaria, Czechia, Denmark, Germany, Estonia, Ireland, Greece, Spain,
France, Croatia, Italy, Cyprus, Latvia, Lithuania, Luxembourg, Hungary, Netherlands, Austria, Poland, Portugal, Romania, Slovenia, Slovakia,
Finland and Sweden into the European Union Transaction Log. Available at: https://eur-lex.europa.eu/legal-
content/EN/TXT/?uri=uriserv%3AOJ.C_.2021.302.01.0001.01.ENG&toc=OJ%3AC%3A2021%3A302%3AFULL (Accessed on 11 April 2021).
11Finally, the last piece of EU ETS secondary legislation adopted in 2021 is the Delegated Regulation on the
exclusion of incoming flights from the United Kingdom from the scope of the EU ETS.29 It exempts departing
flights from the UK to the European Economic Area (EEA) based on Article 25 of the EU ETS Directive.30
No secondary legislation or modification of the Article 29a of the EU ETS Directive to address excessive price
fluctuations has taken place in 2021, this being a potential element to consider under the current energy
crisis and its impact on carbon prices.
4.1.2. Fit for 55
On July 14, 2021, as part of the Fit for 55 package, the Commission published its legislative proposal for the
MSR review.31 The European Climate Law32 sets the overall EU intermediary target of reducing GHG
emissions by 55% by 2030 (versus 1990 levels) to reach net zero by 2050.
In the case of the EU ETS, this will mean an increase from the current target of -43% to - 61% for EU ETS
installations by 2030 (versus 2005 levels). To reach this target, the Commission is moving from a Linear
Reduction Factor (LRF) of 2.2% to 4.2% from 2024 onward. In addition to this, the Commission proposes a
one-off removal of 117 million allowances (a so-called “rebase”) in 2024.
The increased target is also reflected in the proposed adjustment of the maximum benchmark update rate
from 1.6% to 2.5%, starting in 2026. The ETS revision has also launched a debate on the future of free
allocation, a tool which is currently used to address the risk of carbon leakage.
According to several projections, free allocation could run out by the end of this decade, meaning that the
CSCF may kick in. In the EGD, the Commission announced that, should differences in the levels of climate
ambition persist worldwide, it would propose a CBAM, to ensure that the price of imports more accurately
reflects their CO2 content. Consequently, the Fit for 55 Package included a proposal for an EU CBAM. For
the sectors covered by the CBAM33, the Commission is proposing a phase out of free allocation by 2035,
with a 10% annual reduction.
Moreover, allowances otherwise allocated for free to industry sectors covered by the CBAM are to be used
to increase the size of the Innovation Fund from 450 to 650 million allowances. The Modernisation Fund
would also increase to up to 2.5% of the cap.
The Commission is furthermore proposing to exempt the submission of CO2 allowances for emissions which
are permanently chemically bound in a product. It is devising a Carbon Removal Certification Mechanism
(CRC-M) by 2023. The CRC-M is meant to incentivize the removal of CO2 and the development of Carbon
Capture and Utilization (CCU) technologies.
29 Commission Delegated Regulation (EU) 2021/1416 of 17 June 2021 amending Directive 2003/87/EC of the European Parliament and of the
Council as regards the exclusion of incoming flights from the United Kingdom from the Union emissions trading system. Available at:
https://eur-lex.europa.eu/legal-content/EN/TXT/?uri=CELEX:32021R1416 (Accessed on 11 April 2022).
30 European Commission (2021). Frequently Asked Questions. The impact of Brexit on the EU Emissions Trading System for aviation.
September 2021. Available at: https://ec.europa.eu/clima/system/files/2021-09/policy_transport_aviation_faq_aviation_brexit_en.pdf
(Accessed on 11 April 2022).
31 European Commission (2021). Proposal for a Directive of the European Parliament and of the Council amending Directive 2003/87/EC
establishing a system for greenhouse gas emission allowance trading within the Union, Decision (EU) 2015/1814 concerning the
establishment and operation of a market stability reserve for the Union greenhouse gas emission trading scheme and Regulation (EU)
2015/757. COM(2021) 551 final. Available at: https://ec.europa.eu/info/sites/default/files/revision-eu-ets_with-annex_en_0.pdf (Accessed
on 11 April 2022).
32 Regulation (EU) 2021/1119 of the European Parliament and of the Council of 30 June 2021 establishing the framework for achieving climate
neutrality and amending Regulations (EC) No 401/2009 and (EU) 2018/1999 (‘European Climate Law’). Available at: https://eur-
lex.europa.eu/legal-content/EN/TXT/?uri=CELEX:32021R1119 (Accessed on 11 April 2022).
33 The list of sectors under the CBAM, as proposed by the Commission, are iron and steel, cement, fertiliser, aluminium and electricity
generation. European Commission (2021). Proposal for a Regulation of the European Parliament and the Council establishing a Carbon Border
Adjustment Mechanism. COM (2021) 564 final. Available at https://eur-lex.europa.eu/resource.html?uri=cellar:a95a4441-e558-11eb-a1a5-
01aa75ed71a1.0001.02/DOC_1&format=PDF (Accessed on 13 April 2022)
12With respect to the MSR, the Commission has proposed to extend the current parameters until 2030, with
a doubled 24% intake rate of allowances moving into the MSR until then. The change of the intake rate
mechanism to mitigate threshold effects is applicable when the total number of allowances in circulation is
close to the upper threshold of 833 million but below 1096 million. In addition, the proposal calls for a
cancellation (invalidation of allowances) when the allowances in the MSR are above a threshold of 400
million, instead of above the total number of allowances auctioned during the previous year. Additionally,
the MSR will now include the supply and demand from aviation and maritime transport sectors.
As part of the Fit for 55 package, the Commission proposed amendments to the EU ETS Directive with
regards to the contribution of aviation to the EU emission reduction target. The Commission foresees a
progressive phase-out of the free allowances distributed to aircraft operators from 2024 to 2026 (by 25%,
50% and 75% respectively) and a complete phase-out from 2027 onwards.
The Commission also proposes to apply the same LRF as for stationary installations (4.2% instead of 2.2%)
and to rebase the total number of allowances on active aircraft operators in 2023.
The scope of the EU ETS would remain unchanged, i.e., it would cover intra-EEA flights in addition to flights
from the UK and Switzerland. These flights would be exempted from the Carbon Offsetting and Reduction
Scheme for International Aviation (CORSIA)34, whose voluntary phase began in 2021.
One of the most controversial points coming from the Commission proposal to revise the EU ETS is the
potential extension of carbon pricing to new sectors, with a particular focus on maritime, road transport
and buildings.
EU maritime transport CO2 emissions currently account for around 4% of the EU’s CO2 emissions35. For the
maritime sector, the Commission is proposing that CO2 emissions from large EU ships (above 5000 gross
tonnages36) be covered under the current EU ETS starting with a phase-in period37.
EU road transport and building emissions currently account for 30% of the EU’s GHG emissions. For the road
transport and building sector, the Commission is proposing upstream emissions to be covered under an
independent ETS starting in 2026 with a 5.15% LRF.
In contrast, the outlook for the extension to road transport and buildings is still less certain and the decision
will depend on the negotiations between the European Parliament and Council. Such an ETS extension
would almost double the ETS GHG emissions coverage, which would pass from 45% to around 80%.
4.2. International carbon price developments
4.2.1. Brexit implications for the EU ETS
The UK ETS was put in place starting in 2021, as part of the EU-UK trade and cooperation agreement. The
practical implications of Brexit for the EU ETS mainly concern the aviation sector due to the split between
the EU and UK ETS registries. Since flights departing from the UK to the EEA fall under the scope of the
EU ETS after Brexit (see Chapter 4.1.1), all aircraft operators previously administered by the UK needed to
migrate to a participating state under the EU ETS in 2021.
34 CORSIA is a global market-based measure for aviation emissions put in place by the International Civil Aviation Organization (ICAO) since
2016. Aviation benefits (n.d.). “CORSIA explained”. Available at https://aviationbenefits.org/environmental-efficiency/climate-
action/offsetting-emissions-corsia/corsia/corsia-explained/ (Accessed on 12 April 2022).
35 DG CLIMA (2021). Fit for 55 Package Delivering our 2030 climate target. Revision of the EU Emissions Trading System. 12th EU ETS
Compliance Conference. Slide 14. Available at: https://ec.europa.eu/clima/system/files/2021-12/20211124_p1_en.pdf (Accessed 13 April
2022)
36Ships covered by Regulation (EU) 2015/757 performing voyages with the purpose of transporting passengers or cargo for commercial
purposes.
37 The phase-in period will start in 2023, where shipping companies will be required to report their 20% of verified emissions: respectively,
45% for 2024, 70% for 2025, and 100% for 2026 and after.
13You can also read