2022 Operating and Capital Budget - Staying the Course - A Year of Execution - Ben Franklin Transit
←
→
Page content transcription
If your browser does not render page correctly, please read the page content below
2022 Operating and Capital Budget

Staying the Course – A Year of Execution

                    1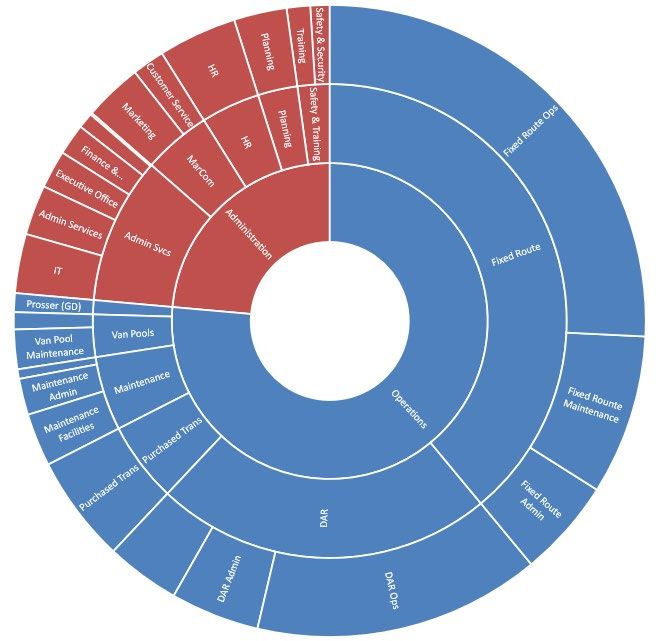
Table of Contents
     General Manager Budget Message .............................................................................................................3

     Strategic Objectives, Budget Planning & Guidance and Budget Overview .................................................4

     Service Levels & Ridership Assumptions .................................................................................................. 11

     Revenue Assumptions .............................................................................................................................. 12

     Workforce Assumptions ........................................................................................................................... 14

     Other Expense Assumptions .................................................................................................................... 14

     Capital Budget .......................................................................................................................................... 17

     Appendix 1 – Operating & Capital Budget Details ................................................................................... 20

     Appendix 2 – Department Accomplishments, Goals and Initiatives and Budgets ................................... 27

     Appendix 3 – Capital Improvement Plan.................................................................................................. 62

                                                                           2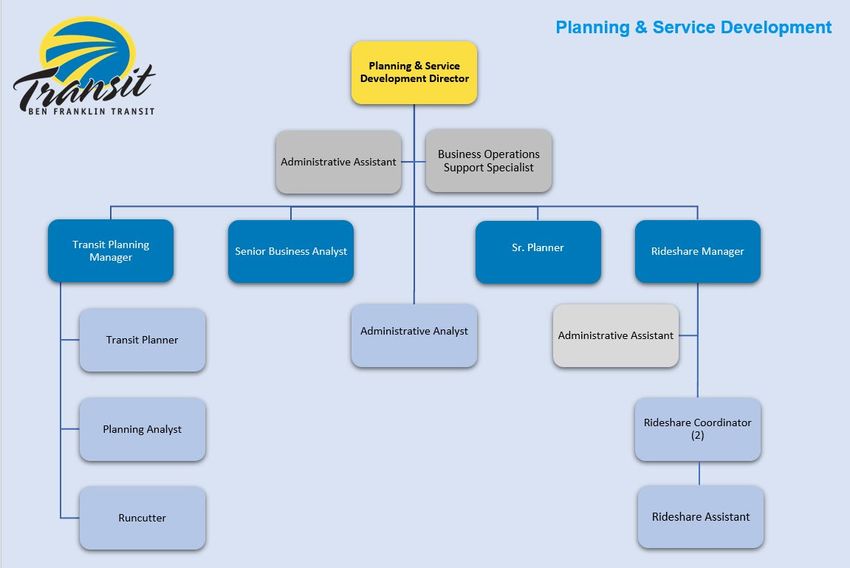
General Manager Budget Message
2022 – Staying the Course: A Year of Execution

When we began the 2021 budgeting process in late 2020, the Ben Franklin Transit (BFT) team had great
expectations that 2021 would return to normal. A year later, we are now budgeting for 2022 and the
uncertainty around COVID-19 and its impacts continues.

As we look ahead to 2022, we know there will be lingering impacts and changes due to the ongoing
pandemic, but we are committed to providing the best service possible to the community. We are
making plans based on schools and businesses remaining open and continued ridership recovery. We
understand that things may change, and we are ready and willing to respond with flexibility and
adaptability.

While the Pandemic in 2020-2021 brought unforeseen challenges to BFT and the public we serve, Ben
Franklin Transit did not stop evolving and expanding service to the public. We forged ahead with the
addition of Frequent Corridor Service and added Sunday service for Fixed Routes and Dial-A-Ride for the
first time in BFT’s history.

Our budget theme for 2022 is Staying the Course: A Year of Execution. Looking forward to what we
have scheduled to accomplish in 2022, we will be executing and making substantial progress on many
projects and initiatives that have been put on hold or delayed for the past several years. Our primary
areas of focus in 2022 are:

   •   Supporting a full year of the service changes that were initiated in 2021
   •   Beginning/resuming many capital improvement projects that have been deferred/delayed
   •   Beginning/resuming several initiatives within the agency with the goal of increasing operational
       effectiveness and efficiencies.

We look forward to 2022 and the challenges and opportunities before us.

                                                  3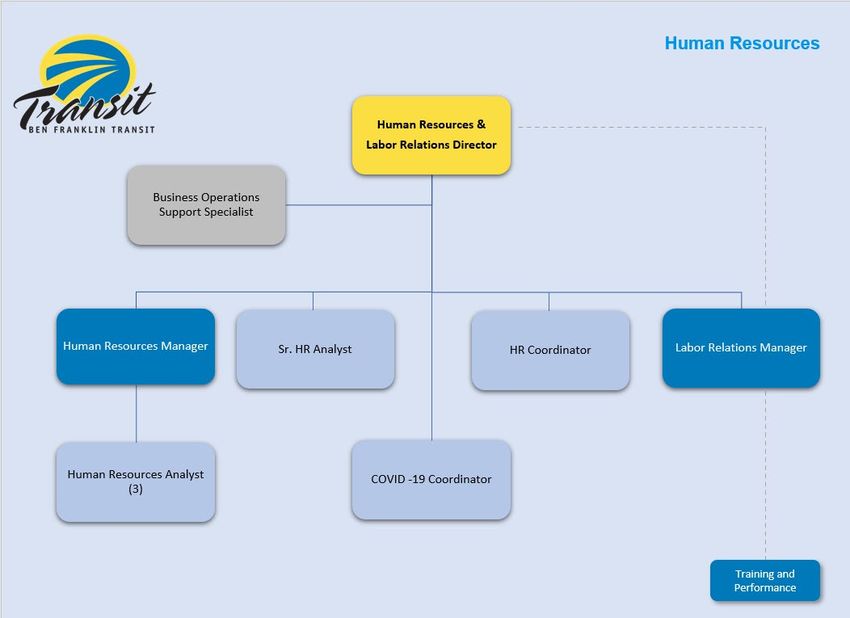
Strategic Objectives, Budget Planning & Guidance and Budget
Overview
Strategic Objectives
In January 2015, the Board approved the BFT Strategic Plan with primary and secondary objectives consistent with
BFT’s Mission Statement and Core Values. The primary and secondary objectives are:

These objectives serve as the core basis in developing our agency-wide 2022 goals and major initiatives which are
further developed with measurable outcomes at the department and employee level.

                                                       4
Budget Planning & Guidance
Each year, extensive planning takes place to identify organizational/service needs for the following year. This
process begins later in the second quarter to best manage the expectations and service levels leading into the fall
budget planning process.

 Ben Franklin Transit 2022 Budget Calendar
                 • Review budget plan and CIP parameters with General Manager
 February
                 • Distribute budget development cycle calendar

 March           • Call for six-year project projections, send CIP form & instructions

 April           • Submit CIP Projects

 May             • Six-year CIP to Board Committee

                 • CIP to Board for release for public comment
 June
                 • TDP to Board Committee

                 • CIP to Board for approval
                 • TDP to Board and release for public comment
                 • Budget kick-off meeting
 July
                 • Roll budget model and forms
                 • EMT discuss Major Goals & Initiatives
                 • Administrative services director to distribute budget guidance memorandum

                 • Finance to meet with each EMT to work through budget
 August          • TDP to Board for final approval
                 • EMT finalize agency Major Goals & Initiatives

                 • Budget edits made and draft sent to General Manager and EMT
 September       • Executive budget review with General Manager and EMT
                 • Budget sent to A&F committee

                 • Budget presented to Admin & Finance Board committee
                 • Budget presented to Board at budget workshop
 October
                 • Budget to Board for public hearing
                 • Budget released for public comment

                 • Prepare budget adoption and related documents
 November
                 • Budget to Board for approval

 December        • Budget entered in accounting system

                                                         5
Budget Guidance and Objectives
When developing the 2022 Financial Plan, BFT used the following overall objectives to provide framework and
guidance in the budget development process.

   •   Support major service additions introduced in 2021
          o In June 2021, BFT implemented Frequent Corridor Service
          o In late August 2021, BFT implemented Sunday fixed route and Dial-A-Ride service for the first time
              in agency history
          o These were significant service changes and in 2022 we are committed to supporting and ensuring
              the operational impacts of these changes are being addressed in the most cost-effective and
              efficient manner as possible
          o Service changes planned for 2022 will be minor route changes

   •   Advance and adapt system for future regional growth
          o The Tri-Cities area continues to be one of the fastest growing regions in the country
          o Capital projects previously planned will be entering various phases of execution
          o The decades old Operations building will be demolished, and construction will begin on a new
              facility on the same footprint. This new building will support BFT growth well into the future
          o Construction planned to begin on a new transit hub in the Queensgate area of Richland
          o Land acquisitions in downtown Pasco, West Pasco, Southridge area of Kennewick, Benton City and
              Prosser for future transit hubs and facilities
          o Bus Stop Amenity Program will continue to improve bus stops

   •   Maintain a state of good repair
          o Fleet vehicles will be maintained and replaced in accordance with BFT’s Transit Asset
              Management (TAM) plan
          o The overall IT and infrastructure will continue to be modernized and updated to current technical
              standards with an emphasis on cybersecurity, resilience, and redundancy
          o Efficiencies will be realized as software tools continue to be upgraded and new tools are
              implemented

   •   Grants to be used for operating costs to maximum extent possible, freeing up local funds to go to reserves
       and capital projects
          o The FTA has awarded multiple grants to all qualifying transits across the country using CARES,
               CRRSAA, and ARP Act funding. These grants have flexibility in how transits use these grants to
               cover operating and capital costs so that transits can continue to provide safe and reliable service
               throughout the pandemic.
          o BFT will apply these grant dollars to operating expenses thereby enabling sales tax revenues to
               be directed to multiple delayed/deferred capital projects

   •   Begin multiple capital projects that have previously been approved but were delayed either due to COVID-
       19 or limited funding resources in prior years. Major projects include:
           o Construction to begin on a new Operations facility
           o Construction to begin on new transit hubs near Queensgate in Richland and downtown Pasco
           o Land acquisition for future transit hubs in downtown Pasco, West Pasco, South Kennewick,
                Benton City, and Prosser

                                                        6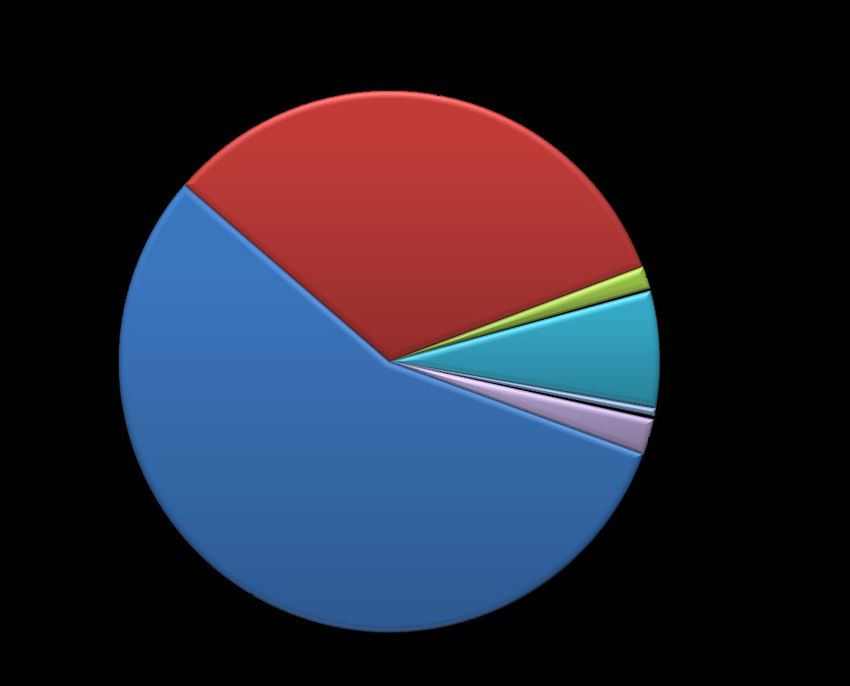
Overview & Key Highlights of the 2022 Budget
The budget theme for 2022 is “Staying the Course: A Year of Execution.” BFT management is adding very few
significant new goals or initiatives in 2022. Rather, the focus will be on executing projects and initiatives that have
been identified in prior years. Some of these represent activities that were expected to take several years to fully
implement while others are projects and initiatives that have been deferred or delayed due to COVID-19 or are
waiting until enough reserves have been accumulated in order to pay for capital projects requiring local funding.

Economic Outlook
While the local economy has remained strong throughout the pandemic, uncertainty remains for the future.
Primary areas of concern are:

    •   Sales Tax Uncertainty
            o Will local sales tax continue to be strong or will larger economic forces impact growth?
            o Sales tax represents the single largest source of annual revenues
            o Management has considered this by taking a cautious approach by forecasting modest growth of
                3.5% in sales tax revenues in 2022 compared to 2021 forecasts
    •   Special Grant Funding
            o CRRSAA & ARP Act funding for 2022 & 2023 stabilizes and de-risks forecasts for sales tax and fare
                revenues
            o These grants received through the FTA provide flexibility in using these grants for operating
                expenses not normally covered in the normal FTA grants
    •   Ridership recovery
            o Will there be new shutdowns and restrictions impacting schools and businesses?
            o BFT made major service modifications throughout 2021
            o 2022 is committed to sustaining this new level of services

Challenges in 2022
The primary challenges foreseen in 2022 are:

    •   General economic uncertainty due to continuing COVID-19 (C19) variants
           o The economic development activities taking place throughout the general area indicates that the
               local economy remains strong
           o This challenge is being met by forecasting modest growth in sales tax revenues and by utilizing
               the FTA grant funding with CARES, CRRSAA, and ARP funding

    •   Ridership uncertainty due to continuing COVID-19 variants
            o Ridership continues to recover from the low levels in experienced in early 2020 resulting from the
                pandemic

    •   Finding and keeping qualified talent is a challenge for many businesses.
            o BFT will continue with several HR initiatives intended to make BFT an employer of choice
            o The resumption of training and development programs that were paused in 2020 and 2021 will
                be resumed

                                                          7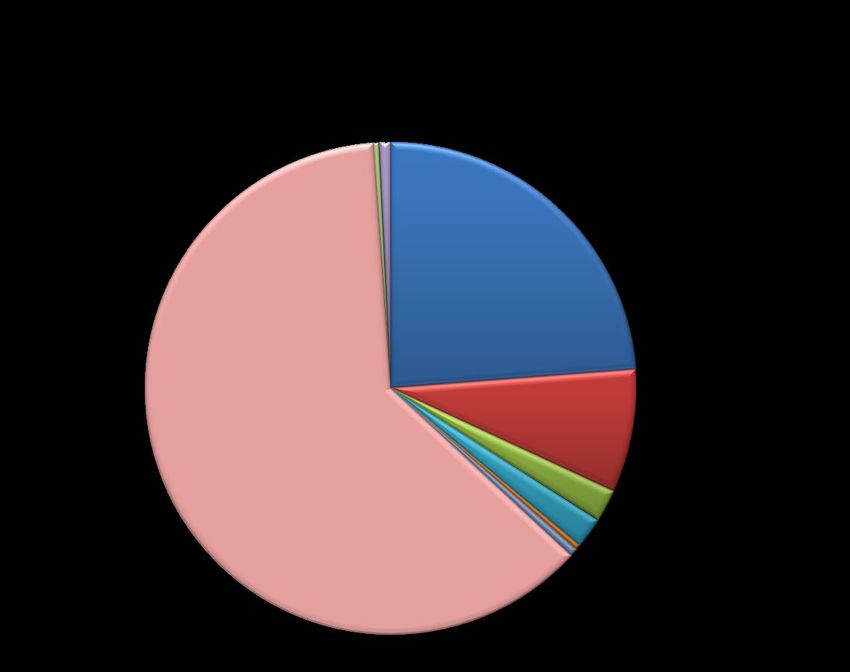
•    General COVID-19 responses continue to have operational impacts
            o Sustained higher level of cleaning expenses will continue to ensure transit vehicles and facilities
                remain safe for passengers and employees
            o Vehicle and office social distancing will continue to follow federal, state, and local guidance and
                recommendations

    •    Managing and executing multiple capital improvement projects
            o Multiple facility constructions projects will be in progress
            o Multiple technology improvement projects and initiatives will be in progress
            o An emphasis will be placed on project management training and skills to ensure the multiple
               capital projects and improvement initiatives are executed and implemented effectively

Significant Contractual/Compliance Activities
Federal COVID Grant Funding Through the Federal Transit Authority (FTA)
BFT has received 3 separate special grant awards through the FTA grant program using separate COVID-19 funding
acts issued by the federal government. These grants were provided through the Coronavirus Aid, Relief, and
Economic Security Act (CARES), the Coronavirus Response and Relief Supplemental Appropriations Act (CRRSAA),
and the American Rescue Plan Act (ARP), and provide for the reimbursement of eligible operating expenses and
capital projects. The amounts awarded from these Acts are listed below:

                            CARES Act (early 2020)                         $18,973,077
                            CRRSSA (late 2020)                               8,460,568
                            ARP (early 2021)                                20,849,570
                              Total Grant Funding Received                 $48,283,215

These grants are in addition to the ongoing grants received from the FTA (i.e., 5307, 5309, etc.) grants. The ARP
funding must be committed/obligated by 2024. The CARES and CRRSAA grants do not have a specific expiration
date.

Collective Bargaining Agreements (CBAs)
The 2022 proposed budget accounts for normal step progressions through the salary scales for the following
bargaining unit employees, increasing each year in accordance with the recently signed CBAs.

         DAR Dispatchers converted from a non-represented salary progression to a standard Union step
         progression with annual increase adjustments of 2.25% for 2021 and 2.5% for 2022. The overall annual
         percentage change in labor cost for this group is 2.9% for the four-year period covering their last non-
         represented increase in January 1, 2019 to March 14, 2023, the term of the agreement.

         Mechanics renewed their contract in 2020. Seven of the eight classifications in the unit will receive an
         annual adjustment of 2.75% effective June 1, 2020, and 2.5% effective June 1, 2021. Vehicle Service
         Workers will receive a 1% adjustment in both contract years. The overall annual percentage change in labor
         cost for this group is 3.27% for the three-year period covering June 1, 2019 to May 31, 2022.

         Fixed Route Operators and Dial-A-Ride Drivers have received BFT’s final wage proposal of 3.0% effective
         June 1, 2019, and 2.0% effective June 1, 2020. These agreements would expire May 31, 2024.

        Administrative Assistants contract was ratified on July 8, 2021. This group converted from a non-
        represented salary progression to a standard Union step progression with annual increase adjustments of
        2% for 2022, 2% for 2023. There is a wage only reopener for the years of 2024 and 2025. This agreement
        expires June 30, 2026. The overall annual percentage change in labor cost for this group is 2.44% for the
        three-year period covering June 1, 2021 to May 31, 2024.
                                                         8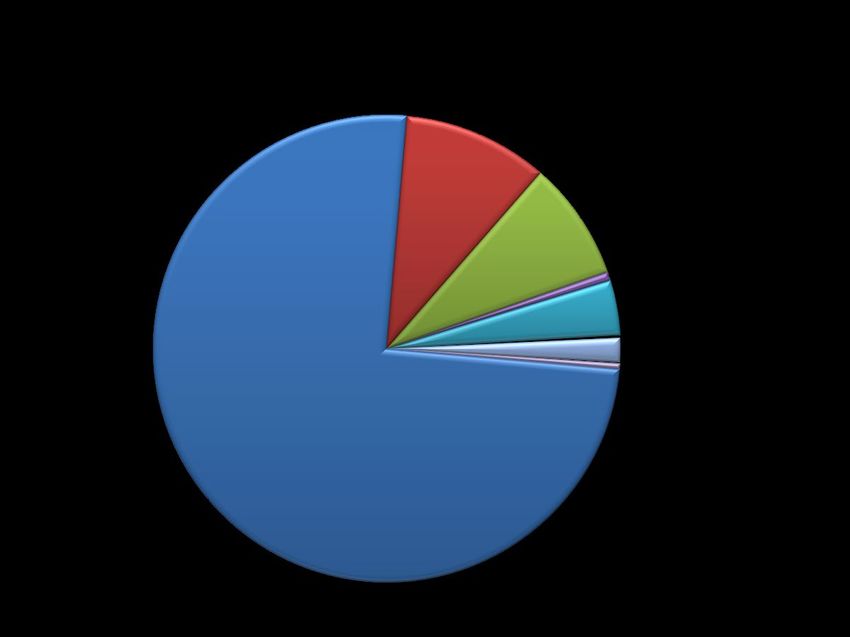
Federal/State Compliance
BFT maintained compliance with all federal and state audits and program requirements. In addition to receiving
clean audit reports, BFT was awarded its 9th consecutive award for excellence in financial reporting as awarded by
the Government Finance Officers Association for BFT’s Annual Comprehensive Financial Report.

Overview of 2022 Operating Budget
For 2022, BFT management is proposing an Operating Revenue and Expense budget of $58.1M, which is $9.6M,
or 20%, higher than the 2021 budget of $48.5M. This is a balanced budget with expenditures totaling operating
revenues. The 2022 budget increase over 2021 can be attributed to the following primary drivers:

    •   CRRSAA and ARP grant funding in response to COVID enables sales tax revenues to be utilized for capital
        projects and initiatives.
    •   Providing a full year of increased service resulting from the June and August 2021 service expansions. A
        total of 29 Operators and Mechanics were added in 2021 to support these expansions.
    •   Increased fuel costs due to recent significant price increases that are anticipated to continue through
        2023.
    •   Executing on several projects and initiatives that have been delayed/deferred over the past two years.

The chart below shows the changes by cost element from the 2021 budget to the 2022 budget.

                                                        9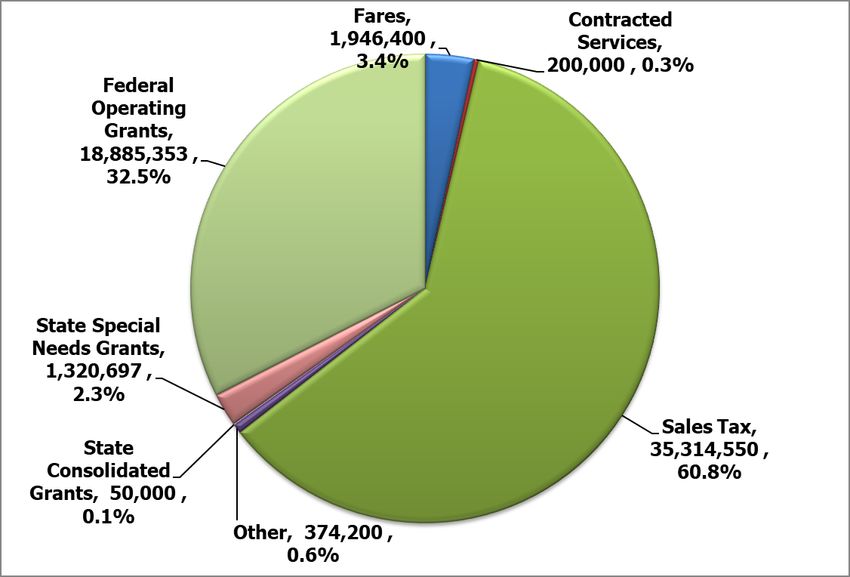
The following chart provides a general overview of the 2022 proposed Operating Expenses, with 76% being used
for Operations and 24% directed towards overall Administration. This includes the reclassification of two staff
from Operations to Administration to better align their roles.

                                $13.7M
                                 24%

                                                 $44.4M
                                                   76%

                                                      10
Service Levels & Ridership Assumptions
At the time of the preparation of this budget, COVID-19 continues to impact schools and businesses as well as
overall ridership levels. During the development of the prior year budget, BFT management had estimated a 12
to 18-month recovery period as the State of Washington entered Phase 4 of the recovery plan. However, the
pandemic has continued throughout 2021 and expectations for a full recovery of ridership continue to be pushed
out.
The estimated service levels are based on the current plans for service in 2022 while the ridership represents our
best estimate in an environment that is challenging to forecast.
Service Levels
Service levels are budgeted to support a full year of operation for the two significant service expansions
implemented in 2021. No significant changes are budgeted for 2022 with only minor route adjustments and
modifications being planned.
The table below summarizes the proposed 2022 service levels.
Service Levels
Revenue Miles Revenue Hours
2021 2022 2021 2022
Forecast Proposed Var % Forecast Proposed Var %
Fixed Route 3,053,000 3,368,000 10.3% 194,000 214,000 10.3%
Dial-A-Ride 1,569,000 1,986,000 26.6% 98,000 124,000 26.5%
Vanpool 1,194,000 1,663,000 39.3% 26,000 38,000 46.2%
General Demand 104,000 146,000 40.4% 4,500 6,800 51.1%
Contracted Services:
ARC 74,000 223,000 201.4% 4,600 14,000 204.3%
Via** 272,000 376,000 100.0% 26,000 36,000 100.0%
Total Miles/Hours 6,266,000 7,762,000 23.9% 353,100 432,800 22.6%
Ridership
Ridership is estimated to be higher in 2022 compared to the forecast for 2021. Even as the pandemic continued
throughout 2021, ridership levels are increasing as the year progresses. BFT management expects that these
upward recovery trends will continue, in addition to growth expected from the service changes implemented in
2021.
Boardings
2021 2022
Forecast Proposed Var %
1,524,000 2,113,000 38.6%
209,000 276,000 32.1%
162,000 340,000 109.9%
12,000 26,000 116.7%
26,000 78,000 200.0%
24,000 31,000 100.0%
1,957,000 2,864,000 46.3%
11Revenue Assumptions
Fare Revenues
With the pandemic continuing throughout 2021 and because of the additional federal grant funding received
through the FTA, BFT remained fare free the majority of 2021. At this time of preparation of the 2022 budget,
fare collections are expected to resume beginning November 1, 2021.
Fare revenue is budgeted to be $1.9M in 2022, compared to $3.2M in 2019 (the last full year of fare revenue
collection).
Contracted Services
Revenue for Contracted Services including ARC and Via services is projected to be $200K and reflects lower
expectations due to the extended recovery period. While we have experienced good growth of the new Connect
service, it was implemented in the middle of the pandemic and growth has been slower than planned due to
ongoing social distancing requirements and concerns.
Sales Tax Revenue
Sales tax revenue is projected at $48.1M, which is a 3.5% increase over the 2021 forecast of $46.5M. Sales tax
revenues in 2021 were forecasted to be $6.2M, or 15.7% higher than budgeted for 2021. Sales tax revenue of
$35.3M will be used for Operating Expenses while the remaining $12.8M will be used for Capital Projects.
While forecasting sales tax revenues in this time of significant financial uncertainties is challenging, the underlying
economic activity in Benton and Franklin counties appears to remain strong. Construction projects in the area
continue to move forward and reasonable growth is expected to resume in the hotel, education, medical, and
housing markets. A conservative growth factor is used to limit risk associated with budgeting operating expenses.
The following chart identifies the primary sources of sales tax revenues received by BFT.
Miscellaneous Revenue
Miscellaneous Revenue is projected at $374K and is primarily comprised of interest income and proceeds from
the sale of surplus assets.
12State Grants
State Grants are budgeted in the amount of $5.3M. State Grants consist of Department of Ecology grants for all-
electric buses, regional commute trip reduction efforts, as well as the biennial Special Needs grant of $3.7M.
These grants will be used for both Operating Expenses ($1.4M) as well as Capital Projects ($3.9M).
Federal Grants
Federal Grants are budgeted in the amount of $18.9M and come from CRRSAA and ARP Act funding. These funds
will be used for operations and capital expenses. Unlike 5307 funding which requires an agency match of 50% for
operating expenses and 20% for capital expenditures, these grants can be used to reimburse 100% of qualifying
expenses. Using these revenues for Operating Expenses enable Sales Tax revenues to be utilized for capital
projects that have been previously approved but deferred/delayed.
Based on these revenue assumptions, the following chart illustrates the breakdown of the $58.1M in budgeted
2022 Operating Revenues.
13Workforce Assumptions
Workforce is budgeted to increase approved headcount by four (4) FTEs for additional Operators needed to
support a full year of operation of the service changes implemented in 2021 along with the service adjustments
planned for 2022.
2021 2022
Additional
Approved & Approved
Work Force Budgeted Adjustments Positions Requested Proposed
Operations 160 24 184 4 188
Dial-A-Ride 118.5 (1) 117.5 - 117.5
General Demand 4.5 - 4.5 - 4.5
Vanpool 4 - 4 - 4
Maintenance 45 4 49 - 49.0
Human Resources 8 1 9 - 9
Safety / Training 7 3 10 - 10.0
Executive / Administrative Services 21 2 23 - 23
Marketing / Customer Service 16 4 20 - 20.0
Planning / Service Dev 9 2 11 - 11
Total Work Force 393 39 432 4 436
Salaries and Wages amounts have been prepared with consideration for normal step progression through the
salary scale for both represented and non-represented employees but does not include any other wage and/or
benefit increases that might be collectively bargained.
Employee Benefits
The Health Insurance budget includes an increase commensurate with the proposed increase in headcount as
detailed above and a 3% increase over 2021 rates. Rate adjustments for employees represented by a collective
bargaining unit (CBA) have been incorporated.
Based on guidance received from the State of Washington, the employer PERS contribution rate has decreased
from 12.97% used in 2021 to 10.25% for 2022.
Other Expense Assumptions
Fuel and Lubricants
Fuel and Lubricants costs are projected to increase 37% or $1.3M over the 2021 budget forecast and 65%, or
$1.4M, compared to the 2021 forecast. Fuel prices have been increasing substantially throughout 2021 and the
2022 budget has assumed that these increased prices will hold steady throughout 2022. Prices in August 2021
are 59% higher per gallon compared to August 2020.
The table below summarizes the budgeted fuel cost based on miles by mode, MPG, and estimated cost per gallon.
142022 Proposed Budget
Base Miles Avg MPG Gals Needed Rate/gal Est Cost
Fixed Rte 3,704,800 5.03 736,541 2.43 $ 1,789,800
General Demand 160,600 8.41 19,096 3.38 64,500
DAR 2,184,600 6.78 322,212 3.38 1,087,700
Van Pool 1,829,300 15.50 118,019 3.38 398,400
Non-Rev 563,970 16.79 33,590 3.38 113,400
Community Van 1,100 15.50 71 3.38 200
ARC 245,300 8.41 29,168 3.38 98,500
8,689,670 1,258,697 3.24 $ 3,552,500
Purchased Transportation
Purchased Transportation is being budgeted $400K, or 14%, lower than the 2021 budget. This is primarily due to
an expectation of slower growth for the Connect Service that began in 2021. While this service continues to grow,
it will be at slower rates than previously assumed due to the continued impact the pandemic has had on ridership
recovery levels.
Other Expenses
The remaining cost elements are shown below and represent either immaterial dollar amounts or minimal
changes from the 2021 budget.
2021B 2022B Change
Tires & Tubes 332,000 300,400 (31,600) -11%
Materials & Supplies 3,009,800 3,145,200 135,400 4%
Utility 407,200 448,700 41,500 9%
Insurance and Liability 1,234,200 1,307,100 72,900 6%
Rentals 275,200 155,100 (120,100) -77%
Miscellaneous 949,000 1,041,900 92,900 9%
15Expenses – Totals by Department
2022
2020 2021 2021 Proposed
Operating Expenditures Actuals Budget Forecast Budget 2022B to 2021B Change
Directly Operated Transportation
Fixed Route 15,851,200 17,498,300 17,056,900 22,648,300 5,150,000 29.4%
Dial-A-Ride 9,911,600 11,586,700 8,825,500 13,372,600 1,785,900 15.4%
General Demand (Prosser) 417,200 472,100 359,600 560,400 88,300 18.7%
Vanpool 1,425,400 1,700,200 1,168,500 1,680,200 (20,000) -1.2%
Maintenance 1,916,200 2,585,900 2,005,200 2,937,900 352,000 13.6%
Purchased Transportation
Paratransit - ARC 325,800 1,423,400 406,200 1,487,600 64,200 4.5%
Contracted Services 380,000 2,100,000 754,000 1,700,000 (400,000) -19.0%
Administration
Human Resources 1,521,800 1,733,500 1,607,200 2,336,900 603,400 34.8%
Safety / Training 1,171,300 953,000 1,029,900 1,270,700 317,700 33.3%
Executive / Administrative Service 4,935,100 4,841,900 3,947,300 5,821,400 979,500 20.2%
Marketing / Customer Service 1,328,500 2,182,400 1,482,500 2,702,900 520,500 23.8%
Planning / Service Development 864,500 1,408,700 978,900 1,572,300 163,600 11.6%
Total Operating Expenditures 40,048,600 48,486,100 39,621,700 58,091,200 9,605,100 19.8%
The following chart illustrates the changes by department from the 2021 budget to the 2022 budget. Of the total
increase of $9.6M, $7.0M is attributed to Operations which is driven almost entirely by the full year of service for
the service expansions added in 2021.
16Directly Operated Transportation (Fixed Route, Dial-A-Ride, General Demand & Vanpool)
The expenses in these departments have increased primarily due to the full year of service changes that were
implemented in 2021. Four (4) new operator headcount positions have been included in the 2022 proposed
budget. Vanpool is lower than the prior year budget due to an expected slower recovery for Vanpool operations.
Purchased Transportation (ARC and Connect)
Paratransit – ARC has been proposed based on the assumption that ARC will return to normal levels of activity in
2021. As previously mentioned, we expect the Connect service to grow slower than initially planned due to the
continuing impacts of COVID. Because of this, Connect is budgeted $400K, or 19%, lower in 2022 compared to
2021.
Administration
Costs associated with the various administration departments are budgeted to increase by a total of 23.2% over
the 2021 budget. No new headcount has been proposed for the administrative departments. This increase is due
to a full year of expenses associated with headcount that was approved in 2021, as well as increases in Professional
Services associated with projects and initiatives approved in prior years that were deferred/delayed. This includes
the resumption of Franklin-Covey training which was postponed in 2020 and 2021; the beginning of the ERP
evaluation project; new phone system implementation; additional communications and public outreach
associated with BFT’s 40th anniversary; and the reclassification of ADA support staff from Operations to
Marketing/Customer Service.
Overall, the 2022 budgeted Administrative Expenses represent 23% of total Operating Expenses, which is
unchanged from the 2021 budget.
Capital Budget
The Capital Improvement Plan (CIP) for 2021 – 2026 was approved by the Board of Directors in July 2021 with
project values totaling $142,940,931 and an approved budget of $52,611,826.
BFT does not use debt for any capital projects. All capital projects are funded on a pay-as-you-go basis using
federal and state grants to the maximum extent possible. Capital needs not funded with a grant are paid for using
reserves from local funds.
This proposed 2022 Capital Budget includes proposed changes to both the project values and approved budget.
The table below summarizes the proposed changes:
Project Value Budget
July 2021 Board Approved CIP $142,940,931 $52,611,826
Proposed Changes
Completed Projects ($2,400,000) ($2,400,000)
Project Removals ($3,769,192) ($3,769,192)
New Project Additions $150,000 $150,000
Project Additions/Increases $16,374,436 $36,002,055
Net Change $10,355,244 $29,982,863
Proposed 2022 Capital Budget $153,296,175 $82,594,689
17The detailed list of proposed project and budget changes are as follows:
Current Proposed Proposed
Current Project Approved Project Value Budget Adjusted Adjusted
Value Budget Change Change Project Value Budget
Fleet
FLT0020 (2019) VAN Up To 22 $787,380 $787,380 ($787,380) ($787,380) $0 $0
FLT0021 (2019) VAN Up To 40 $1,431,590 $1,431,590 ($1,431,590) ($1,431,590) $0 $0
FLT0025 (2020) VAN Up To 40 $1,460,222 $1,460,222 ($1,460,222) ($1,460,222) $0 $0
FLT0029 (2022) BUS Up To 3 $1,656,121 $0 $0 $1,656,121 $1,656,121 $1,656,121
FLT0030 (2022) BUS - Electric Up To 5 $4,961,250 $0 $0 $4,961,250 $4,961,250 $4,961,250
FLT0031 (2022) DAR Up To 12 $1,198,151 $0 $0 $1,198,151 $1,198,151 $1,198,151
FLT0033 (2022) Non-Revenue: Service Truck Up To 1 $65,564 $0 $39,436 $105,000 $105,000 $105,000
FLT0034 (2023) DAR Up To 12 $1,210,133 $0 $0 $1,210,133 $1,210,133 $1,210,133
Fleet Totals $12,770,411 $3,679,192 ($3,639,756) $5,451,463 $9,130,655 $9,130,655
Facilities
FAC0009 Street $2,400,000 $2,400,000 ($2,400,000) ($2,400,000) $0 $0
FAC0022 Transit Hubs (Connection Points) Up To 3 $8,000,000 $8,000,000 $0 $0 $8,000,000 $8,000,000
FAC0027 Land Acquisition $1,000,000 $1,000,000 $10,000,000 $10,000,000 $11,000,000 $11,000,000
FAC0032 Benton City Transit Facility $3,500,000 $0 $0 $1,000,000 $3,500,000 $1,000,000
FAC0033 Prosser Transit Facility $3,500,000 $0 $0 $1,000,000 $3,500,000 $1,000,000
FAC0034 Southridge Transit facility $3,500,000 $0 $0 $1,000,000 $3,500,000 $1,000,000
Facilities Totals $21,900,000 $11,400,000 $7,600,000 $10,600,000 $29,500,000 $22,000,000
Equipment
EQP0012 Mobile Dispatch Retrofit/Equipment $15,000 $15,000 $235,000 $235,000 $250,000 $250,000
Equipment Totals $15,000 $15,000 $235,000 $235,000 $250,000 $250,000
Transit Technologies
TEC0018 IT Related Projects - TBEST Planning Software $90,000 $90,000 ($90,000) ($90,000) $0 $0
TEC0019 Operations Simulator Training Unit $400,000 $0 $0 $400,000 $400,000 $400,000
TEC0020 Runcutter Software $0 $0 $150,000 $150,000 $150,000 $150,000
Transit Technology Totals $1,565,000 $165,000 $60,000 $460,000 $1,625,000 $625,000
Other
OTH0005 Business Continuity IT /Infrastructure/Website $200,000 $200,000 $100,000 $100,000 $300,000 $300,000
Other Totals $200,000 $200,000 $100,000 $100,000 $300,000 $300,000
MOA Campus
FAC0017 Operations Building Renovations $10,000,000 $2,863,600 $6,000,000 $13,136,400 $16,000,000 $16,000,000
MOA Totals $10,000,000 $2,863,600 $6,000,000 $13,136,400 $16,000,000 $16,000,000
CIP Totals for Items with Changes $10,355,244 $29,982,863
Projects Being Removed ($3,769,192) ($3,769,192)
Completed Projects Removed ($2,400,000) ($2,400,000)
New Project Additions $150,000 $150,000
Project Increases for Existing Projects $16,374,436 $36,002,055
Net Change $10,355,244 $29,982,863
Removal of Closed/Completed Projects
Project FAC0009, Renovation of Knight Street Transit Center, and Project TEC0018 – TBEST Planning Software have
been completed and are ready to close and remove from the CIP.
FLT0020, FLT0021, and FLT0025 are for Vanpool purchases and are being removed from the CIP. These were
purchases that were previously approved and planned for 2019 – 2020. Given the lack of state funding for Vanpool
purchases, and the current status of the Vanpool program in general, BFT management does not plan on moving
forward with these purchases. Vanpool purchases that were previously added to the CIP for 2021 and later will
remain in the CIP.
18New Projects Being Added to the 2022 Capital Budget
One new project is being proposed for 2022. This is project TEC0020 for Runcutter planning software. This project
seeks to procure, install, and set up a scheduling and runcutting software system for fixed route service. BFT
currently performs this function using Microsoft Excel. The advantage of using a specialized software platform is
that the systems are designed to optimize service and performance within industry standards and are customized
to labor provisions in CBAs. BFT expects to recover the cost of the software through improved operational
(scheduling) efficiency and making new services more reliable at the outset.
Proposed Changes to Existing Projects
Budget authority is being requested for multiple fleet projects with planned acquisition dates in 2022. Budget is
also being requested for FLT0034, which is for the purchase of up to 12 Dial-A-Ride vehicles. Although this project
is scheduled for 2023, the vehicles will need to be ordered in 2022 to ensure delivery in 2023 before the associated
grant funds expire.
Budget authority is also being requested for projects FAC0027, FAC0032, FAC0033, and FAC0034. These projects
are for land acquisitions in West Pasco, Benton City, Prosser, and the Southridge area of Kennewick and directly
support the strategic initiative to advance and adapt system for future regional growth.
Project Value and Budget Authority are proposed for project EQP0012. This project is to retrofit an existing fleet
vehicle with the equipment necessary to create a Mobile Command Vehicle (MCV). A MCV supports the
operational mission through the provision of mobile, on-site platforms for command, control, and
communications during natural disasters, accidents, special services, and other similar occurrences.
Budget authority is being requested for the TEC0019, Operations Simulator Training Unit, so that unit can be
ordered in 2022 for delivery once the Operations building construction has been completed.
Project value and budget authority are being proposed to increase for OTH0005, Business Continuity, IT
Infrastructure, and Website Replacement, to support the planned activities for 2022.
Project FAC0017 is for the construction of the new Operations building. With design reaching the 90% completion
level, updated budgetary estimates are available. This project was first added to the CIP in 2018 with a rough
estimated cost of $10M. Since then, construction prices have increased dramatically and the A&E firm supporting
the project has updated cost estimates of $16M. Therefore, an increase in the project value of $6M is being
proposed as well as a proposed increase of $13.1M of budget authority. This would bring the project value and
budget authority to $16M as construction is expected to begin in early 2022. This project will be funded primarily
with local funds which will be covered through existing and planned reserves.
19Appendix 1 – Operating & Capital Budget Details
2021 Budget Forecast as of August 31, 2021
Budget August Forecast Variance Var %
Revenues (Local)
Fares - Direct Operations 1,783,800 358,200 537,400 (1,246,400) -69.9%
Fares - Contracted Services 289,200 - - (289,200) -100.0%
Sales Tax 40,200,000 30,107,000 46,000,000 5,800,000 14.4%
Other 500,000 653,800 911,000 411,000 82.2%
Revenues (State)
Consolidated/Special Needs/Regional Mobility 650,000 514,300 731,000 81,000 12.5%
Revenues (Federal)
Formula Funds 11,384,300 7,589,500 11,384,300 - 0.0%
Total Revenues 54,807,300 39,222,800 59,563,700 4,756,400 8.7%
Operating Expenditures
Directly Operated Transportation
Bus 17,498,300 11,778,300 17,056,900 (441,400) -2.5%
Dial-A-Ride 11,586,700 6,397,700 8,825,500 (2,761,200) -23.8%
Prosser 472,100 254,700 359,600 (112,500) -23.8%
Vanpool 1,700,200 820,500 1,168,500 (531,700) -31.3%
Maintenance 2,585,900 1,652,800 2,005,200 (580,700) -22.5%
Purchased Transportation
Paratransit ARC 1,423,400 266,500 406,200 (1,017,200) -71.5%
Contracted Services 2,100,000 502,600 754,000 (1,346,000) -64.1%
General Administration
Human Resources 1,733,500 1,094,600 1,607,200 (126,300) -7.3%
Safety / Training 953,000 741,500 1,029,900 76,900 8.1%
Executive / Administrative Services 4,841,900 2,755,100 3,947,300 (894,600) -18.5%
Marketing / Customer Service 2,182,400 920,800 1,482,500 (699,900) -32.1%
Planning / Service Development 1,408,700 672,500 978,900 (429,800) -30.5%
Total Operating Expenditures 48,486,100 27,857,600 39,621,700 (8,864,400) -18.3%
Capital Expenditures
Capital Projects 5,725,168 2,672,200 5,725,168 - 0.0%
Total Capital Expenditures 5,725,168 2,672,200 5,725,168 - 0.0%
Federal State Local Total
Fleet Program 1,392,923 600,000 485,380 2,478,303
Facilities Program 864,000 - 716,000 1,580,000
Safety & Security Program 100,000 - 25,000 125,000
Transit Technologies Program 212,000 - 729,865 941,865
Planning Program - - 400,000 400,000
Other Program 200,000 - - 200,000
Total Capital Projects 2,768,923 600,000 2,356,245 5,725,168
20BFT 2022 Budget
Major Objectives
Primary Secondary
Address Community Growth Address Community Demographics
Maximize Community Outreach & Involvement Participate Economic Development
Implement Succession Planning & Staff Development Plan for Para-Transit Demographic Shifts
Integrate Technology
Pursue Environmentally Friendly Buses
Major Assumptions
Service Level
Directly Operated Revenue Hours Revenue Miles Boardings
Fixed route 214,000 3,368,000 2,113,000
Dial-A-Ride & General Demand 130,800 2,132,000 302,000
Vanpool 38,000 1,663,000 340,000
Purchased Transportation Annual Amount
Paratransit - ARC 14,000 223,000 78,000 $ 1,487,605
Contracted Services 36,000 376,000 31,000 1,700,000
432,800 7,762,000 2,864,000 $ 3,187,605
Work Force 2021 Budget 2021 Approved 2022 Request Change
Operations 160 184 188 4
Dial-A-Ride 119 118 118 -
General Demand 5 5 5 -
Vanpool 4 4 4 -
Maintenance 45 49 49 -
Human Resources 8 9 9 -
Safety / Training 7 10 10 -
Executive / Administrative Services 21 23 23 -
Marketing / Customer Service 16 20 20 -
Planning / Service Dev 9 11 11 -
Total Work Force 393 432 436 4
2021 Forecast 2022 Budget Var
Revenue
Fares $ 537,400 $ 2,146,400 $ 1,609,000
Sales Tax 46,000,000 48,127,500 2,127,500
Misc. Revenue 911,000 374,200 (536,800)
State Grants 731,000 1,370,697 639,697
Federal Grants 11,384,300 18,885,353 7,501,053
$ 59,563,700 $ 70,904,150 # $ 11,340,450
Expense
Salary / Wage $ 18,758,600 $ 25,953,100 $ 7,194,500
Benefits 10,406,200 14,474,700 4,068,500
Salary / Wage Increase $ 29,164,800 $ 40,427,800 $ 11,263,000
HEALTH INSURAN
Health Insurance (average) $ 1,341 $ 1,391 $ 1,559,437 WORKERS COMPEN
State Industrial Insurance per Hour 0.14175 / 1.5766 0.14266 / 1.6099 $ 411,268 PAID FML/STATE
WA State FML Act $ 0.3667 $ 0.3667 $ (54,223) PERS/STATE RETIR
Retirement Contribution (%) 10.25% 10.25% $ 239,206
Professional Services $ 2,122,200 $ 4,675,700 $ 2,553,500
Fuel & Lubricants 2,212,000 3,639,300 1,427,300
Tires & Tubes 212,700 300,400 87,700
Materials & Supplies 2,643,600 3,145,200 501,600
Utility 408,800 448,700 39,900
PL / PD Insurance (WSTIP) 1,192,100 1,307,100 115,000
Purchased Transportation 1,028,300 2,950,000 1,921,700
Rentals 260,300 155,100 (105,200)
Miscellaneous 376,900 1,041,900 665,000
Total Non-Labor $ 10,456,900 $ 17,663,400 # $ 7,206,500
212021 Year-end Estimates / 2022 Proposal
Boardings Revenue Hours Revenue Miles
Total
Total 2021 Budget 2,934,000 465,000 9,253,000
Total 2021 Estimate 1,957,000 353,100 6,266,000
Total 2022 Proposed 2,864,000 432,800 7,762,000
Proposed % Change Over Estimate 46.3% 22.6% 23.9%
Proposed % Change Over 2021 Budget -2.4% -6.9% -16.1%
Directly Operated
Fixed Route Total 2021 Budget 1,830,000 206,000 3,242,000
Total 2021 Estimate 1,524,000 194,000 3,053,000
Proposed % Change Over Estimate 38.6% 10.3% 10.3%
2022 Proposed 2,113,000 214,000 3,368,000
Proposed % Change Over 2021 Budget 15.5% 3.9% 3.9%
DAR Tri-Cities Total 2021 Budget 270,000 119,000 1,825,000
Total 2021 Estimate 209,000 98,000 1,569,000
Proposed % Change Over Estimate 32.1% 26.5% 26.6%
2022 Proposed 276,000 124,000 1,986,000
Proposed % Change Over 2021 Budget 2.2% 4.2% 8.8%
Prosser Total 2021 Budget 21,000 4,000 96,000
Total 2021 Estimate 12,000 4,500 104,000
Proposed % Change Over Estimate 116.7% 51.1% 40.4%
2022 Proposed 26,000 6,800 146,000
Proposed % Change Over 2021 Budget 23.8% 70.0% 52.1%
Vanpool Total 2021 Budget 595,000 75,000 3,100,000
Total 2021 Estimate 162,000 26,000 1,194,000
Proposed % Change Over Estimate 109.9% 46.2% 39.3%
2022 Proposed 340,000 38,000 1,663,000
Proposed % Change Over 2021 Budget -42.9% -49.3% -46.4%
Purchased
Paratransit - Arc Total 2021 Budget 73,000 15,000 240,000
Total 2021 Estimate 26,000 4,600 74,000
Proposed % Change Over Estimate 200.0% 204.3% 201.4%
2022 Proposed 78,000 14,000 223,000
Proposed % Change Over 2021 Budget 6.8% -6.7% -7.1%
Connect Total 2021 Budget 145,000 46,000 750,000
Total 2021 Estimate 24,000 26,000 272,000
Proposed % Change Over Estimate 29.2% 38.5% 38.2%
2022 Proposed 31,000 36,000 376,000
Proposed % Change Over 2021 Budget -78.6% -21.7% -49.9%
222022 Budget Build Analysis
2022
2019 2020 2021 2021 Proposed 2022 Budget over
Operating Expense Actuals Actuals Budget Forecast Budget 2021 Budget
Salaries & Wages 16,492,100 17,367,300 20,287,000 18,758,600 25,953,100 5,666,100 27.9%
Employee Benefits 10,193,900 12,960,500 12,491,000 10,406,200 14,474,700 1,983,700 15.9%
Total Labor 26,686,000 30,327,800 32,778,000 29,164,800 40,427,800 7,649,800 23.3%
Professional Services 3,269,500 2,526,000 3,860,000 2,122,200 4,675,700 815,700 21.1%
Fuel & Lubricants 2,648,600 1,394,900 2,290,700 2,212,000 3,639,300 1,348,600 58.9%
Tires & Tubes 330,000 218,300 332,000 212,700 300,400 (31,600) -9.5%
Materials & Supplies 2,368,200 2,810,600 3,009,800 2,643,600 3,145,200 135,400 4.5%
Utility 294,200 416,600 407,200 408,800 448,700 41,500 10.2%
Insurance and Liability 1,157,500 1,381,600 1,234,200 1,192,100 1,307,100 72,900 5.9%
Purchased Transportation 1,073,000 571,900 3,350,000 1,028,300 2,950,000 (400,000) -11.9%
Rentals 78,900 99,200 275,200 260,300 155,100 (120,100) -43.6%
Miscellaneous 427,900 301,700 949,000 376,900 1,041,900 92,900 9.8%
Total Non-Labor 11,647,800 9,720,800 15,708,100 10,456,900 17,663,400 1,955,300 12.4%
Total Operating Expense 38,333,800 40,048,600 48,486,100 39,621,700 58,091,200 9,605,100 19.8%
2022
2019 2020 2021 2021 Proposed 2022 Budget over
Operating Expenditures Actuals Actuals Budget Forecast Budget 2021 Budget
Directly Operated Transportation
Fixed Route 14,980,600 15,851,200 17,498,300 17,056,900 22,648,300 5,150,000 29.4%
Dial-A-Ride 10,726,200 9,911,600 11,586,700 8,825,500 13,372,600 1,785,900 15.4%
General Demand (Prosser) 504,200 417,200 472,100 359,600 560,400 88,300 18.7%
Vanpool 1,953,600 1,425,400 1,700,200 1,168,500 1,680,200 (20,000) -1.2%
Maintenance 1,902,900 1,916,200 2,585,900 2,005,200 2,937,900 352,000 13.6%
Purchased Transportation
Paratransit - ARC 1,284,300 325,800 1,423,400 406,200 1,487,600 64,200 4.5%
Contracted Services - 380,000 2,100,000 754,000 1,700,000 (400,000) -19.0%
Administration
Human Resources 1,387,900 1,521,800 1,733,500 1,607,200 2,336,900 603,400 34.8%
Safety / Training 966,100 1,171,300 953,000 1,029,900 1,270,700 317,700 33.3%
Executive / Administrative Service 2,617,000 4,935,100 4,841,900 3,947,300 5,821,400 979,500 20.2%
Marketing / Customer Service 1,293,700 1,328,500 2,182,400 1,482,500 2,702,900 520,500 23.8%
Planning / Service Development 717,300 864,500 1,408,700 978,900 1,572,300 163,600 11.6%
Total Operating Expenditures 38,333,800 40,048,600 48,486,100 39,621,700 58,091,200 9,605,100 19.8%
232022 Budget ($)
Total Operating Capital Reserves
Revenues
Local
Fares 1,946,400 1,946,400 - -
Contracted Services 200,000 200,000 - -
Sales Tax 48,127,500 35,314,550 12,812,950 -
Other 374,200 374,200 - -
Reserve Funds 15,016,056 - 15,016,056 -
Total Local 65,664,156 37,835,150 27,829,006 -
State
Consolidated / Planning Grant 50,000 50,000 - -
Dept. of Ecology Grant 1,500,000 - 1,500,000 -
Special Needs 3,728,981 1,320,697 2,408,284 -
Vanpool Investment Program - - - -
Total State 5,278,981 1,370,697 3,908,284 -
Federal
CRRSSA 8,460,568 8,460,568 - -
ARP 10,424,785 10,424,785 - -
FFY 2017 5307 Formula 684,789 - 684,789 -
FFY 2017 5339 Bus/Facilities Formula 722,914 - 722,914 -
FFY 2018 5307 Formula 3,007,062 - 3,007,062 -
Total Federal 23,300,118 18,885,353 4,414,765 -
Total Revenues $ 94,243,255 $ 58,091,200 $ 36,152,055 $ -
Expenditures
Operating Expenditures
Bus Operations 22,648,300 22,648,300 - -
Dial-A-Ride 13,372,600 13,372,600 - -
General Demand 560,400 560,400 - -
Vanpool 1,680,200 1,680,200 - -
Maintenance 2,937,900 2,937,900 - -
Human Resources 2,336,900 2,336,900 - -
Safety / Training 1,270,700 1,270,700 -
Executive / Administrative Services 5,821,400 5,821,400 - -
Marketing / Customer Service 2,702,900 2,702,900 - -
Planning / Service Dev / Purchased Transportation 4,759,900 4,759,900 - -
Total Operating Expenditures 58,091,200 58,091,200 - -
Capital Program Expenditures
Fleet Program 9,130,655 - 9,130,655 -
Facilities Program 26,136,400 - 26,136,400 -
Equipment Program 235,000 - 235,000 -
Transit Technologies Program 650,000 - 650,000 -
Total Capital Expenditures 36,152,055 - 36,152,055 -
Total Expenditures $ 94,243,255 $ 58,091,200 $ 36,152,055 $ -
242022 Capital Budget - Details
Funding Sources
Source Local State Federal Total
Local
Sales Tax 12,540,350 - - 12,540,350
Reserves 14,186,050 - - 14,186,050
Local 26,726,400 - - 26,726,400
State
Dept. of Ecology Grant 300,000 1,500,000 - 1,800,000
Special Needs Funding - 2,408,284 - 2,408,284
State 300,000 3,908,284 - 4,208,284
Federal
FFY 2017 5307 Formula 120,845 - 684,789 805,634
FFY 2017 5339 Bus/Facilities Formula 127,573 - 722,914 850,487
FFY 2018 5307 Formula 554,188 - 3,007,062 3,561,250
Federal 802,606 - 4,414,765 5,217,371
Total $ 27,829,006 $ 3,908,284 $ 4,414,765 $ 36,152,055
2022 Capital Budget - Details
Project Details
Capital Project Local State Federal Total
Fleet
Fixed Route - 3 248,418 - 1,407,703 1,656,121
Fixed Route Electric - 5 774,188 1,500,000 2,687,062 4,961,250
DAR - 24 - 2,408,284 - 2,408,284
Non-Revenue Service Vehicle - 1 105,000 - - 105,000
Fleet Program 1,127,606 3,908,284 4,094,765 9,130,655
Facilities
Land Acquisition 10,000,000 - - 10,000,000
Operations Building 13,136,400 - - 13,136,400
Benton City Transit Facility 1,000,000 - - 1,000,000
Prosser Transit Facility 1,000,000 - - 1,000,000
Southridge Transit facility 1,000,000 - - 1,000,000
Facilities Program 26,136,400 - - 26,136,400
Equipment
Mobile Dispatch Retrofit/Equipment 235,000 - - 235,000
Equipment Program 235,000 - - 235,000
Transit Technology
Business Continuity IT Equipment & Infrastructure 100,000 - - 100,000
Operations Simulator Training Unit 80,000 - 320,000 400,000
Runcutter Software 150,000 - - 150,000
Transit Technologies Program 330,000 - 320,000 650,000
Total $ 27,829,006 $ 3,908,284 $ 4,414,765 $ 36,152,055
2526
Appendix 2 – Department Accomplishments, Goals and Initiatives
and Budgets

                 Administrative Services Department
The Administrative Services Department is comprised of several functional areas.

•   Administrative Services is responsible for responding to public records requests; overseeing the
    administration and policies regarding agency travel; and general support and guidance on a variety of special
    projects. This department is also responsible for the overall development and coordination of the Technology
    Roadmap for BFT.
•   Executive Office/General Manager carries out the Board’s policies and ordinances, coordinates inter-agency
    activities, oversees BFT’s day-to-day operations, and appoints the Directors of BFT’s operating departments.
    This also includes activities such as all Board of Directors interactions, including Board Resolutions; and
    providing guidance and direction for all activities of BFT, including advisory services to staff and management.
•   Finance and Accounting/Grants Management is responsible for all management and oversight relating to
    BFT’s finances. This includes activities such as accounting, audit, and compliance; financial reporting,
    budgeting and planning; provides administration of all federal, state and local grants; and oversight of the
    Capital Improvement Plan (CIP).
•   Information Technology manages and oversees the deployment and support of agency hardware and
    software; establishes agency-wide technology policies and procedures; serves as subject matter experts for
    Information Technology (IT) and Intelligent Transportation Systems (ITS); serves as liaisons with outside
    agencies and vendors on behalf of the agency for technology and systems issues; influences technology
    direction, selection, and procurements for the agency; and directly supports projects and special operations.
•   Procurement manages and oversees the acquisition and contract administration functions related to
    construction, professional and non-professional services, vehicles, and equipment/supply contracts; and
    reviews, analyzes, and applies all agency policies and applicable federal, state, and local contracting
    regulations.

                                        Administrative Services Department

                                   Department      Department Name

                                        70         Board of Directors

                                        71         Executive Office

                                        72         Administrative Services

                                        73         Finance and Accounting

                                        74         Information Technology

                                        75         Contracts and Purchasing

                                                        27
28
2022
                             2019        2020        2021        2021      Proposed     2021F to    2021B to
          Expense          Actuals     Actuals     Budget      Forecast     Budget    2022B Var % 2022B Var %
Salaries & Wages             947,800   1,253,200   1,541,000   1,319,600    1,753,100       32.9%       13.8%
Employee Benefits             96,800   1,856,000     778,200     666,100      893,700       34.2%       14.8%
Total Labor                1,044,600   3,109,200   2,319,200   1,985,700    2,646,800       33.3%       14.1%
Professional Services        679,000     563,000   1,010,800     596,200    1,431,300     140.1%        41.6%
Fuel & Lubricants                -           -           -           -            -          0.0%        0.0%
Tires & Tubes                    -           -           -           -            -          0.0%        0.0%
Materials & Supplies         278,200     572,700     639,300     600,800      708,700       18.0%       10.9%
Utilities                    257,900     288,300     270,000     286,100      302,300        5.7%       12.0%
Insurance & Liability        169,700     227,500     233,900     250,100      318,200       27.2%       36.0%
Purchased Transportation         -           -           -           -            -          0.0%        0.0%
Rentals                       19,500      23,500      66,300      60,500       32,800      -45.8%      -50.5%
Miscellaneous                168,100     150,900     302,400     167,900      381,300     127.1%        26.1%
Total Non-Labor            1,572,400   1,825,900   2,522,700   1,961,600    3,174,600      61.8%       25.8%
Total Operating Expenses   2,617,000   4,935,100   4,841,900   3,947,300    5,821,400      47.5%       20.2%

                                                        29
2021 Major Accomplishments
1. Launched MyBFT, BFT’s first agency-wide intranet Sharepoint site. Phase 1 of posting all policies,
procedures, forms, resolutions and introduction of basic communication has been completed. Phase 2
has started which involves automating workflows and enhancing department functionality.
2. Implemented electronic signatures to facilitate workflows and dispersed operations.
3. Clean Financial and Accountability audit reports received with no audit findings.
4. Received Certificate of Achievement for Excellence in Financial Reporting for the ninth consecutive year
5. NTD Ridership audit completed and accepted by FTA
6. Implemented changes and retroactive adjustments associated with the completion of negotiations of
several CBAs.
7. Awarded contract and began work on BFT’s first ever comprehensive fare study. Project will continue into
2022.
8. Created and developed agency’s first ever technology roadmap that brings comprehensive planning,
communication, and alignment of priorities across all departments of the agency.
9. Procured and implemented a large number of iPads to support remote meetings, training and
communications for a large workforce that do not have assigned computers.
10. Implemented new procurement software tool that integrates with BFT’s website to streamline the way
bid and proposals are received, evaluated and awarded.
11. Implemented a new fuel fleet card contract
12. Implement a resilient, high speed virtual Server environment to replace the aging and End-of-Life physical
server environment including a migration of core applications and services from old physical server
environment to the new virtual environment.
13. In recognition of their outstanding service and support during such a challenging year, the IT Team was
recognized as the BFT Team of the Year.
14. Perform several major updates for Transit technology, including Several core updates to Rangers and
other devices on Fixed Route and DAR vehicles.
15. Finance worked with Customer Service to implement changes and streamline pass and ticket outlet
processing, deliveries and invoicing to increase efficiency and minimize physical contact risks.
16. Coordinated agency-wide review of policies and consolidated and organized into MyBFT making them
available to all employees. Policies have now been identified to provide clear ownership, timing of
reviews and updates and updated the policy template to make them easier to manage and track.
17. Changed Internet Service Provider (ISP) for all BFT locations increasing data speeds by 2x – 3x over existing
connection speeds.
2022 Goals
1. Pursue Operational Excellence by growing and developing People, Processes & Tools
2. Transform IT into a value-creating organization
3. Create a culture of Data Driven Decision making by implementing tools, technology, processes to provide
readily available data to users to enable use of timely and reliable data to quickly make decisions
4. Continue to provide excellent Administrative Services support
5. Meet all regulatory and compliance obligations with excellence
6. Modernize and transform agency IT Tools and Infrastructure
2022 Detailed Goals
1. Pursue Operational Excellence by growing and developing People, Processes & Tools
a. Complete comprehensive fare study that was started in late 2021.
30b. Continue to provide online training to staff for personal development growth as well as improving
technical and technology skills.
c. Continue to identify and implement process improvements and eliminate non-valued added processes
& activities.
d. Transition from an Excel spreadsheet contract tracking system to a software tool based tracking
system. ProcureNow, a current tool being utilized, will be further implemented and utilized for
reporting, data management, tracking, and communications with procurement and project managers.
e. Further utilization and implementation of existing tools to use standardized IFB, RFP and RFQ
templates. This will improve procurement accuracy, timeliness and streamlined T&C’s processes.
f. Continue selection and implementation of a records management/records retention tool that meets
the various regulatory requirements while improving internal records management practices.
2. Continue transformation the IT Department into a value-creating organization.
a. Transform IT from a “fix-it” organization to driving, creating and supporting the tools and workflows of
the future of the “new normal” (ongoing).
b. Staff and organize the IT team to provide extended hours IT support for core systems and
technologies (ongoing).
c. Be a value-added business partner through the entire selection and implementation process of several
agency-wide software implementations (ongoing).
d. Create and improve meeting rooms and technological infrastructure to support remote Board &
Committee meetings as well as facilitating internal meetings (ongoing).
e. Develop standardized training and documentation for BFT staff on use of IT resources (ongoing).
3. Create a culture of Data Driven Decision making by implementing tools, technology, processes to provide
readily available data to users to enable use of timely and reliable data to quickly make decisions
a. Work with other departments to select and implement Business Intelligence/Dashboarding software
tools.
b. Continue working with other departments to further identify performance metrics to measure and
report
c. Work with other departments to streamline access to data sources and ensure data integrity.
d. Implement a Budgeting, Planning and Reporting software tool that will drastically reduce the time
spent in spreadsheets for budget preparation to allow more time for analysis and discussion of
budget. The tool will also be the interface between the core accounting system and the Business
Intelligence/Dashboarding tool. Financial forecasts and scenario analysis can be automated so that
impacts of various decisions can rapidly be determined and discussed to drive data driven decision
making.
e. Migrate excel-based Capital Improvement Plan process to SmartSheet to automate the entire CIP
process, management and reporting.
4. Continue to provide excellent Administrative Services support
a. Select and implement a travel and expense reporting tool and process to streamline Travel Desk
Operations.
b. Support major initiatives of other departments and cross-functional teams as needed.
c. Provide support during CBA negotiations.
d. Implement update Chart of Accounts to ensure regulatory compliance while simplifying and
improving internal reporting and analysis.
e. Continue reviewing and updating all accounting and financial policies and improve organization and
access to policies using tools such as Sharepoint.
f. Update procurement policy with process improvements. Review and benchmark purchasing
thresholds and make recommendations for change as appropriate.
g. Implement new mandatory Washington State Long-Term Care tax and associated new LTC benefit
plan.
5. Meet all regulatory and compliance obligations with excellence
a. Clean and timely audits (Financial, Federal, Accountability, NTD, etc.)
31You can also read