2022 Community Health Needs Assessment - 2550 Sister Mary Columba Drive Red Bluff CA 96080
←
→
Page content transcription
If your browser does not render page correctly, please read the page content below
2022 Community Health Needs Assessment

                        Conducted on behalf of

               2550 Sister Mary Columba Drive
                     Red Bluff CA 96080

                            Conducted by

Adopted by the Dignity Health North State community board in April 2022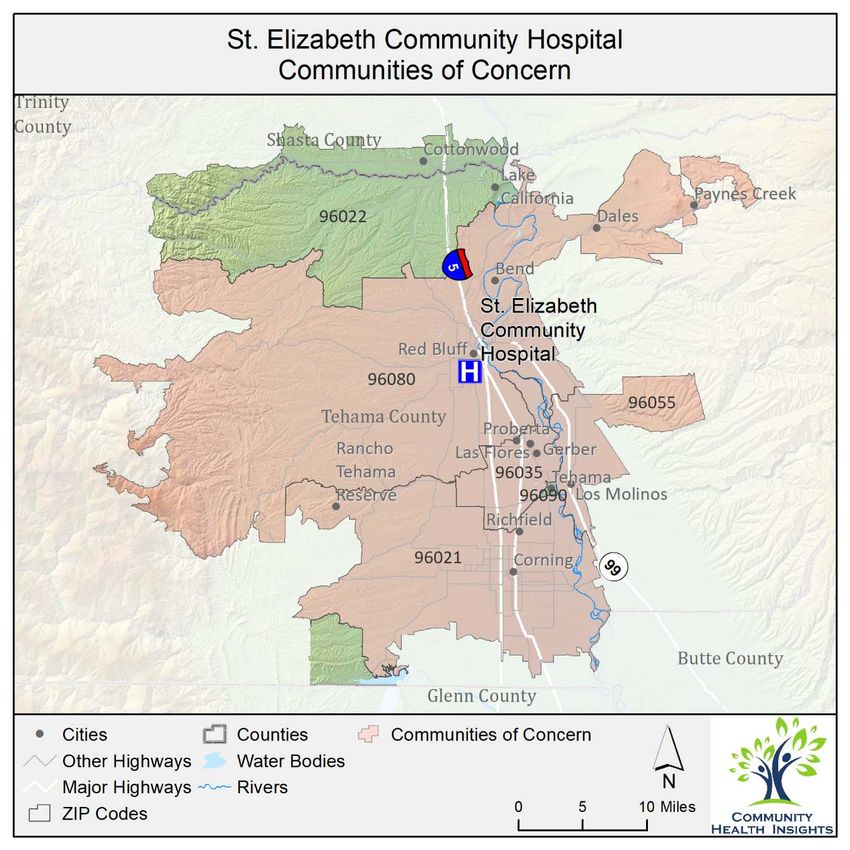
Acknowledgments
We are deeply grateful to all those who contributed to the community health needs assessment
conducted on behalf of St. Elizabeth Community Hospital. Many dedicated community health experts
and members of various social service organizations serving the most vulnerable members of the
community gave their time and expertise as key informants to help guide and inform the findings of the
assessment. Many community residents also participated and volunteered their time to tell us what it is
like to live in the community and shared the challenges they face trying to achieve better health. To
everyone who supported this important work, we extend our heartfelt gratitude.

Community Health Insights (www.communityhealthinsights.com) conducted the assessment on behalf
of St. Elizabeth Community Hospital. Community Health Insights is a Sacramento‐based research‐
oriented consulting firm dedicated to improving the health and well‐being of communities across
Central and Northern California. This joint report was authored by:

  •     Dale Ainsworth, PhD, MSOD, Managing Partner of Community Health Insights and Associate
        Professor of Public Health at California State University, Sacramento
  •     Heather Diaz, DrPH, MPH, Managing Partner of Community Health Insights and Professor of
        Public Health at California State University, Sacramento
  •     Mathew Schmidtlein, PhD, MS, Managing Partner of Community Health Insights and Professor
        of Geography at California State University, Sacramento
  •     Traci Van, Senior Community Impact Specialist of Community Health Insights

This community health needs assessment report was adopted by the Dignity Health North State
community board in April 2022. The report is widely available to the public on the hospital’s web site
(https://www.dignityhealth.org/north‐state/locations/stelizabethhospital, as of April 2022), and a paper
copy is available for inspection upon request at the hospital’s community health office. Written
comments on this report can be submitted to St. Elizabeth Community Hospital, Attn: Community
Health, 2550 Sister Mary Columba Drive, Red Bluff, CA 96080.

                                                                                                       2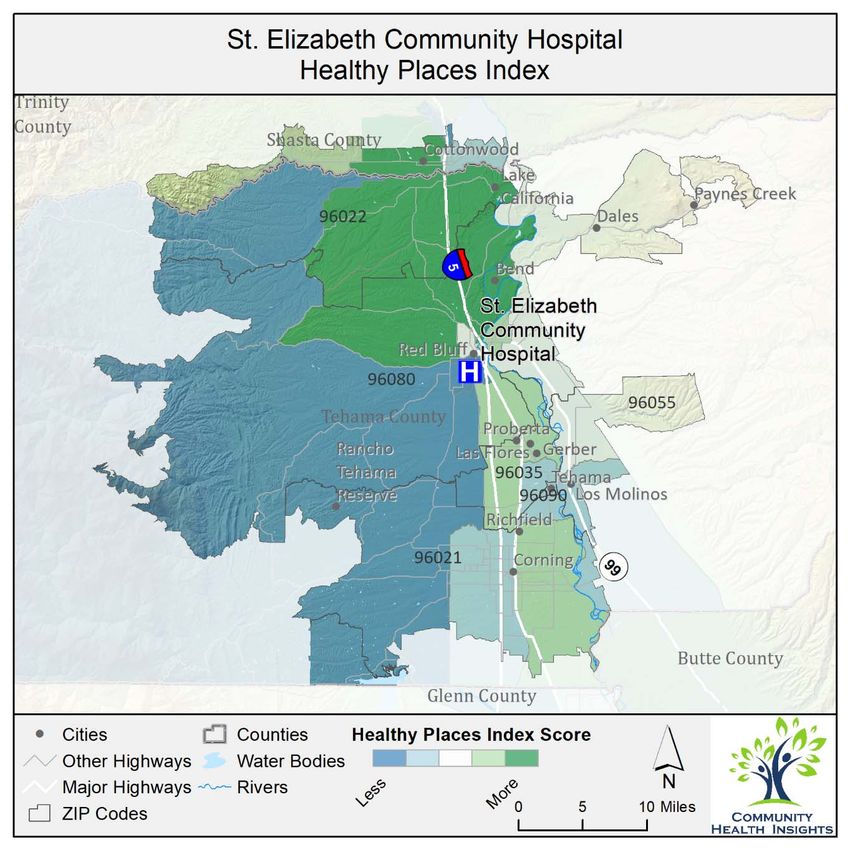
Table of Contents
Report Summary ........................................................................................................................................... 6
   Purpose ..................................................................................................................................................... 6
   Community Definition .............................................................................................................................. 6
   Assessment Process and Methods ........................................................................................................... 6
   Process and Criteria to Identify and Prioritize Significant Health Needs ................................................. 7
   List of Prioritized Significant Health Needs .............................................................................................. 7
   Resources Potentially Available to Meet the Significant Health Needs ................................................... 7
   Conclusion ................................................................................................................................................ 7
Introduction and Purpose ............................................................................................................................. 8
Findings ......................................................................................................................................................... 8
   Prioritized Significant Health Needs ......................................................................................................... 8
Methods Overview...................................................................................................................................... 17
   Conceptual and Process Models ............................................................................................................ 17
   Public Comments from Previously Conducted CHNAs ........................................................................... 17
   Data Used in the CHNA ........................................................................................................................... 17
   Data Analysis .......................................................................................................................................... 18
Description of Community Served .............................................................................................................. 18
Health Equity ............................................................................................................................................... 20
   Health Outcomes ‐ the Results of Inequity ............................................................................................ 21
   Health Factors ‐ Inequities in the Service Area ...................................................................................... 21
   Population Groups Experiencing Disparities .......................................................................................... 22
California Healthy Places Index ................................................................................................................... 23
Communities of Concern ............................................................................................................................ 24
The Impact of COVID‐19 on Health Needs.................................................................................................. 26
Resources Potentially Available to Meet the Significant Health Needs ..................................................... 27
Impact and Evaluation of Actions Taken by Hospital.................................................................................. 28
Conclusion ................................................................................................................................................... 28
2022 CHNA Technical Section ..................................................................................................................... 29
   Results of Data Analysis .......................................................................................................................... 29
      Compiled Secondary Data .................................................................................................................. 29
      Length of Life ...................................................................................................................................... 29
      Quality of Life ..................................................................................................................................... 31
      Health Behavior .................................................................................................................................. 32
      Clinical Care ........................................................................................................................................ 33
      Socio‐Economic and Demographic Factors ........................................................................................ 34
      Physical Environment ......................................................................................................................... 36
   CHNA Methods and Processes ............................................................................................................... 37
      Primary Data Collection and Processing ............................................................................................ 41
      Secondary Data Collection and Processing ........................................................................................ 45
   Detailed Analytical Methodology ........................................................................................................... 59
      Community of Concern Identification ................................................................................................ 60
      Significant Health Need Identification ............................................................................................... 61
      Health Need Prioritization .................................................................................................................. 75
   Detailed List of Resources to Address Health Needs ............................................................................. 76
Limits and Information Gaps....................................................................................................................... 80
Appendix A – Impact of Actions Taken ....................................................................................................... 81

                                                                                                                                                                  3
List of Tables
Table 1: Health need prioritization inputs for SECH service area. ................................................................ 9
Table 2: Population characteristics for each ZIP code located in the SECH service area. .......................... 20
Table 3: Health outcomes comparing race and ethnicity in the SECH service area. .................................. 21
Table 4: Health factors comparing race and ethnicity in the SECH service area. ....................................... 21
Table 5: Identified Communities of Concern for the SECH service area..................................................... 25
Table 6: COVID‐19‐related rates for the SECH service area........................................................................ 26
Table 7: The impacts of COVID‐19 on health need as identified in primary data sources. ........................ 27
Table 8: Resources potentially available to meet significant health needs in priority order. .................... 28
Table 9: County length of life indicators compared to state benchmarks. ................................................ 29
Table 10: County quality of life indicators compared to state benchmarks. .............................................. 31
Table 11: County health behavior indicators compared to state benchmarks. ......................................... 32
Table 12: County clinical care indicators compared to state benchmarks. ................................................ 33
Table 13: County socio‐economic and demographic factors indicators compared to state benchmarks. 34
Table 14: County physical environment indicators compared to state benchmarks. ................................ 36
Table 15: Key Informant List ....................................................................................................................... 42
Table 16: Focus Group List .......................................................................................................................... 44
Table 17: Mortality indicators used in Community of Concern Identification ........................................... 46
Table 18: Health factor and health outcome indicators used in health need identification. ..................... 48
Table 19: Sources and time periods for indicators obtained from County Health Rankings...................... 52
Table 20: 2022 Potential Health Needs. ..................................................................................................... 62
Table 21: Primary themes and secondary indicators associated with PHN1.............................................. 63
Table 22: Primary themes and secondary indicators associated with PHN2.............................................. 64
Table 23: Primary themes and secondary indicators associated with PHN3.............................................. 65
Table 24: Primary themes and secondary indicators associated with PHN4.............................................. 66
Table 25: Primary themes and secondary indicators associated with PHN5.............................................. 66
Table 26: Primary themes and secondary indicators associated with PHN6.............................................. 67
Table 27: Primary themes and secondary indicators associated with PHN7.............................................. 67
Table 28: Primary themes and secondary indicators associated with PHN8.............................................. 68
Table 29: Primary themes and secondary indicators associated with PHN9.............................................. 69
Table 30: Primary themes and secondary indicators associated with PHN10............................................ 70
Table 31: Primary themes and secondary indicators associated with PHN11............................................ 71
Table 32: Primary themes and secondary indicators associated with PHN12............................................ 72
Table 33: Benchmark comparisons to show indicator performance. ......................................................... 73
Table 34: Resources available to meet health needs. ................................................................................ 76

                                                             List of Figures
Figure 1: Prioritized significant health needs for SECH service area. ......................................................... 10
Figure 2: Community served by SECH. ........................................................................................................ 19
Figure 3: Healthy Places Index for SECH. .................................................................................................... 24
Figure 4: SECH Communities of Concern. ................................................................................................... 26
Figure 5: Community Health Assessment Conceptual Model as modified from the County Health
Rankings Model, Robert Wood Johnson Foundation, and University of Wisconsin, 2015 ........................ 39
Figure 6: CHNA process model for SECH ..................................................................................................... 41

                                                                                                                                                      4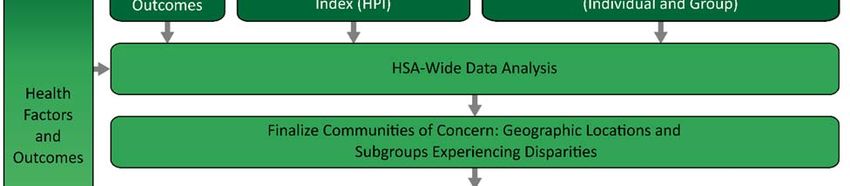
Figure 7: Community of Concern identification process ............................................................................ 60
Figure 8: Significant health need identification process. ............................................................................ 62

                                                                                                                                       5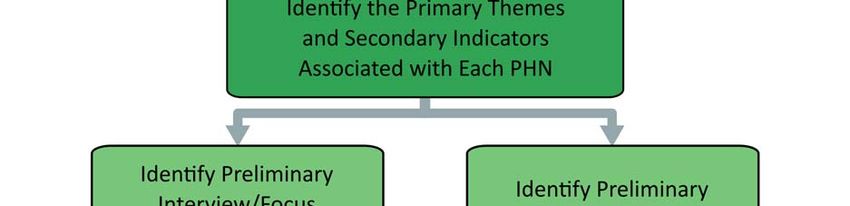
Report Summary
Purpose
The purpose of this community health needs assessment (CHNA) was to identify and prioritize significant
health needs of the St. Elizabeth Community Hospital (SECH) service area. The priorities identified in this
report help to guide nonprofit hospitals’ community health improvement programs and community
benefit activities as well as their collaborative efforts with other organizations that share a mission to
improve health. This CHNA report meets the requirements of the Patient Protection and Affordable Care
Act (and in California, Senate Bill 697) that nonprofit hospitals conduct a community health needs
assessment at least once every three years. The CHNA was conducted by Community Health Insights
(www.communityhealthinsights.com).

Community Definition
The definition of the community served was the primary service area of SECH, including a large portion
of Tehama County and a small portion of Shasta County. Both counties are considered predominately
rural, and are located in Northern California, situated along the north‐south Interstate 5 corridor. For
the purposes of this assessment the service area was further defined by six ZIP codes. These included
96021, 96022, 96035, 96055, 96080, and 96090. The total population of the service area was 69,385

Assessment Process and Methods
The data used to conduct the CHNA were identified and organized using the widely recognized Robert
Wood Johnson Foundation’s County Health Rankings model.1 This model of population health includes
many factors that impact and account for individual health and well‐being. Furthermore, to guide the
overall process of conducting the assessment, a defined set of data‐collection and analytic stages were
developed. These included the collection and analysis of both primary (qualitative) and secondary
(quantitative) data. Qualitative data included one‐on‐one and group interviews with 8 community health
experts, social service providers, and medical personnel. Furthermore, 12 community residents or
community service provider organizations participated in 5 focus groups across the service area.

Focusing on social determinants of health to identify and organize secondary data, datasets included
measures to describe mortality and morbidity and social and economic factors such as income,
educational attainment, and employment. Furthermore, the measures also included indicators to
describe health behaviors, clinical care (both quality and access), and the physical environment.

At the time that this CHNA was conducted, the COVID‐19 pandemic was still impacting communities
across the United States, including SECH’s service area. The process for conducting the CHNA remained
fundamentally the same. However, there were some adjustments made during the qualitative data
collection to ensure the health and safety of those participating. Additionally, COVID‐19 data were
incorporated into the quantitative data analysis and COVID‐19 impact was captured during qualitative
data collection. These findings are reported throughout various sections of the report.

1
 See: County Health Rankings Model, Robert Wood Johnson Foundation, and University of Wisconsin, 2021.
Retrieved from: http://www.countyhealthrankings.org/.

                                                                                                           6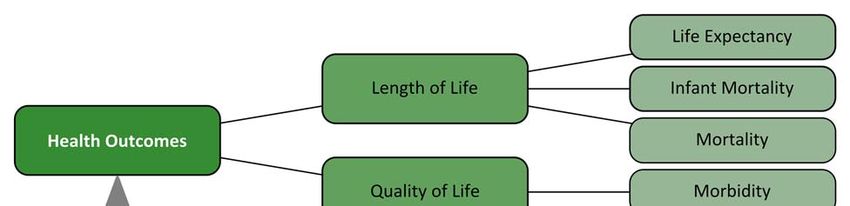
Process and Criteria to Identify and Prioritize Significant Health Needs
Primary and secondary data were analyzed to identify and prioritize significant health needs. This began
by identifying 12 potential health needs (PHNs). These PHNs were identified in previously conducted
CHNAs. Data were analyzed to discover which, if any, of the PHNs were present in the service area. After
these were identified, PHNs were prioritized based on rankings provided by primary data sources. Data
were also analyzed to detect emerging health needs beyond those 12 PHNs identified in previous
CHNAs.

List of Prioritized Significant Health Needs
The following significant health needs identified for St. Elizabeth Community Hospital are listed below in
prioritized order.

  1.    Access to Mental/Behavioral Health and Substance‐Use Services
  2.    Access to Quality Primary Care Health Services
  3.    Access to Basic Needs Such as Housing, Jobs, and Food
  4.    Access to Specialty and Extended Care
  5.    Access to Functional Needs
  6.    Increased Community Connections

Resources Potentially Available to Meet the Significant Health Needs
In all, 68 resources were identified in the service area that were potentially available to meet the
identified significant health needs. The identification method included starting with the list of resources
from the 2019 CHNA, verifying that the resources still existed, and then adding newly identified
resources into the 2022 CHNA report.

Conclusion
This CHNA details the process and findings of a comprehensive community health needs assessment to
guide decision‐making for the implementation of community health improvement efforts using a health
equity lens. The CNNA includes an overall health and social examination of SECH’s service area and
clearly details the needs of community members living in parts of the service area where the residents
experience more health disparities. This report also serves as a resource for community organizations in
their effort to improve health and well‐being in the communities they serve.

                                                                                                          7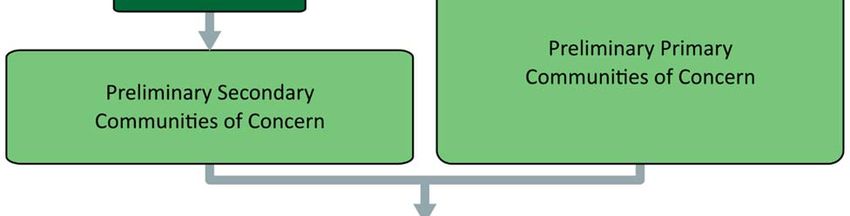
Introduction and Purpose
Both state and federal laws require that nonprofit hospitals conduct a community health needs
assessment (CHNA) every three years to identify and prioritize the significant health needs of the
communities they serve. The results of the CHNA guide the development of implementation plans
aimed at addressing identified health needs. Federal regulations define a health need accordingly:
“Health needs include requisites for the improvement or maintenance of health status in both the
community at large and in particular parts of the community (such as particular neighborhoods or
populations experiencing health disparities)” (p. 78963).2

This report documents the processes, methods, and findings of a CHNA conducted on behalf of
St. Elizabeth Community Hospital (SECH), located at 2550 Sister Mary Columba Dr., Red Bluff, CA, 96080.
SECH’s primary service area includes Tehama County, and a small portion of southern Shasta County.
The total population of the service area was 69,385.

SECH is an affiliate of Dignity Health, a nonprofit healthcare system. The CHNA was conducted over a
period of six months, beginning in August 2021 and concluding January 2022. This CHNA report meets
requirements of the Patient Protection and Affordable Care Act and California Senate Bill 697 that
nonprofit hospitals conduct a community health needs assessment at least once every three years.

Community Health Insights (www.communityhealthinsights.com) conducted the CHNA on the behalf of
SECH. Community Health Insights is a Sacramento‐based research‐oriented consulting firm dedicated to
improving the health and well‐being of communities across Central and Northern California. Community
Health Insights has conducted dozens of CHNAs and CHAs for multiple health systems and local health
departments over the previous decade.

                                                 Findings
Prioritized Significant Health Needs
Primary and secondary data were analyzed to identify and prioritize the significant health needs in the
SECH service area. In all, 6 significant health needs were identified. Primary data were then used to
prioritize these significant health needs.

Prioritization was based on two measures that came from the key informant interview and focus group
results. These included the percentage of sources that identified a health need as existing in the
community, and the percentage of times the sources identified a health need as a top priority. Table 1
shows the value of these measures for each significant health need.

2
 Federal Register, Vol. 79, No. 250, (Wednesday, December 31, 2014). Department of the Treasury, Internal
Revenue Service.

                                                                                                            8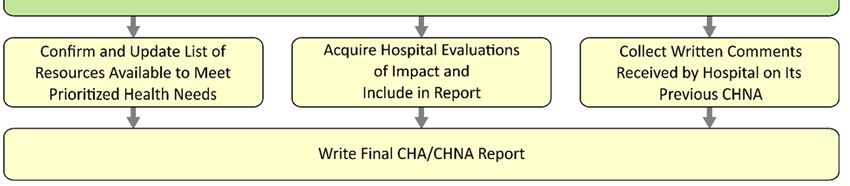
Table 1: Health need prioritization inputs for SECH service area.
                                          Percentage of Key Informants Percentage of Times Key Informants
Prioritized Health Needs                  and Focus Groups Identifying and Focus Groups Identified Health
                                                  Health Need                Need as a Top Priority
Access to Mental/Behavioral
Health and Substance‐Use                                 90%                                     29%
Services
Access to Quality Primary Care
                                                        100%                                     20%
Health Services
Access to Basic Needs Such as
                                                         80%                                     12%
Housing, Jobs, and Food
Access to Specialty and Extended
                                                         50%                                     16%
Care
Access to Functional Needs                               50%                                     2%
Increased Community
                                                         40%                                       ~
Connections
~ Health need not mentioned

These measures were then combined to create a health need prioritization index. The highest priority
was given to health needs that were more frequently mentioned and were more frequently identified
among the top priority needs.3 The prioritization index values are shown in Figure 1, where health needs
are ordered from highest priority at the top of the figure to lowest priority at the bottom.

3
    Further details regarding the creation of the prioritization index can be found in the technical report.

                                                                                                               9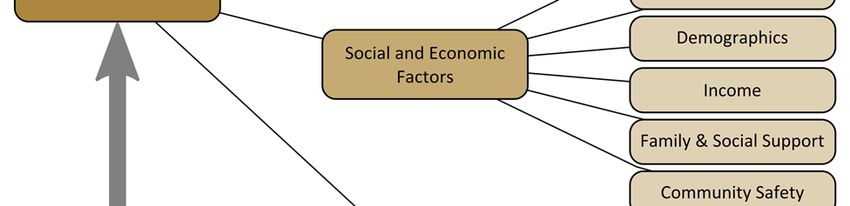
St. Elizabeth Community Hospital 2022 Prioritized Health Needs

    Access to Mental/Behavioral
     Health and Substance-Use
                      Services

  Access to Quality Primary Care
                Health Services

 Access to Basic Needs Such as
       Housing, Jobs, and Food

         Access to Specialty and
                 Extended Care

    Access to Functional Needs

          Increased Community
                  Connections

                                   0.0              0.5                1.0              1.5
                                                          Prioritization Index Value

                    Figure 1: Prioritized significant health needs for SECH service area.

While COVID‐19 was top of mind for many participating in the primary data collection process, feedback
regarding the impact of COVID‐19 confirmed that the pandemic exacerbated existing needs in the
community.

The significant health needs are described below. Those secondary data indicators used in the CHNA
that performed poorly compared to benchmarks are listed in the table below each significant health
ordered by their relationship to the conceptual model used to guide data collection for this report.
Results from primary data analysis are also provided in the table. (A full listing of all quantitative
indicators can be found in the technical section of this report).

1. Access to Mental/Behavioral Health and Substance‐Use Services

Individual health and well‐being are inseparable from individual mental and emotional outlook. Coping
with daily life stressors is challenging for many people, especially when other social, familial, and
economic challenges occur. Access to mental, behavioral, and substance‐use services is an essential
ingredient for a healthy community where residents can obtain additional support when needed.

                                                                                                         10
Primary Data Analysis Secondary Data Analysis
The manner in which the health need appeared or was The following indicators performed
expressed in the community was described as follows by key worse in the service area when
informants and focus group participants: compared to state averages:
The community lacks adequate substance‐use services. Life Expectancy
Isolation has increase mental health needs among Premature Age‐Adjusted Mortality
seniors. Premature Death
The community lacks in‐patient substance‐use recovery Liver Disease Mortality
services. Suicide Mortality
There is a lack of compassion towards those suffering Poor Mental Health Days
with substance‐use disorders. Frequent Mental Distress
Generational substance‐use is common in the Poor Physical Health Days
community. Frequent Physical Distress
Few mental health practitioners take Medi‐Cal or Poor or Fair Health
Medicare insurances. Excessive Drinking
There are too few mental health providers in the Adult Smoking
community. Primary Care Shortage Area
It is difficult to recruit mental health providers to the Mental Health Care Shortage Area
community. Medically Underserved Area
There is a large methamphetamine issue in the Mental Health Providers
community. Psychiatry Providers
Opioid use has risen in the community resulting in Firearm Fatalities Rate
more overdoses and deaths. Social Associations
Because there are no detox facilities in the area, many
Homelessness Rate
detox in the emergency department.
Mental health issues have recently grown in the
community.
There is a lack of culturally competent mental health
services in the community.
Patients wait an excessive amount of time to be seen
by a mental health provider.
There is a stigma associated with seeking mental health
services.
2. Access to Quality Primary Care Health Services
Primary care resources include community clinics, pediatricians, family practice physicians, internists,
nurse practitioners, pharmacists, telephone advice nurses, and other similar resources. Primary care
services are typically the first point of contact when an individual seeks healthcare. These services are
the front line in the prevention and treatment of common diseases and injuries in a community.
11Primary Data Analysis Secondary Data Analysis
The manner in which the health need appeared or was The following indicators performed worse
expressed in the community was described as follows by in the service area when compared to
key informants and focus group participants: state averages:
There are limited healthcare services for many in the Infant Mortality
county. Child Mortality
Some community members must travel outside of the Life Expectancy
area to receive medical care. Premature Age‐Adjusted Mortality
The community needs more urgent care centers. Premature Death
The wait times to see healthcare providers can be Stroke Mortality
excessive for some in the community. Chronic Lower Respiratory Disease
It is difficult to attract healthcare providers to the Mortality
community. Diabetes Mortality
Those covered by Medi‐Cal have limited options when Heart Disease Mortality
seeking healthcare. Hypertension Mortality
Turnover among healthcare providers is very high in the Cancer Mortality
community. Liver Disease Mortality
There are a limited number of bilingual providers in the COVID‐19 Mortality
area. COVID‐19 Case Fatality
Because of the shortage of healthcare workers, patients Alzheimer's Disease Mortality
get a limited amount of time with providers. Influenza and Pneumonia Mortality
The high turnover of providers results in loss of Diabetes Prevalence
continuity of care for patients. Poor Mental Health Days
Clinicians of color who come to practice in the Frequent Mental Distress
community have faced racism and discrimination, Poor Physical Health Days
contributing to high turnover rates of providers. Frequent Physical Distress
Poor or Fair Health
Colorectal Cancer Prevalence
Lung Cancer Prevalence
Prostate Cancer Prevalence
Asthma ED Rates
Primary Care Shortage Area
Medically Underserved Area
Primary Care Providers
Preventable Hospitalization
COVID‐19 Cumulative Full
Vaccination Rate
Homelessness Rate
3. Access to Basic Needs Such as Housing, Jobs, and Food
Access to affordable and clean housing, stable employment, quality education, and adequate food for
good health are vital for survival. Maslow’s Hierarchy of Needs4 suggests that only when people have
4
McLeod, S. 2014. Maslow’s Hierarchy of Needs. Retrieved from: http://www.simplypsychology.org/maslow.html
12their basic physiological and safety needs met can they become engaged members of society and self‐
actualize or live to their fullest potential, including enjoying good health. Research shows that the social
determinants of health, such as quality housing, adequate employment and income, food security,
education, and social support systems, influence individual health as much as health behaviors and
access to clinical care.5
Primary Data Analysis Secondary Data Analysis
The manner in which the health need appeared or was The following indicators performed worse
expressed in the community was described as follows by in the service area when compared to
key informants and focus group participants: state averages:
There are limited good‐wage employment Infant Mortality
opportunities in the community. Child Mortality
The pandemic has increased unemployment; many jobs Life Expectancy
have been lost among all sectors. Premature Age‐Adjusted Mortality
Many in the community are forced to make trade‐offs Premature Death
between paying for food, medication, rent, and other Hypertension Mortality
bills. COVID‐19 Mortality
The housing supply in the community is limited. COVID‐19 Case Fatality
Educational opportunities are limited in the area. Diabetes Prevalence
The number of people experiencing homelessness has Poor Mental Health Days
grown during the pandemic. Frequent Mental Distress
A large number of children in the K‐12 school system Poor Physical Health Days
routinely experience homelessness. Frequent Physical Distress
Many are now living in multi‐generational housing due Poor or Fair Health
to limited housing availability. Asthma ED Rates
People relocating to the area due to recent fires has Adult Obesity
exacerbated the existing housing shortage. Limited Access to Healthy Foods
The housing shortage has resulting in increased Food Environment Index
property values, making it more difficult to find Medically Underserved Area
affordable housing. COVID‐19 Cumulative Full
Vaccination Rate
Some College
Third Grade Reading Level
Third Grade Math Level
Unemployment
Children in Single‐Parent Households
Social Associations
Children Eligible for Free Lunch
Children in Poverty
Median Household Income
Homelessness Rate
Households with no Vehicle Available
5
See: http://www.countyhealthrankings.org/learn‐others/research‐articles#Rankingsrationale
134. Access to Specialty and Extended Care
Extended care services, which include specialty care, are care provided in a particular branch of
medicine and focused on the treatment of a particular disease. Primary and specialty care go hand in
hand, and without access to specialists, such as endocrinologists, cardiologists, and gastroenterologists,
community residents are often left to manage the progression of chronic diseases, including diabetes
and high blood pressure, on their own. In addition to specialty care, extended care refers to care
extending beyond primary care services that is needed in the community to support overall physical
health and wellness, such as skilled‐nursing facilities, hospice care, and in‐home healthcare.
Primary Data Analysis Secondary Data Analysis
The manner in which the health need appeared or was The following indicators performed worse
expressed in the community was described as follows by in the service area when compared to
key informants and focus group participants: state averages:
There are limited services for seniors. Infant Mortality
The community needs more rehabilitative services Life Expectancy
after hospital discharge. Premature Age‐Adjusted Mortality
There are not enough memory care services in the Premature Death
area; one must leave the area to find them. Stroke Mortality
The community needs more specialists; they are Chronic Lower Respiratory Disease
difficult to recruit. Mortality
The aging population is growing, thus the demand for Diabetes Mortality
services is increasing. Heart Disease Mortality
Many do understand long‐term care services; more Hypertension Mortality
education is needed to prepare for those needing Cancer Mortality
these services. Liver Disease Mortality
COVID‐19 Mortality
COVID‐19 Case Fatality
Alzheimer's Disease Mortality
Diabetes Prevalence
Poor Mental Health Days
Frequent Mental Distress
Poor Physical Health Days
Frequent Physical Distress
Poor or Fair Health
Lung Cancer Prevalence
Asthma ED Rates
Psychiatry Providers
Specialty Care Providers
Preventable Hospitalization
Homelessness Rate
5. Access to Functional Needs
Functional needs refer to needs related to adequate transportation access and conditions which
promote access for individuals with physical disabilities. Having access to transportation services to
14support individual mobility is a necessity of daily life. Without transportation, individuals struggle to
meet their basic needs, including those needs that promote and support a healthy life. The number of
people with a disability is also an important indicator for community health and must be examined to
ensure that all community members have access to necessities for a high quality of life.
Primary Data Analysis Secondary Data Analysis
The manner in which the health need appeared or was The following indicators performed
expressed in the community was described as follows by key worse in the service area when
informants and focus group participants: compared to state averages:
Residents with limited transportation options struggle Disability
to get access to healthcare. Frequent Mental Distress
The rural nature of the county makes getting around Frequent Physical Distress
more challenging for some. Poor or Fair Health
Some avoid getting needed care due to limited Adult Obesity
transportation options. COVID‐19 Cumulative Full
Those in southern Tehama County must travel extended Vaccination Rate
distances to access healthcare. Homelessness Rate
Medi‐Cal and Medicare coverage for transportation Households with no Vehicle
to/from healthcare services is limited. Available
The digital divide creates challenges for those with Access to Public Transit
limited internet access for those healthcare services
delivered virtually.
Many seniors are "technologically behind," creating
challenges in access virtual services.
The community has inadequate broadband services;
creates barriers in accessing virtual services such as
healthcare and education.
6. Increased Community Connections
As humans are social beings, community connection is a crucial part of living a healthy life. People have
a need to feel connected with a larger support network and the comfort of knowing they are accepted
and loved. Research suggests “individuals who feel a sense of security, belonging, and trust in their
community have better health. People who don’t feel connected are less inclined to act in healthy ways
or work with others to promote well‐being for all.”6 Assuring that community members have ways to
connect with each other through programs, services, and opportunities is important in fostering a
healthy community. Furthermore, healthcare and community support services are more effective when
they are delivered in a coordinate fashion, where individual organizations collaborate with others to
build a network of care.
6
Robert Wood Johnson Foundation. 2016. Building a Culture of Health: Sense of Community. See:
https://www.rwjf.org/en/cultureofhealth/taking‐action/making‐health‐a‐shared‐value/sense‐of‐community.html
15Primary Data Analysis Secondary Data Analysis
The manner in which the health need appeared or was The following indicators performed worse
expressed in the community was described as follows by in the service area when compared to
key informants and focus group participants: state averages:
There is growing social and family disconnection in the Infant Mortality
community; many seniors are left to live on their own. Child Mortality
Many of the social services systems operate in silos; Life Expectancy
there needs to be more integration. Premature Age‐Adjusted Mortality
The bridging between early care and the K‐12 Premature Death
education system needs improved. Stroke Mortality
Diabetes Mortality
Heart Disease Mortality
Hypertension Mortality
Suicide Mortality
Unintentional Injuries Mortality
Diabetes Prevalence
Poor Mental Health Days
Frequent Mental Distress
Poor Physical Health Days
Frequent Physical Distress
Poor or Fair Health
Excessive Drinking
Physical Inactivity
Access to Exercise Opportunities
Teen Birth Rate
Primary Care Shortage Area
Mental Health Care Shortage Area
Medically Underserved Area
Mental Health Providers
Psychiatry Providers
Specialty Care Providers
Primary Care Providers
Preventable Hospitalization
COVID‐19 Cumulative Full Vaccination
Rate
Homicide Rate
Firearm Fatalities Rate
Violent Crime Rate
Some College
Unemployment
Children in Single‐Parent Households
Social Associations
Homelessness Rate
Households with no Vehicle Available
Access to Public Transit
16Methods Overview
Conceptual and Process Models
The data used to conduct the CHNA were identified and organized using the widely recognized Robert
Wood Johnson Foundation’s County Health Rankings model.7 This model of population health includes
the many factors that impact and account for individual health and well‐being. Furthermore, to guide
the overall process of conducting the assessment, a defined set of data collection and analytic stages
were developed. For a detailed review of methods, see the technical section.
Public Comments from Previously Conducted CHNAs
Regulations require that nonprofit hospitals include written comments from the public on their
previously conducted CHNAs and most recently adopted implementation strategies. SECH requested
written comments from the public on its 2019 CHNA and most recently adopted implementation
strategy in the documents and through its web site at https://www.dignityhealth.org/north‐
state/locations/stelizabethhospital/about‐us/community‐benefit.
At the time of the development of this CHNA report, SECH had not received written comments. SECH
will continue to use its website as a tool to solicit public comments and ensure that these comments are
considered as community input in the development of future CHNAs.
Data Used in the CHNA
Data collected and analyzed included both primary or qualitative data and secondary or quantitative
data. Primary data included 5 interviews with 8 community health experts and 5 focus groups conducted
with a total of 12 community residents or community‐facing service providers. (A full listing of all
participants can be seen in the technical section of this report.)
Secondary data included multiple datasets selected for use in the various stages of the analysis. A
combination of mortality and socioeconomic datasets collected at subcounty levels was used to identify
portions of the hospital service area with greater concentrations of disadvantaged populations and poor
health outcomes. A set of county‐level indicators was collected from various sources to help identify and
prioritize significant health needs. Additionally, socioeconomic indicators were collected to help
describe the overall social conditions within the service area. Health outcome indicators included
measures of both mortality (length of life) and morbidity (quality of life). Health factor indicators
included measures of 1) health behaviors, such as diet and exercise and tobacco, alcohol, and drug use;
2) clinical care, including access to quality of care; 3) social and economic factors such as race/ethnicity,
income, educational attainment, employment, neighborhood safety, and similar; and 4) physical
environment measures, such as air and water quality, transit and mobility resources, and housing
affordability. In all, 86 different health‐outcome and health factor indicators were collected for the
CHNA.
7
See: County Health Rankings Model, Robert Wood Johnson Foundation, and University of Wisconsin, 2021.
Retrieved from: http://www.countyhealthrankings.org/.
17Data Analysis
Primary and secondary data were analyzed to identify and prioritize the significant health needs within
the SECH service area. This included identifying 12 PHNs in these communities. These potential health
needs were those identified in previously conducted CHNAs. Data were analyzed to discover which, if
any, of the PHNs were present in the hospital’s service area. After these were identified, health needs
were prioritized based on an analysis of primary data sources that described the PHN as a significant
health need.
For an in‐depth description of the processes and methods used to conduct the CHNA, including primary
and secondary data collection, analysis, and results, see the technical section of this report.
Description of Community Served
The definition of the community served was the primary service area of SECH, including large portions of
Tehama County and a smaller portion of southern Shasta County. Both counties are located in Northern
California, situated along the Interstate 5 corridor. Tehama County is rural in nature covering 2,962
square miles. The largest city is Red Bluff, both a Micropolitan Statistical Area and the County Seat with
a population of just over 14,000 residents. A small portion of southern Shasta County is covered by the
hospital’s service area and includes the community of Cottonwood. For the purposes of this assessment
the service area was further defined by six ZIP codes. These included 96021, 96022, 96035, 96055,
96080, and 96090. The total population of the service area was 69,385. The service area is shown in
Figure 2.
18Figure 2: Community served by SECH.
Population characteristics for each ZIP code in the service area are presented in Table 2. These are
compared to the state and county characteristics for descriptive purposes. Any ZIP code with values that
compared negatively to the state or county is highlighted.
19Table 2: Population characteristics for each ZIP code located in the SECH service area.
% Without High School
% With High Housing
% Unemployment
Median Age (yrs.)
% With Disability
Total Population
% Non‐White or
Median Income
Hispanic\Latinx
% Uninsured
Graduation
% Poverty
Costs
ZIP code
96021 16,017 48.4 37.2 $46,050 25.8 10 7.7 22.6 39.1 15.2
96022 16,253 18.1 40.7 $55,049 20.5 5.2 4.9 11.9 38.8 19.7
96035 3,629 51.4 41.4 $45,417 22.5 7.9 10.3 28.1 39.3 15.6
96055 3,866 20.2 43.3 $48,103 14.6 4.4 4.5 10.1 29.5 18.8
96080 29,139 24.1 41 $41,316 21.2 8.8 5.8 10 38.9 19.9
96090 481 25.6 51 $40,139 23.3 7.4 6.4 17.4 26 25.6
Tehama 63,912 31.7 41 $44,514 22.1 8.6 6.3 15.5 38.4 18.9
California 39,283,497 62.8 36.5 $75,235 13.4 6.1 7.5 16.7 40.6 10.6
Source: 2019 American Community Survey 5‐year estimates; U.S. Census Bureau.
Health Equity
The Robert Wood Johnson Foundation’s definition of health equity and social justice is used here to help
establish a common understanding for the concept of health equity.
“Health equity means that everyone has a fair and just opportunity to be healthier. This requires
removing obstacles to health such as poverty, discrimination, and their consequences, including
powerlessness and lack of access to good jobs with fair pay, quality education and housing, safe
environments, and health care.”
Inequities experienced early and throughout one’s life, such as limited access to a quality education,
have health consequences that appear later in life as health disparities. Health disparities are defined as
“preventable differences in the burden of disease, injury, violence, or opportunities to achieve optimal
health experienced by populations, and defined by factors such as race or ethnicity, gender, education
or income, disability, geographic location or sexual orientation.”8
In the US, and many parts of the world inequities are most apparent when comparing various racial and
ethnic groups to one another. Using these comparisons between racial and ethnic populations, it’s clear
that health inequities persist across communities, including Tehama County.
8
Center for Disease Control and Prevention. 2008. Health Disparities Among Racial/Ethnic Populations. Community
Health and Program Services (CHAPS): Atlanta: U.S. Department of Health and Human Services.
20This section of the report shows inequities in health outcomes, comparing these between race and
ethnic groups. These differences inform better planning for more targeted interventions.
Health Outcomes ‐ the Results of Inequity
The table below displays disparities among race and ethnic groups for the HSA for life expectancy,
mortality, and low birth weight.
Table 3: Health outcomes comparing race and ethnicity in the SECH service area.
American
Indian\
Health Outcomes Description Asian Black Hispanic White Overall
Alaska
Native
Average number of years a
Life Expectancy ~ ~ ~ 84.0 75.1 76.5
person can expect to live.
Number of deaths among
Premature Age‐
residents under age 75 per
Adjusted 519.3 ~ ~ 268.2 494.1 445.4
100,000 population (age‐
Mortality
adjusted).
Years of potential life lost before
Premature Death age 75 per 100,000 population ~ ~ ~ 5,898 10,998 9,503.4
(age‐adjusted).
Percentage of live births with
Low Birthweight ~ ~ ~ 6.4% 5.6% 6%
low birthweight (< 2,500 grams).
~ Data Not Available
Data sources included in the technical section of the report.
Inequities are apparent when examining premature age adjusted mortality rates, where American
Indian/Alaskan Natives and Whites far outnumber Hispanic populations.
Health Factors ‐ Inequities in the Service Area
Inequities can be seen in data that help describe health factors in the service area, such as education
attainment and income. These health factors are displayed in the table below and are compared across
race and ethnic groups.
Table 4: Health factors comparing race and ethnicity in the SECH service area.
American
Indian\
Health Factors Description Asian Black Hispanic White Overall
Alaska
Native
Percentage of adults ages 25
Some Collegea and over with some post‐ 46.1% 39.9% 54.5% 39.4% 58.8% 54.4%
secondary education.
21American
Indian\
Health Factors Description Asian Black Hispanic White Overall
Alaska
Native
Percentage of adults ages 25
High School
and over with at least a high 72.6% 49.8% 80.4% 61.6% 91.2% 84.5%
Completiona
school diploma or equivalent.
Average grade level
Third Grade performance for 3rd graders
~ ~ ~ 2.4 2.8 2.6
Reading Level on English Language Arts
standardized tests
Average grade level
Third Grade
performance for 3rd graders ~ ~ ~ 2.3 2.6 2.5
Math Level
on math standardized tests
Children in Percentage of people under
67% 10.6% ~ 44% 23.7% 23.7%
Poverty age 18 in poverty.
The income where half of
Median
households in a county earn
Household $30,427 ~ $80,123 $37,460 $46,945 $51,672
more and half of households
Income
earn less.
Percentage of the civilian non‐
Uninsured
institutionalized population 12.7% 0.4% 0% 11% 4.7% 6.3%
Populationb
without health insurance.
~ Data Not Available
Unless otherwise noted, data sources included in the technical section of the report.
a
From 2019 American Community Survey 5‐year estimates tables B15002, C15002B, C15002C,
C15002D, C15002H, and C15002I.
b
From 2019 American Community Survey 5‐year estimates table S2701.
There are apparent inequities when comparing health factors among groups. For example, high school
completion varies widely among population groups; just over 60% of Hispanics complete high school,
compared to over 90% of Whites. Furthermore, 44% of Hispanic children live in poverty compared to
10% of Asian children.
Population Groups Experiencing Disparities
Key informants were asked to identify population groups that experienced health disparities in the SECH
service area. Interview participants were asked, “What specific groups of community members
experience health issues the most?” Responses were analyzed by identifying all groups noted as one
experiencing disparities. Groups identified by key informants are listed below. The groups are not
mutually exclusive—one group could be a subset of another group. One of the purposes of identifying
the sub‐populations was to help guide additional qualitative data collection efforts to focus on the
needs of these population groups.
Low income
Senior
Disabled
22 Hispanic
Homeless
Migrant farm workers
Native Americans
Severely mentally ill
Those without internet
Undocumented
Caucasians
California Healthy Places Index
Figure 3 displays the California Healthy Places Index (HPI)9 values for the SECH service area. The HPI is an
index based on 25 health‐related measures for communities across California. These measures included
in the HPI were selected based on their known relationship to life expectancy and other health
outcomes. These values are combined into a final score representing the overall health and well‐being
of the community which can then be used to compare the factors influencing health between
communities. Higher HPI index values are found in communities with a collection of factors that
contribute to greater health, and lower HPI values are found in communities where these factors are
less present.
9
Public Health Alliance of Southern California. 2021. The California Health Places Index (HPI): About. Retrieved 26
July 2021 from https://healthyplacesindex.org/about/.
23Figure 3: Healthy Places Index for SECH.
Areas with the darkest blue shading in Figure 3 have the lowest overall HPI scores, indicating factors
leading to less healthy neighborhoods. The low population density areas in western Tehama and Shasta
Counties had low SPI scores, as well as communities situated along the Highway 99 corridor and eastern
Cottonwood. There are likely to be a higher concentration of residents in these locations experiencing
health disparities.
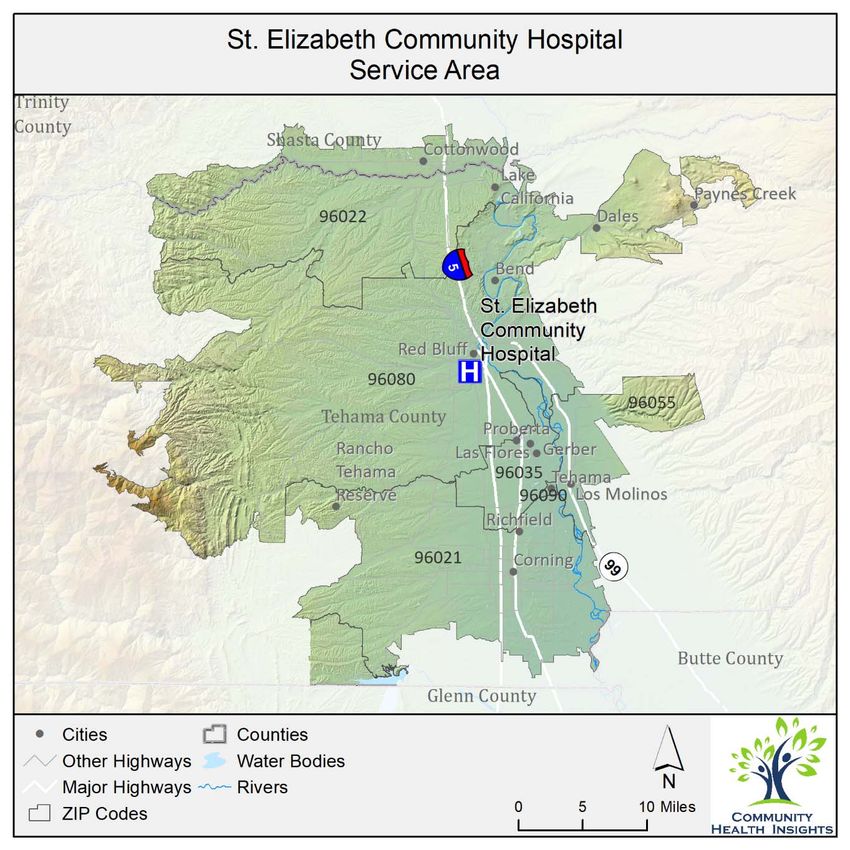
Communities of Concern
Communities of Concern are geographic areas within the service area that have the greatest
concentration of poor health outcomes and are home to more medically underserved, low‐income, and
diverse populations at greater risk for poorer health. Communities of Concern are important to the
24overall CHNA methodology because, after the service area has been assessed more broadly, they allow
for a focus on those portions of the region likely experiencing the greatest health disparities. Geographic
Communities of Concern were identified using a combination of primary and secondary data sources.
(Refer to the technical section of this report for an in‐depth description of how these are identified).
Analysis of both primary and secondary data revealed 4 ZIP codes that met the criteria to be classified as
Communities of Concern. These are noted in Table 5, with the census population provided for each, and
are displayed in Figure 4.
Table 5: Identified Communities of Concern for the SECH service area.
ZIP code Community\Area Population
96021 Corning, Flournoy 16,017
96035 Gerber, El Camino, Los Flores 3,629
96055 Los Molinos 3,866
96080 Red Bluff 29,139
Total Population in Communities of Concern 52,651
Total Population in Hospital Service Area 69,385
Percentage of Service Area Population in Community of Concern 75.9%
Source: 2019 American Community Survey 5‐year estimates; U.S. Census Bureau.
Figure 4 displays the ZIP codes highlighted in pink that are Communities of Concern for the SECH service
area.
25Figure 4: SECH Communities of Concern.
The Impact of COVID‐19 on Health Needs
COVID related health indicators regard the service area are noted in Table 6.
Table 6: COVID‐19‐related rates for the SECH service area.
Indicators Description Tehama California
Number of deaths due to
COVID‐19 Mortality COVID‐19 per 100,000 222.2 196.9
population.
26Indicators Description Tehama California
Percentage of COVID‐19
COVID‐19 Case
deaths per laboratory‐ 1.4% 1.1%
Fatality
confirmed COVID‐19 cases.
COVID‐19 Number of laboratory‐
Cumulative confirmed COVID‐19 cases 15,607.4 17,592.6
Incidence per 100,000 population.
COVID‐19 Number of completed
Cumulative Full COVID‐19 vaccinations per 41,757.4 68,318.2
Vaccination Rate 100,000 population.
COVID‐19 data collected on January 19 2022
Key informants and focus group participants were asked how the COVID‐19 pandemic had impacted the
health needs they described during interviews. A summary of their responses is shown in Table 7.
Table 7: The impacts of COVID‐19 on health need as identified in primary data sources.
Key Informant and Focus Group Responses
The isolation brought on by the pandemic has led to an increase in mental health issues and needs.
Existing mental health issues have been exacerbated by the pandemic.
It is difficult to virtually engage youth in educational activities.
The pandemic has brought significant stress to healthcare workers, many are experiencing
compassion fatigue and some are leaving the field due to burnout and vaccine mandates; staff are
also experiencing harassment from some patients.
Staffing shortages in healthcare have impacted every aspect of care delivery.
The political and ideological divide over mask and vaccine mandates have divided the community,
increasing stress in virtually every aspect of daily life.
Many have delayed preventative care; others have avoided healthcare until their conditions
became more acute.
Households with children with poor or no internet were unable to access virtual classes for school.
Many of the existing social and living conditions that lead to poorer health have been exacerbated
by the pandemic.
Some in the community have lost trust in government and the healthcare system.
Some workers stayed home to care for children or loved ones during the pandemic, and haven’t
returned to the workforce.
Resources Potentially Available to Meet the Significant Health Needs
In all, 68 resources were identified in the SECH service area that were potentially available to meet the
identified significant health needs. These resources were provided by a total of 44 social service,
nonprofit, and governmental organizations, agencies, and programs identified in the CHNA. The
identification method included starting with the list of resources from the 2019 St. Elizabeth Community
Hospital CHNA, verifying that the resources still existed, and then adding newly identified resources into
27You can also read