2021 Interim Results - Permanent TSB Group
←
→
Page content transcription
If your browser does not render page correctly, please read the page content below
Interim Results
2021

                  0
Forward Looking Statements

This document contains forward-looking statements with respect to certain of the Permanent TSB Group Holdings plc’s (the ‘Bank’) intentions, beliefs, current goals
and expectations concerning, among other things, the Bank’s operational results, financial condition, performance, liquidity, prospects, growth, strategies, the banking
industry and future capital requirements.

The words “expect”, “anticipate”, “intend”, “plan”, “estimate”, “aim”, “forecast”, “project”, “target”, “goal”, “believe”, “may”, “could”, “will”, “seek”, “would”, “should”,
“continue”, “assume” and similar expressions (or their negative) identify certain of these forward-looking statements but their absence does not mean that a
statement is not forward looking. The forward-looking statements in this document are based on numerous assumptions regarding the Bank’s present and future
business strategies and the environment in which the Bank will operate in the future.

Forward-looking statements involve inherent known and unknown risks, uncertainties and contingencies because they relate to events and depend on circumstances
that may or may not occur in the future and may cause the actual results, performance or achievements of the Bank to be materially different from those expressed or
implied by such forward looking statements. Many of these risks and uncertainties relate to factors that are beyond the Bank’s ability to control or estimate precisely,
such as future global, national and regional economic conditions, levels of market interest rates, credit or other risks of lending and investment activities, competition
and the behaviour of other market participants, the actions of regulators and other factors such as changes in the political, social and regulatory framework in which
the Bank operates or in economic or technological trends or conditions.

Past performance should not be taken as an indication or guarantee of future results, and no representation or warranty, express or implied, is made regarding future
performance. Nothing in this document should be considered to be a forecast of future profitability or financial position and none of the information in this document is
intended to be a profit forecast or profit estimate.

The Bank expressly disclaims any obligation or undertaking to release any updates or revisions to these forward-looking statements to reflect any change in the Bank’s
expectations with regard thereto or any change in events, assumptions, conditions or circumstances on which any statement is based after the date of this document
or to update or to keep current any other information contained in this document. Accordingly, undue reliance should not be placed on the forward-looking statements,
which speak only as of the date of this document.

www.permanenttsbgroup.ie/investor-relations

I N T E R I M   R E S U L T S

                                                      2021

Eamonn Crowley,   Paul McCann,
CEO               Interim CFO
I N T E R I M   R E S U L T S

                                           2021

Business Update
Eamonn Crowley, CEO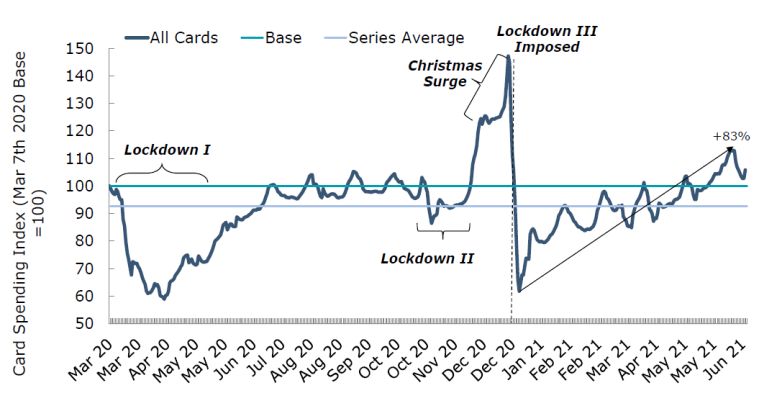
Good Performance – In Challenging Business Environment
    HY 2021 Highlights

                                                            • Total New Lending of €0.9bn, increased by 43% YoY, +20% versus H1’19
                                   17.5%1
    Customers                     Mortgage                  • €0.8bn New Mortgage Lending, 45% increase YoY, +25% versus H1’19
                                 Market Share
                                                            • Continuing to enhance Customer Journeys and build Partnerships

                                      €50m                  • New Digital Current Account launched - facilitating secure customer on-boarding online
                                    Additional
    Transform                                               • Full Organisational Review Completed – new hybrid working arrangements for employees
                                   Investment
                                   Committed                • Recruitment of 180 new roles into key growth areas

                                                            • Operating Income is 10% lower YoY
                                      €9m
    Profitability                      Loss                 • Net Interest Margin (NIM) 1.50%; Underlying NIM% 1.72%2, 5 bps lower YoY
                                    Before Tax
                                                            • Operating Expenses3 have increased 4% YoY as Investment Initiatives accelerated

                                                            • Asset Quality remains satisfactory, Net Impairment Charge of €3m
                                     7.0%
    Asset Quality                                           • NPLs reduced by c.€85m to €1.0bn from FY20 with NPL% reducing by 60bps to 7.0%
                                    NPL Ratio
                                                            • All Covid-19 mortgage payment breaks expired

                                                            • 15.3% CET1 Fully Loaded, 20Bps increase on FY20
                                     15.3%
    Capital                         CET1 Fully              • €250m Tier 2 issuance May’21 adding c. 3% to Total Capital ratios
                                     Loaded
                                                            • All Capital Ratios remain above Management and Regulatory minimum

              1.   BPFI data at 30 June 2021
              2.   Underlying NIM% excludes the cost of excess liquidity
4             3.   Operating Expenses exclude Regulatory Charges (€21m)
Mortgage Market Is Growing
    Demand Continues to Exceed Supply

             Mortgage Market (€bn)                      Mortgage Market Approvals (€bn)                    Mortgage Market Drawdowns (€bn)

                                          12.5
                                11.0                               3.5                           3.5
                 10.0
                                                         2.9                     2.8                                      2.9
       8.4
                                                                                                                                     2.1        2.2
                                                                                                               2.0

      2020      2021e           2022e     2023e         Q3'20     Q4'20         Q1'21           Q2'21        Q3'20      Q4'20      Q1'21      Q2'21

    Mortgage Market Applications (€bn)                     Housing Completions (000s)
                                                                 Annual Demand = 35k
                                                                                        22.7
                                                                                                        • Mortgage Market increased by 26% YoY,
                                                  7.0
                                    6.7                                                                   expected to grow c. 20% in FY21

                                                                         21.1
                                                                                                        • Mortgage Approvals and Drawdowns have
                    3.2                                   20.6                                            performed strongly in the first half of the
                                                                                                          year as demands continues to outweigh
       2.0
                                                                                                          supply

      Q3'20       Q4'20           Q1'21      Q2'21       2020        2021e              2022e

5      Source: Goodbody, BPFI
Macroeconomics Better Than Previously Forecast
    Domestic Performance Linked to Successful Easing of Restrictions
               House Price Growth (%)                       Labour Market (%)
                                                                                                    •   HPI is expected to rise as restrictions
                                                                                                        on construction activity during the
                          5.3%                      Unemployment Rate       Employment Growth           pandemic together with low levels of
                                                                                                        stock available for sale continues to
                                     4.2%                         6.9%                6.7%              increase prices
                                             6.0%
        2.2%                                                                                        •   Uncertainty remains around the true
                                                                                             1.4%       state of the Labour market due to
                                                    -1.2%                0.2%                           ongoing high levels of government
                                                                                                        supports
        2020             2021e       2022e     2020                 2021e               2022e
                                                                                                    •   However, most recent data shows the
                                                                                                        number of job openings rising to above
                                                                                                        pre-pandemic levels

                                                                                                    •   Significant fiscal support throughout
                    Savings Ratio%                           Card Spending Index                        the pandemic has led to a record
                                                                                                        increase in the household savings
                                                                                                        ratio, rising to 24% in 2020

                                                                                                    •   Card spending has increased each
                                                                                                        month year-to-date from the low point
                                                                                                        of the third lockdown at the start of the
                                                                                                        year

                                                                                                    •   A combination of elevated deposit
                                                                                                        levels and easing of restrictions is
                                                                                                        expected to lead to a spending surge
                                                                                                        throughout the summer

6      Source: Goodbody, CBI, BPFI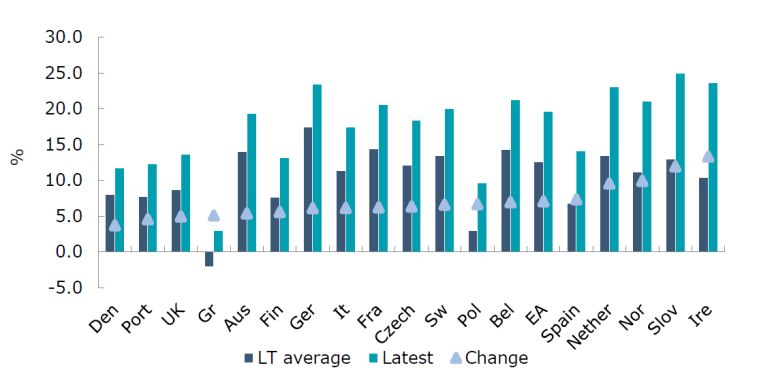
Strong Business Performance – H1’21 Growth
    Mortgage Market Share 17.5%1 - up 2.3% YoY
                 Mortgage Drawdowns & Market Share2                                                                        Mortgage Applications & Market Share

      1.0                                                                              18.0%
                                                                             17.5%
                                                                                                             2.5                                                               15.8%           20.0%
      0.8                                                                              45% Growth                                                                                                83% Growth
                        14.7%                   15.2%                                  16.0%                                14.8%
                                                                                       in Mortgage           2.0                                                                                 in Mortgage
                                                                                                                                                      12.4%                                    15.0%
      0.6                                                                              Drawdowns                                                                                                 Applications
                         0.6                                           0.8                 YoY
                                                                                       14.0%                 1.5                                                                                     YoY
      0.4                                                                                                                                                                                      10.0%
                                                0.5                                                          1.0                                                                2.2
                                                                                       12.0%                                  1.6
      0.2                                                                                                    0.5                                        1.2                                    5.0%

       -                                                                               10.0%                  -                                                                                0.0%
                       H1'19                  H1'20                   H1'21                                                 H1'19                      H1'20                   H1'21
                                                                                                                                              Applications           Market Share
                           Drawdowns                  Market Share Drawdowns %

                           Personal Term Lending (€m)                                                                                          SME Lending (€m)3
                                                                                           Term
                                                                                         Lending             45                                                                                    68% Growth
     100                                                                               Drawdowns             40                                                                                    in Total SME
      90                                                                                broadly in           35                                                                                    Lending YoY
      80                                                                                 line YoY
      70                                                                                                     30
      60                                                                                                     25
      50                 93                                                                                  20                                                                         42
      40                                                                                                     15               31
      30                                                                                                                                                      25
      20                                              46                        47                           10
      10                                                                                                      5
       0                                                                                                      0
                        H1'19                      H1'20                       H1'21                                         H1'19                           H1'20                     H1'21

           1.   Source: BPFI Data at June 2021
7          2.   All euro amounts have been rounded to the nearest million /billion, percentage movements are calculated on absolute numbers
           3.   H1 21 SME TL includes SBCI lending
A Purpose Led Strategy
Strong Ambition, Purpose And Priorities
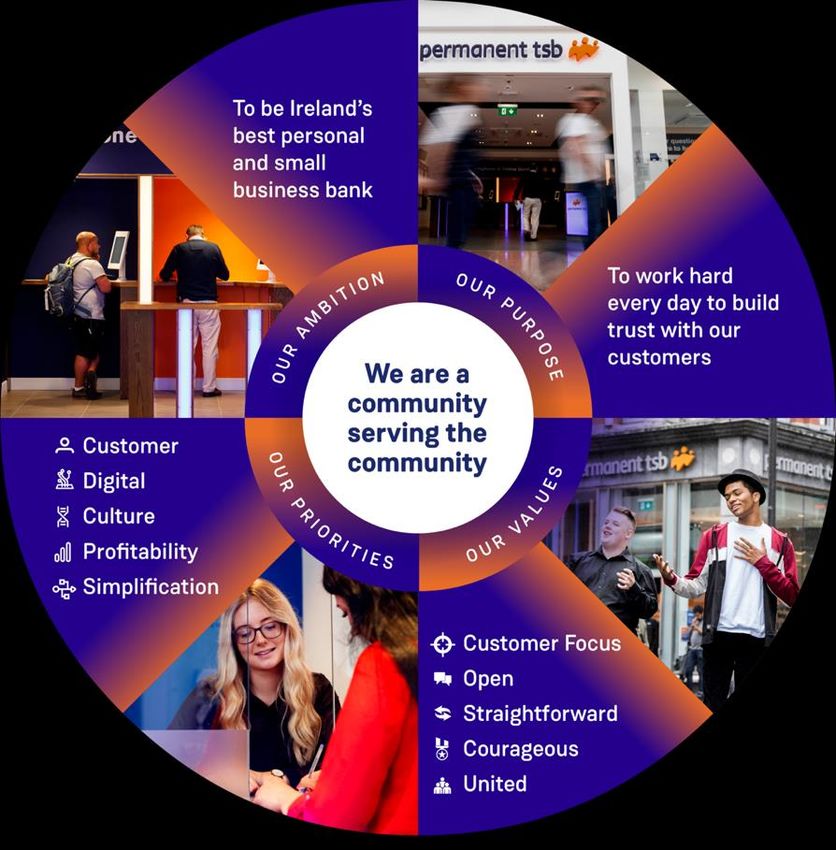
Our Ambition Our Purpose
To Be Ireland’s Best Personal To Work Hard Every Day to Build
And Small Business Bank Trust with Our Customers – We are a
Community Serving the Community
Our Priorities
Customers Transform Profitability
Customers Digital Culture Simplification Profitability
Increasing Enhancing Embedding an Simplifying Growing
Trust, Advocacy Digital Open, Inclusive, our Business Sustainable
& Loyalty Capabilities Risk Aware & Profitability
Growth Culture
8Customers
Build Trust And Loyalty With Our Customers
Enhance Leverage Re-Position
Customer Journeys Digital Capabilities Our Brand
Delivering On Our Priorities Meeting Changing Customer Needs
NPS1 + 19 72 Hour 42% Customer Feedback Is Important To Us
Top 2 Mortgage New To Bank
Market Approval Mortgage Relationship NPS1 - delivering strong Customer Service and Experience
Position Decision Customer
Action Taken On Mortgage Pricing
(+6 points YoY) Time
Reduced Mortgage Pricing across Variable and Fixed Products
Launched 4 Year Fixed ‘Rate Only’ Product broadening choice for our
Digital Activity2 550k3 45m customers, an alternative to an upfront cash back option
>50 million Digital Contactless
Online Log-Ins Customers Payments Delivering Enhanced Customer Journeys
(+20% YoY) (+10% YoY) (+22% YoY) c. 60% of Branch network migrated to digitally enhanced branches as we
adapt to changing customer behaviours
Branches adopting ‘JAM Card Friendly’ initiative from July, allowing
Developing Partnerships For Our Customers
vulnerable customers time and space to communicate
Partnerships – Giving Customers Choice
Intermediary
Partnerships New Partnership with Credit Logic – an Irish FinTech who will provide a new
27% digital application platform for mortgage applicants
Broker Market New Partnership with Worldpay from FIS – connecting business banking
Share customers with safe and easy-to-use merchant solutions
(Up 2 ppts YoY)
We continue to support SMEs by partnering with the Strategic Banking
Corporation of Ireland (SBCI) to provide up to €50 million in low-cost loans
under the Irish Governments Future Growth Loan Scheme
Enhancing Digital Adoption For Customer Choice
1. Relationship Net Promoter Score (NPS) – an index ranging from -100 to 100 measuring the willingness of customers to recommend a company’s products or services to others based on Kantar Survey Jan 2021.
9 2. Online refers to both Mobile App and Desktop
3. Digital Customers refer to both Mobile App and DesktopTransform
Build A Sustainable Future For The Bank
Digital Business Model Embed
Development Simplification Our Values
Delivering On Our Priorities A Bank-Wide Enterprise Transformation Programme Underway
Successfully launched facilitating secure • Effective Organisation Design
Digital Current Account
customer on-boarding online
Full organisation review completed H1’21
Enhanced cyber defences bringing maturity to c.200 colleagues exited the Bank in H1’21 under the Voluntary
Cyber Security
cyber capabilities Severance Scheme, an additional c.100 colleagues scheduled
to exit through H2’21 and Q1’22
Video Banking The first of its kind in the Irish market
Announced recruitment of 180 new roles into key growth areas
Live for both Mortgage and Consumer Finance
Digital Document Upload New hybrid working arrangements for employees established
Applications
for at least 50% of the Bank’s total workforce
Customer Communication Migrating existing customer communication to • Sustainable Workplace Solutions
Management (CCM) a CCM platform reducing reliance on 3rd party
Enhancing our Digital Workplace to enable smarter and more
flexible ways of working
Focus 2021/22
A new HQ ‘Collaboration Zone’ to facilitate collaboration
between people on-site and those working remotely
Google Pay Building on the success of Apple Pay
4 remote working hubs across the country
Digital Mortgage Journey Mortgage Application Portal & Tracker (Q3’21)
SME Customer Journey Digitalisation of key SME Customer journeys • Operational Excellence, Information Security & Operational
Resilience
Everyday Banking A scalable & resilient digital servicing platform
Adapting and automating, reducing risk and providing
bringing essential servicing journeys to both
efficiencies
desktop & mobile channels
A Digitally Connected Customer Centric Bank
10Building a Responsible and Sustainable Business
Engaging Communities to Build a Better Future
Supporting Local Communities Committing To Do More
Through Building Partnerships, Providing Financial Support and
Engaging in Employee Volunteering
• Signatory to the Business in the
Community Ireland Elevate Inclusive
Workplace Pledge
• Partnering with O Cualann • c.€500k in financial contributions
• Achievement of the Business
Cohousing. €350k over 3 years, to Irish community organisations in • Awarded the Guaranteed Irish symbol
Working Responsibly mark from
developing 1,800 affordable H1 and the announcement of 6 for the Bank’s contribution to local
Business in the Community Ireland
homes across the country new Community Fund Partners communities
Supporting Colleagues and Embedding Our Values Ambitions For H2 2021 Onwards
Every Voice Counts • Increasing our focus on Climate Change and the Bank's
• Awarded 1st Place for Empowering and Building Employee Sustainability Agenda
Trust by the CIPD A Sustainable Strategy
Living As Leaders • Developing an overarching Sustainability Strategy for the
• Successfully completed two waves of virtual round tables organisation and communicating it with Stakeholders
with 1,300 participants and 130 facilitators, bringing our ESG Risk Rating
Values to life in a reflective manner weekly. • Engaging a rating agency to produce an ESG Risk Rating
• 97% of colleagues surveyed said they noticed positive for the Bank
changes in behaviours as a result of the process Community Impact
Diversity & Inclusion • Elevating our social impact through partnerships and
supporting local communities through the Permanent
• Awarded a Bronze accreditation from the Irish Centre for
TSB Community Fund
Diversity
11I N T E R I M R E S U L T S
2021
Financial Performance
Paul McCann, Interim CFOLower Income Impacting Profitability
Income Statement
Grow Diversified Efficient Capital And
Income Streams Organisation Resource Allocation
H1 21 H1 20 YoY YoY HY 2021 Vs HY 2020
€m €m €m %
• 11% reduction in Net Interest Income primarily as a result of the
Performing loan sale in Q4’20 (€8m), reduced performing loan
Net Interest Income 152 171 (19) -11% income (€8m) and increased Interest Expense on excess liquidity
(€4m). This was partially offset by lower interest expense on deposits
Fees & Commissions 15 16 (1) -6% (€7m)
Net Other Income 0 (2) 2 +100% • Fees & Commissions broadly in line YoY. Income has increased
gradually throughout the first half of the year following the restrictions
Operating Income 167 185 (18) -10% imposed at the start of the year
Operating Expenses (147) (142) (5) +4%
• Operating Expenses are 4% higher YoY due to higher depreciation
Regulatory Charges (21) (20) (1) +5% costs arising from the significant investment in the digital
transformation programme over the last several years
Operating Profit (1) 23 (24) -100%
Impairment Charge (3) (75) 72 -96%
• An Impairment Charge of €3m reflecting a more positive outlook to
the current macroeconomic environment
Loss Before Exceptional Items & Tax (4) (52) 48 -92%
Exceptional Items (Net)1 (5) (5) - -
• Exceptional Items in H1’21 relate to advisory costs incurred in
Loss Before Tax (9) (57) 48 -84% respect of the potential transaction with Natwest
13 1. H1’20 Exceptional Items comprised costs incurred due to Covid-19 (€4m) and Restructuring and Other Costs (€1m)Net Interest Income
Net Lending Income 8% Lower - Actively Managing Deposit Costs
170 Net Lending Income (€m) Other Interest Income (€m) Net Interest Margin (%)2
10 1.95% 1.95%
(8)
160 1.79% 1.63%
1.77%
(8) 7 (5) 1.72%
166 7 1.75% 1.73%
1
150 1.50%
(6)
152 5 0.22% 0.14%
0.23%
-
140 0 -
H1 '20 Perf. Perf. Deposit Other H1 '21 H1 '20 NPL Treasury Other H1 '21 H1 '20 FY '20 H1 '21
Loan Loans Costs Income Income Funding
Sale Costs
Asset Yield Cost of Funds
NIM Underlying NIM%
• Net Lending Income1 of €152m decreased by • Other Interest Income has reduced from €5m • Net Interest Margin has reduced by 23bps from
8% YoY, mainly due to: at H1’20 to zero at H1’21 2020 Exit NIM of 1.73% to 1.50% for H1’21
• Reduced income as a result of the H2’20 • Income from the Total Non Performing Loan • The cost of holding excess liquidity has
Performing loan sale (€1.4bn); and Book has increased marginally c. €1m reduced NIM% by 22bps in H1’21, the
underlying NIM remains at c. 1.72% as
• Price reductions on the Bank’s Fixed Rate • Treasury Income reduced by €6m due to the
lending asset yields remain at c. 2.4%
products for both new and existing low interest rate environment and the cost
customers of excess liquidity; • Cost of Funds, has reduced by 8 bps YoY as
we continue to actively manage the cost of
• Continued active management of the cost of • Funding Costs (excluding Deposits) have
Deposits
Deposits helps to offset part of the reduction in remained stable YoY as the cost of Tier 2
Performing Loan Income issuance in Q2’21 is offset by lower interest
expense on RMBS issuances
1. Net Lending Income = Performing Loan Income less Deposit Cost
14 2. Underlying NIM% excludes the impact from the cost of excess liquidityPerforming Residential Loan Book
Home Loan Book 2% Growth YoY
Home Loan Book by Product (Mix %) Home Loan Yield (%) BTL Book by Product (Mix %)
€bn 11.6 11.7 11.8
3.1 1.5 1.5
2.86%
23% 20% 18% 2.81%
9%
2.71% 12%
14%
34% 38% 43% 1%
2%
1%
2.59% 90%
44% 41% 39% 87%
2.49% 2.49% 84%
H1 '20 FY '20 H1 '21 H1'20 FY'20 H1'21 H1 '20 FY '20 H1 '21
Tracker Fixed Variable
Stock Flow Tracker Fixed Variable
• Home Loan Mortgage Book has grown 2% YoY • Average New Business Yield of 2.71%, a • €1.6bn reduction in BTL loan book from
reduction of 15 Bps YoY Jun’20 to Jun’21 reflects €1.4bn Performing
• Strong New Business Performance: Loan sale transaction (‘Glenbeigh II’) in
• The Bank introduced competitive 3 & 5 Q4’20
• New Lending 45% higher YoY Year Rates for High Value (>250k) New
• 97% of Inflows (€733m) to Fixed Products Business • Average yield on Performing BTL book at
• 93% of New Business to Customers availing of • Launched 4 Year Fixed Rate Only Jun’21 of 1.67%; 25bps higher YoY as the
3 and 5 Year Fixed Rates (average yield product with rates from 2.25% average yield on the Performing Loan sale
2.71%) transaction (‘Glenbeigh II’) was 1.08%
• New Business exceeded Outflows1 by 17% with
35% of outflows from Tracker Products (average
yield 1.40%)
15 1. Outflows include out-of-course Redemptions and Contractual RepaymentsTotal SME Loan Book
New Lending Driving 16% Growth YTD
Total SME Book Movement (€m)1 SME Yield (%) SME New Lending (€m)
25 42
42 (16)
4.04% 4.16%
3.91%
+16% 185
159 3.52% 3.34% 3.40% 27
20
15
5
FY20 Inflows Outflows H1'21 H1'20 FY'20 H1'21 H1'20 H1'21
Mortgages Term Loans
Stock Flow
• SME Loan Book grew 16% as the pace of new lending • Pipeline remains strong with drawdowns from €50m SBCI Future
exceeds outflows Growth Loans scheme expected to conclude in H2’21
• New Lending of €42m, with a blended yield of 4.2% • Significant Sanctioned Pipeline2 of €25m expected to drawdown
• 50% of New Lending through the SBCI Future over the course of H2’21
Growth Loan Scheme
1. Includes Performing and Non Performing Mortgages, Term Loans and Overdrafts
16 2. Sanctioned Pipeline refers to loans approved by Credit Underwriting, but subject to AML approvalOperating Expenses
Total Costs Increase By 4% - Cost Management Remains A Key Focus
H1’21 H1’20 YoY YoY Movement In Operating Expenses (€m)
Cost Base Analysis €m €m €m %
Total Costs 168 162 +6 +4% +4%
160
o/w Regulatory Charges 21 20 +1 +5%
4 -2
Total Operating Expenses 147 142 +5 +4% -1
150
4
o/w Depreciation &
23 19 +4 +19%
Amortisation
Addressable Costs 124 123 +1 +1% 140 147
142
Cost Income Ratio1 88% 77% - +10%
130
Average Staff Numbers 2,356 2,424 -68 -3% H1'20 Investment Depreciation Payroll Non-Payroll H1'21
Savings Savings
Closing Staff Numbers2 2,255 2,465 -210 -9%
• Total Operating Expenses increased by 4% YoY;
• Higher spend on Digital Banking Initiatives (c. €4m), the Bank is in its
• Total Costs of €168m have increased by €6m YoY
third year of the Technology Investment Programme (Project Forte),
and has committed an additional €50m investment in Technology over
• The Cost Income Ratio at 88% is 11 ppts higher YoY, primarily as a
the medium term;
result of the 10% reduction in Total Operating Income
• Depreciation is 19% (€4m) higher YoY, as we pay for the investment on
• Closing Staff Numbers reduced by 210 FTE (9%) from 2,465 to 2,255 the Digital Banking Initiatives completed to date. The outlook for
depreciation is to grow over the medium term; offset by
• To date c.200 staff have exited the Bank under the Voluntary
• Payroll savings from Enterprise Transformation (€2m) together with
Redundancy Scheme in the first half of 2021, we expect an
additional savings from third party spend (€1m)
additional c. 100 staff to leave the Bank in H2’21
• FY21 Total Costs are expected to be c.3% higher YoY, as the Bank
continues to invest in technology and support lending growth
1. Cost Income Ratio is calculated as Operating Expenses (excl. Regulatory Charges and Exceptional Items) divided by Total Operating Income.
17 2. Closing staff numbers are calculated on a full time equivalent (FTE) basis.Asset Quality Improving
NPL Ratio of 7.0% - Provision Coverage In Line With FY20
Total Loan Book By Stage (€bn) Provisions By Stage (€bn)
FY '20 H1 '21 FY '20 H1 '21
NPL Ratio
Reduced
13.8
13.7 By 60 Bps
to 7.0%
0.39
0.36
1.1 0.34 0.34
1.0
Stage 1 & 2 Stage 3 Stage 1 & 2 Stage 3
Asset Quality / Coverage
• Gross Performing Loans have increased by 1% in 2021 to €13.8bn Balance ECL Coverage +/-
Category (€bn) (€bn) (%) Vs FY ‘20
• Non Performing Loan book (stage 3) decreased by c. €85m (8%) to €1.0bn, Stage 1 & 2 13.8 0.34 2.5% In line
primarily driven by higher levels of cures and lower defaults
Stage 3 (NPLs) 1.0 0.36 34.6% +0.3 ppts
• All Covid-19 mortgage payment breaks have expired and there are no EBA Total 14.9 0.70 4.7% -0.2 ppts
compliant payment breaks as at 30 June 2021. The Bank however, continues to
support customers impacted by the Covid-19 pandemic
• Remain committed to a Mid-Single Digit NPL Ratio
• Stage 1 & 2 Loan balances and associated ECL remained
• c. 30% of NPLs are on a path to cure over the next 12 – 18 months. The balance stable as new lending is offset by redemptions
will be assessed using all alternative options while protecting capital • Fully Loaded Leverage Ratio remains strong at 7.0%
18Strong Funding And Liquidity Position
Ratios Significantly Better Than European Peers
Total Funding (€bn) • 94% Funded by
Customer
Retail & Corporate Deposits (€bn)
Deposits;
18.8 19.1 19.6 • 87% from Retail
Deposits (incl. Action taken on
0.4 0.4 C/A’s) Non-Personal Deposits
0.4 0.4
0.5 0.2 0.5 0.1 1.5
0.1 1.7 Tier 2
1.9 0.7 0.2
20 (0.2) (0.2)
MREL Debt 18
5.4 5.8 6.5
16
AT1 14
12
Debt Securities In
10
Issue 18.0 18.5
8
10.5 10.5 10.5
Corporate Deposits
6
Current Accounts 4
2
0
HY2020 FY2020 HY2021 FY'20 Current Retail Non Other H1'21
Accounts Deposits Personal Reductions
• Current Account balances have increased by €0.7bn (12%) in H1’21 Deposits
• Retail Deposits have remained broadly in line, while active management
of the total Deposit base has resulted in a €0.2bn (12%) reduction in
Liquidity And Funding Ratio
Corporate Deposits PTSB v
European Bank European
• Post the sale of Performing Loans in Q4’20 together with the additional Ratio Jun 21 Average Peers
Current Account balances, the average volume of Excess Liquidity held
with the CBI which attracted a rate of -50bps was c.€2bn LCR1 318% 173% +145%
NSFR2 167% 122% +45%
• The Bank’s current MREL target (c.23% of RWAs) becomes binding on 1
January 2022 and the Bank is currently compliant with this target. A LDR1 77% 106% -29%
revised MREL target is expected to be communicated in Q4 2021.
Encumbrance1 5% 22% -17%
1. European Bank Averages based on Q1 2021 and Q4 2020 Supervisory Banking Statistics published by the ECB
19 2. Based on the Basel III monitoring exercise on the European banking system (Dec 2020, data as at Dec 2019) using “Group 2” banks averageCapital Ratios Remain Above Regulatory Requirements
CET1 Fully Loaded Increased By 20bps YTD
Regulatory Capital Ratios1 (%) CET1 Fully Loaded Ratio Movement (%)
Dec-20 Dec-20 (Proforma) Jun-21 RWAs RWAs
€8.5bn Proforma €8.5bn
22.3%
21.0% 16.5%
20.0% 0.1% -0.1% -0.1%
0.3%
18.1% 18.1% 15.5%
17.4%
15.1% 15.1% 15.3% 14.5%
15.1% 15.3%
13.5%
13.95%
12.5%
8.94% 8.94%
11.5%
10.5%
9.5%
8.5%
7.5%
CET1
CET1% Transitional CET1 Total Capital Dec-20 Intangibles RWA's P&L Other incl AT1 Jun-21
Transitional Fully Loaded Transitional (Proforma) Coupon
• In response to Covid-19, CBI introduced measures supporting sustainable • Fully Loaded CET1 ratio has increased (20bps) YTD
provision of credit to the economy, these measures remain in place at Jun’21
• Movements include:
• Total Capital (Transitional) ratio has increased by (+130bps) YTD vs reported
Dec’20, • An increase in the allowable add-back for software assets (c. +30bps);
• Tier 2 issuance in May 2021 of €250m (c. +300bps); and
• Lower Risk Weighted Assets (c. +10bps); and
• Increased add-back for software assets (c.+30bps); partly offset by
• YTD P&L loss incl AT1 Distributions (c. -20bps)
• De-recognition of 2015 AT1 note in February €125m (c. -100bps);
• Prudential filters deductions (c. -80bps); and
• YTD P&L loss including AT1 Distributions (c-20bps)
20 1. Pro-forma December 2020 Total Capital Transitional, reflects the impact of the de-recognition of the 2015 AT1 issuance following CBI approval in Feb 21 (-100bps)Building Sustainable Profitability
2021 Outlook
Growth Efficiency Returns
• New Mortgage Lending c. 30% increase • Accelerating investment in Digital • Lower Net Interest Income impacting
on 2020 volumes Infrastructure to support growth, profitability in 2021
increasing Operating Expenses c.3% YoY
• Mortgage Market Share c. 18%, • Returning to profitability from FY22
increasing 3 ppts YoY • The Bank continuing to make underlying onwards
cost savings to partly offset increases
• Leverage Ratio c. 7%
• SME New Lending >€100m • NPLs reduced further while protecting
capital
• Net Impairment Charge €100m
• NIM c. 1.50%
• Non Interest Income >9% of Total
Income
21I N T E R I M R E S U L T S
2021
Medium Term
Outlook
Eamonn Crowley, CEOSigned Memorandum of Understanding
Potential Acquisition of €7.6 Billion of Assets From NatWest and Ulster Bank DAC
• On the 23rd July 2021, the Bank entered into a Memorandum of Understanding (MOU) with NatWest and Ulster Bank DAC
• Potential acquisition where PTSB will acquire certain elements of the Ulster Bank Retail and SME business in the Republic of
Ireland
• The potential transaction envisages PTSB acquiring €7.6 billion of Retail and SME loans, 25 branches and 400 to 500 Ulster
Bank staff may transfer to PTSB (subject to TUPE)
• As part of the consideration NatWest will become a shareholder with up to 20% of the enlarged share capital of PTSB
together with an additional cash consideration payable by PTSB
• The potential transaction is expected to be accretive to RoTE with PTSB expected to hold a long term pro forma management
CET1 Ratio of >14%
• At this stage, and subject to regulatory engagement, PTSB does not envisage it will require additional new equity capital to
complete the potential transaction
23Strategically Compelling Transaction
Complements The Bank’s Purpose And Ambition
• Accelerates growth of PTSB customer base allowing the Bank to deliver an improved Increased
Customer proposition for all customers. Customer
Trust, Advocacy, Loyalty • Increased market share in complimentary products and significant growth in the micro SME Numbers
market
• Increased income supporting investment in IT infrastructure, accelerating digital New &
Digital enhancements Enhanced
Enhanced Digital Capability • Transfer of Asset Finance IT Infrastructure will create a digital Asset Finance Digital
solution for PTSB Journeys
• Ulster Bank customer facing staff within the perimeter have the
Cultural opportunity to move to PTSB (via TUPE). New Customer
Open Inclusive Growth Culture • New growth opportunities will be created for staff in both Facing Staff
organisations
• Transformative change opportunity to rethink business processes, champion
Simplification simplification and create Cost Synergy Opportunities by eliminating complex Transformative
processes Change
Simplify Business Processes Opportunity
• Productivity enhancements by combining complementary networks
Profitability • Increased scale will create a more robust balance sheet with increased income, a stable Increased
Grow Sustainable funding profile and strong/improving capital and other ratios Income and
Profitability Scale
24Strong Ambition, Purpose And Priorities
Strategic Priorities Will Drive Sustainable Returns
Our Ambition Nationwide Physical Right Products, Right Price
To Be Ireland’s Best Personal Footprint
A continued physical presence in
And Small Business Bank our communities in Ireland,
The right products, at the right price,
with strong market share in our
helping our customers in person target segments
when they need sales support
Our Purpose
To Work Hard Every Day to Digitally Led Routine Service On Digital
Channels
Build Trust with Our Customers
Everyday, routine transactions will
- We are a Community Serving Opti - Channel with digital
capabilities on key sales & transition to digital channels and be
the Community service journeys available at a time that is convenient
for our customers
Customers Transform Medium Term1
• Supporting Customers At Every Stage Of Life • Enhancing Customer Journeys For A More • Material Loan Book Growth
Digital World
• NIM c. 1.90%
• Powered By Partnerships & Innovation
• Simplifying Our Business Improving • Increasing Fee Income
• Digital Support For Customers Every Day Customer Experience
• Cost Income Ratio < 60%
Banking Needs
• Increasing Efficiency And Reduce Costs • CET1 Ratio >14%
• Developing a distinctive offer for Business
• ROTE >9%
Customers • Successfully combining “Bricks and Clicks”
25 1. Indicative Medium Term Objectives to be finalised as part of Due Diligence phase.I N T E R I M R E S U L T S
2021
AppendixDomestically Focused Retail And SME Bank
Business Overview Our Physical Landscape
Business
€13.8bn €6.5bn €10.5bn
Performing Current Account Retail Deposit
Loan Book Balances Balances
Dublin Region
25 Branches
Market Share
South & East Region
25 Branches
c.15% 12% 10%
Residential Current Account Retail Deposit North & West Region
Mortgage Balances2 Balances2 26 Branches
Balances1
1. % Market Share of Stock of Mortgages as at June 2021. Source: Banking Payments Federation of Ireland.
27 2. Data based on balances as at May 2021. Source: Central Bank Statistics.Historical Financial Information – Income Statement
€m HY2021 FY 2020 FY 2019 FY 2018 FY 2017
Net Interest Income 152 341 356 379 407
Other Income 15 34 58 63 38
ELG Fees - - - - (2)
Total Operating Income 167 375 414 442 443
Total Operating Expenses (Before (168) (329) (330) (331) (329)
Exceptional Items)
Pre-Impairment Profit / (Loss) (1) 46 84 111 114
Impairment (Charge) / Write-Back (3) (155) (10) (17) (49)
(Loss) / Profit Before Exceptional Items (4) (109) 74 94 65
Exceptional Items (Net) (5) (57) (32) (91) (13)
(Loss) / Profit Before Tax (9) (166) 42 3 52
Key Metrics FY 2021 FY 2020 FY 2019 FY 2018 FY 2017
Net Interest Margin 1.50% 1.73% 1.80% 1.78% 1.80%
Cost Income Ratio 1 88% 73% 80% 75% 74%
28 1. Cost Income Ratio is calculated as Operating Expenses (excl. Regulatory Charges and Exceptional Items) divided by Total Operating IncomeHistorical Financial Information – Balance Sheet
€bn Jun 2021 Dec 2020 Dec 2019 Dec 2018 Dec 2017
Total Loan Book (net) 14.2 14.2 15.6 15.9 18.4
Treasury Assets 6.5 5.9 3.6 3.8 3.5
Other Assets 0.8 0.8 1.1 2.1 0.9
Total Assets 21.5 20.9 20.3 21.8 22.8
ROI Retail Deposits (Incl. Current Accounts) 17.0 16.3 15.0 14.8 14.3
Isle of Man Deposits - - - - -
Corporate & Institutional 1.5 1.7 2.2 2.2 2.7
Total Customer Deposits 18.5 18.0 17.2 17.0 17.0
Wholesale Funding 0.8 0.8 0.9 2.6 3.3
ECB Funding - - - - 0.2
Other Liabilities 0.4 0.2 0.2 0.2 0.2
Total Liabilities 19.7 19.0 18.3 19.8 20.7
Total Equity (incl. AT1) 1.8 1.9 2.0 2.0 2.1
Total Equity and Liabilities 21.5 20.9 20.3 21.8 22.8
Key Metrics:
NPLs €1.0bn €1.1bn €1.1bn €1.7bn €5.3bn
LDR 77% 79% 91% 93% 108%
CET1 Ratio (Fully Loaded Basis) 15.3% 15.1% 14.6% 12.2% 15.0%
29Interest Income Analysis
Average Balances (€bn) Yields (%) Interest Income (€m)
H1 2021 H1 2020 H1 2021 H1 2020 H1 2021 H1 2020
Tracker 6.7 8.7 1.3% 1.3% 43 54
Fixed and Variable 7.2 7.1 3.3% 3.6% 116 125
Consumer Finance 0.3 0.3 10.4% 10.1% 14 16
SME / CRE 0.2 0.2 3.8% 3.0% 4 3
Treasury Assets 6.2 4.1 -0.1% 0.2% (2) 4
Underlying Interest Income 174 203
Deferred Acquisition
Costs and Accounting (9) (11)
Adjustments
Total Interest Income 165 191
30Interest Expense Analysis
Average Balances (€bn) Cost of Funds (%) Interest Expense (€m)
H1 2021 H1 2020 H1 2021 H1 2020 H1 2021 H1 2020
Current Accounts 6.2 5.0 0.0% 0.0% 0 0
Retail Deposits 10.6 10.4 0.1% 0.2% 3 9
Corporate Deposits 1.6 2.1 0.5% 0.5% 4 5
Wholesale Funding 0.9 1.0 1.3% 1.1% 6 6
Underlying Interest Expense 13 20
Other 0 0
Total Interest Expense 13 20
31Asset Quality
30-Jun 31-Dec
Loans and Advances to Customers
2021 2020
Measured at Amortised Cost €m €m
Home Loans 12,435 12,338
Buy To Let 1,893 2,009
Total Residential Mortgages 14,328 14,347
SME / CRE 186 181
Consumer Finance 334 327
Total Measured at Amortised Cost 14,848 14,855
Analysed By ECL Staging
Stage 1 11,500 10,575
Stage 2 2,304 3,152
Stage 3 1,042 1,127
POCI 2 1
14,848 14,855
Neither past due nor Stage 3 13,746 13,692
Past due but not stage 3 58 35
Stage 3 1,044 1,128
Loss Allowance – Statement of Financial
14,848 14,855
Position
Stage 1 94 55
Stage 2 248 286
Stage 3 361 387
Total Loss Allowance 703 728
32NPLs and NPAs
Stage 3 Analysis
30-Jun 21 Home Loan Buy-To-Let Commercial Consumer Finance Total
€m €m €m €m €m
NPL is < 90 Days 425 256 45 1 727
NPL is > 90 Days and < 1 year past due 46 48 1 6 101
NPL is 1-2 years past due 38 18 - 1 57
NPL is 2-5 years past due 26 6 1 2 35
NPL is > 5 years past due 75 39 4 4 122
POCI - - - 2 2
Non-performing loans 610 367 51 16 1,044
Foreclosed assets1 7 22 - - 29
Non-performing assets 617 389 51 16 1,073
Gross Loans 12,435 1,893 186 334 14,848
NPLs as % of gross loans 4.9% 19.4% 27.4% 4.8% 7.0%
Stage 3 Analysis
31-Dec-20 Home Loan Buy-To-Let Commercial Consumer Finance Total
€m €m €m €m €m
NPL is < 90 Days 464 319 28 1 812
NPL is > 90 Days and < 1 year past due 42 32 1 9 84
NPL is 1-2 years past due 42 14 - 1 57
NPL is 2-5 years past due 21 4 2 1 28
NPL is > 5 years past due 89 49 4 4 146
POCI - - - 1 1
Non-performing loans 658 418 35 17 1,128
Foreclosed assets* 25 5 - - 30
Non-performing assets 683 423 35 17 1,158
Gross Loans 12,338 2,009 181 327 14,855
NPLs as % of gross loans 5.3% 20.8% 19.3% 5.2% 7.6%
33 1. Foreclosed assets are assets held on the balance sheet which are obtained by taking possession of collateral or by calling on similar credit enhancements.Regulatory Capital
30 June 21 31 Dec 20
Transitional Fully Loaded Transitional Fully Loaded
€m €m €m €m
Risk Weighted Assets 8,486 8,481 8,480 8,471
Capital Resources:
Common equity tier 1 1,481 1,296 1,535 1,282
Additional Tier 11 123 123 190 198
Tier 1 Capital 1,604 1,420 1,725 1,480
Tier 2 Capital 290 290 54 59
Total Capital 1,894 1,710 1.779 1,539
Capital Ratios:
Common Equity Tier 1 Capital 17.4% 15.3% 18.1% 15.1%
Tier 1 Capital 18.9% 16.7% 20.3% 17.5%
Total Capital 22.3% 20.2% 21.0% 18.2%
Leverage Ratio2 7.4% 6.6% 8.2% 7.1%
30 June 21 31 Dec 20
Transitional Fully Loaded Transitional Fully Loaded
€m €m €m €m
Total Equity 1,808 1,808 1,951 1,951
Less: AT1 Capital (123) (123) (245) (245)
Adjusted Capital 1,684 1,684 1,706 1,706
Prudential Filters:
Intangible Assets (40) (40) (72) (72)
Deferred Tax (250) (347) (213) (343)
IFRS 9 Transitional Adjustment3 87 - 122 -
Others (1) (1) (8) (9)
Common Equity Tier 1 Capital 1,481 1,296 1,535 1,282
1. The amount of Additional Tier 1 (AT1) Capital and Tier 2 instruments included within the consolidated capital of the holding company is restricted within
the limits laid down under the CRR. Effective 1 January 2018, these restrictions are now fully phased in.
2. The leverage ratio is calculated by dividing Tier 1 Capital by gross balance sheet exposure (total assets and off-balance sheet exposures).
3. The CET1 transitional impact to the Group as a result of EU Regulation 2017/2395 mitigating the impact of the introduction of IRFS 9 own funds. This
34 was further amended by the adoption of Regulation EU 2020/873 (“CRR Quick Fix”)I N T E R I M R E S U L T S
2021
Thank You
End of PresentationYou can also read


