2021

CHINA MARKETING & MEDIA TRENDS
←
→
Page content transcription
If your browser does not render page correctly, please read the page content below

2021 CHINA MARKETING & MEDIA TRENDS

ABOUT THIS REPORT

2021 BRAND MARKETING & MEDIA PLANNING OUTLOOK
Every year, Totem surveys senior marketing leaders to better understand the insights and
priorities of Global brands in China.

With this year’s survey, we sought to gain an understanding for:

-    Overall sentiment changes (especially in light of Covid)
-    Whether brands were increasing, decreasing marketing budgets
-    How priorities have changed, what areas brands are investing into now
-    Views on effectiveness of key channels; WeChat, Douyin, Tmall…
-    What digital channels and tactics hold the most potential for brands

A few key insights follow from this survey and analysis:

1.   Sentiment and consumer growth in China is strong
2.   Brands are shifting from diffused (mass), to more targeted (DTC) marketing
3.   Social and ecommerce are moving even closer together
4.   Forget ‘paths-to-purchase,’ it’s become ‘see now, buy now’ for consumers in China
5.   Use of video is now table stakes for brands who want to engage on social
6.   Brands need to re-adjust digital channel portfolios
7.   Opportunities with smaller, niche apps are emerging

Chris Baker
Founder, Totem Media
CONTENTS

    BIG PICTURE                                                     3-8
    A look at overall market conditions, sentiment and media
    inflation expectations.

    TOTEM BRAND SURVEY                                              9 - 14
    Review of Totem’s annual brand survey, looking into
    sentiment, goals and priorities for brands in China.

    SOCIAL-COMMERCE MELD                                            15 - 23
    Social media and ecommerce functions in China
    continue becoming more integrated. There are three
    modes for marketing in China.

    VIDEO AS TABLE STAKES                                           24 - 28
    Livestream video has taken China by storm in the past few
    years. Video is now critical to driving marketing success.
    Brands must create more holistic strategies for video.
                                                                              CHANGING DIGITAL PATHS
                                                                              There are new modes for brand growth in China
                                                                              emerging, which change the established thinking
    FOUNDATIONAL CHANNELS                                           29 - 35              about customer journeys.
    What priorities do brands have for investments into core
    digital marketing, social channels in 2021? What channels are
    emerging as new priorities for brand investment?

    NICHE CHANNELS                                                  36 - 59
    How should brands be looking to balance investments into
    foundational channels and newer, experimental channels?
    How is the overall landscape likely to change?

                                                                                                                          TOTEM
Looking back at data from 2020,
the Covid downturn in China looks
like a small quarterly blip. Growth
and sentiment quickly recovered
and (in many ways) surpassed
prior levels.

Advertising spend is moving
upward, well in-line with long-term
forecasts for growth.

And, China projections for ad
costs reflect this positive
trajectory, with significant inflation
expected across all forms of
media.

Cost increases are most notable in
digital, as China continues to
increase its already large bias
towards digital, mobile media.

DIGITAL DOMINATES IN CHINA

                                  are added, the overall share of ‘digital’ ad spend jumps from 40-45% share (which is consistent with the share in US),

DIGITAL AD SPEND CONTINUES GROWTH
                                                                                                    DIGITAL AD SPENDING IN CHINA, 2019-2024 (BILLIONS)
China is overwhelmingly biased toward digital ad
spending.
                                                                                                                                                                                    79.3%
                                                                                                                                                               77.4%
                                                                                                                          73.6%            75.3%
Official estimates show that >40% of ad spend in                                                         71.6%
China goes to digital (which is comparable to the                                        68.4%                                                                                120.90
US share of advertising in digital).                                                                                                                       109.12
                                                                                                                                       97.86
However, when the ‘digital’ components of other
formats (eg. TV and Outdoor) are fully accounted                                                                      87.38
for, the share of digital ad spend in China jumps up
                                                                                                     75.33
into the range of 60-70%.                                                            71.74

And, over 80% of all digital advertising spend is
mobile versus only a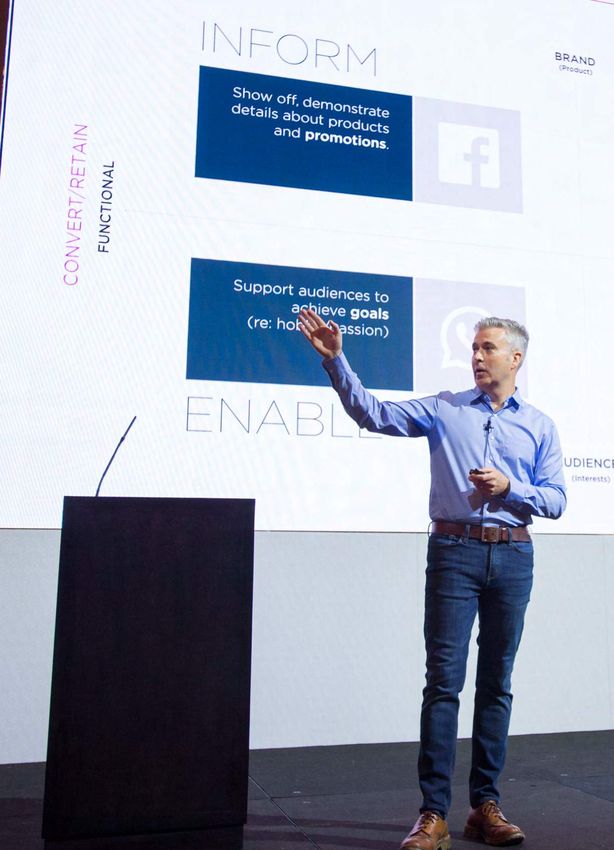
DIGITAL DOMINATES IN CHINA

                                                                                                                          Title
DIGITAL AD SPEND CONTINUES GROWTH                                                                                                                                                         1.6%
                                                                                          CHINA AD SPEND MARKET MEDIA MIX 2019 VS 2020
                                                                                                                                                                                            0.5%

Digital represents the dominant share of advertising                                                                                                                                0.7%
                                                                                                                                                                                                  0.4%

spend in China. It’s also where the bulk of media
cost inflation is happening.
                                                                       2020             41.4%                                   27.9%                             27.5%

                   2021 PROJECTED INFLATION RATE (%)

Digital Display                                  21.9%

         Social                                                38.1%
                                                                              Digital       Outdoor           TV         Cinema           Radio          Newspaper            Magazine

 Online Video                                       25.1%                                                                                                                             2.0%

    Streaming                                        25.5%                                                                                                                                 0.7%
                                                                                                                                                                                   2.9%
                                                                                                                                                                                                  0.5%
            TV            5%

          OOH                        12%

         Radio         2.8%                                            2019             41.4%                                  23.2%                           29.3%
     Magazine           4.2%

   Newspaper       0.4%

                  0%           10%         20%           30%   40%

With most digital formats projected to increase by >20% in
2021, it will be interesting to see if other formats, and/or smaller
digital channels start receiving a greater share of budgets.

                                                                                 Source: ADP (TV, Radio, Newspaper, Magazine, Cinema), CODC (OOH), Iresearch (Digital — PC & Mobile) 2018-2020
CONFIDENCE REBOUNDS IN CHINA

               THE COVID DOWNTURN WAS JUST A BLIP                                                   2019 Q1 - 2020 Q4 INTERNET AD SPEND IN CHINA (RMB BILLIONS)

               Consumer retail sales and digital ad spend both
               saw a sharp drop in the first quarter of 2020 but
               rebounded sharply.

                                                                                    200
               Online activity (ad spend and sales) is consistent with                     18.3%       13.7%    12.9%     14.5%               18.7%     22.7%     25.0%
               consumer sentiment levels - which are trending above pre-
               Covid levels.
                                                                                                                                   -19.9%                           171
                                                                                    150

                                                                                                                          137                            139
                                                                                                                                              129
                     ONLINE RETAIL TRANSACTIONS VALUE (RMB BILLIONS)
                                                                                            111        109       114
                                                                   1,955
                                                                                    100
             2,000
                                                1,836                      1,869
                                                                                                                                     89
Value Axis

                              1,562    1,556
             1,500

                     1,179
                                                         1,252                       50
             1,000

              500                                                                    0
                     Q1 '19   Q2 '19   Q3 '19   Q4 '19   Q1 '20   Q2 '20   Q3 '20         2019 Q1    2019 Q2   2019 Q3   2019 Q4   2020 Q1   2020 Q2   2020 Q3e   2020 Q4

                                                                                                                                                           Source: QuestMobile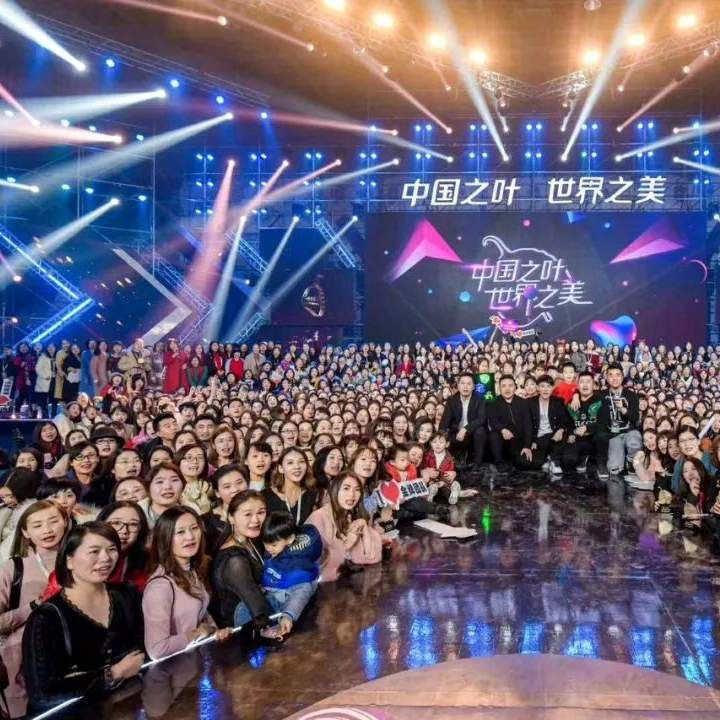
AUDIENCE TIME SPENT - MOBILE

MOBILE DOMINATES AUDIENCE TIME
                                                                                                      Audio (Podcasts)
                                                                Livestream Video                      11%
Digital time in China is mobile.                                              7%
                                                                                                      Music
Chinese audiences spend (in the range of) 6.5                       Short Video                       8%
hours/day compared to 3hrs 45mins/day for                                    9%
audiences in the USA.

The allocation of time on mobile is split as follows:                              SHARE OF           Games
                                                                                                      9%
- 29% for consumption of Video
- 28% for Games, Music & Audio
                                                                                   USER TIME
                                                                     Long Video
- 13% for Messaging (WeChat, etc)                                           13%    ON MOBILE

                                                                                   2020
- 15% for Education, News & Reading                                                                   Education
- 16% for Other                                                                                       6%

                                                                                                      News
With 1.0 Billion mobile users, 75% of whom use mobile                                                 5%
payments every day, it’s not surprising to see why ecommerce,
digital and mobile are so central to brand growth planning in                                         eBooks
                                                                      Messaging
China - and why new routines and innovations in marketing are               13%                       4%
emerging from China. Brands interested in understanding the
future of marketing should spend time following what’s
happening in China.                                                                                   Others
                                                                                                      16%

                                                                                               Source: Source: China Telecom, 2020
For the past several years, Totem
has run a survey of senior leaders
at Global brands in China, to
gauge sentiment and glean
insights into how marketing
investments and media plans are
taking shape, for the coming year.

In our 2021 survey, we had 71
participants, across 12 categories
(all brands are consumer facing, all
are international).

While sentiment and budget
projections are down in some
categories which were hit hard by
Covid (eg. Travel), overall
sentiment is strong and in-line
with prior years. In many cases,
China marketing is now seen as a
priority for Global brands, as a hub
for growth.
BRANDS’ OUTLOOK FOR 2021 IS
GENERALLY POSITIVE, WITH STEADY
    YEAR-OVER-YEAR BUDGET
      INCREASES PLANNED.

     Sentiment for 2021 is in fact trending higher than pre-Covid sentiment was (eg.
      late 2019). Prior to Covid there was some downward trend in both consumer
   sentiment and brand optimism. While brands whose businesses took a hit in 2020,
             are pulling back, most brands in 2021 have increased optimism.
A MOSTLY POSITIVE OUTLOOK FOR 2021
A MUCH BETTER YEAR THAN 2020 HOW WOULD YOU DESCRIBE YOUR OVERALL OUTLOOK FOR 2021?
Brand sentiment has generally improved when 100
compared to pre-Covid (late 2019) sentiment. Prior
to Covid, there was a growing number of brands 16.9% VERY OPTIMISTIC
facing growth and margin challenges.
Brands that adapted well to Covid (and were in the 75
right categories to benefit from changing consumer 26.8% SOMEWHAT OPTIMISTIC
needs), have seen strong growth in the succeeding
months.
There are however a number of brands who 50
continue to face challenges with growth and
margins. Additionally there are a number of brands NEUTRAL
35.2%
in categories hurt by changes during the past year
(eg. travel). In sum, about 20% of brands have a
negative outlook for 2021. 25
14.1% SOMEWHAT NEGATIVE
There is, as a result, a mix of strong sentiment and
dampened expectations for 2021 among the set of
brands surveyed. 7% VERY NEGATIVE
0
Source: Totem Media 2021 China Brands Survey n=71BRAND GOALS FOR 2021
BRANDS RE-ALIGN TO NEW CONDITIONS WHAT MARKETING GOALS ARE PRIORITIES FOR 2021?
There is a general sense among brands, of needing
to re-align to a new set of conditions in the market;
Brand Awareness 20%
new sales routines, shifts in consumer behaviors,
and changes with products/categories.
Sales (Conversion) 19%
As brands seek to understand customers better
and cozy up to them in new ways, brand awareness
and sales are viewed as concurrent goals. Customer Loyalty (Repeat Purchase) 18%
This reflects a general shift toward more customer
Improve Customer Experience 15%
centric, DTC (direct-to-consumer) models for brand
growth.
Customer Insights/Data 12%
The customer focused imperative is a change from
past marketing routines which were a bit more
‘spray-and-pray’ in China, where priority was given Operations Efficiency 8%
to more mass communications. There is a growing
interest now in more targeted, more efficient, results
Brand Image 7%
focused marketing.
Source: Totem Media 2021 China Brands Survey n=71BRAND SPENDING IN 2021
MOST BRANDS TO INCREASE SPENDING IN 2021 HOW DOES YOUR BRAND PLAN ON ADJUSTING MARKETING SPEND IN 2021?
Nearly 60% of brands have planned budget
increases for marketing in 2021. 23% plan to keep
OVERALL
budgets un-changed. 18% plan to decrease overall MARKETING
8% 10% 23% 35% 14% 10%
budgets.
Digital and social media continue to trend higher
than overall marketing budgets - which has
consistently been the case for the last several years.
Even brands who have planned decreases in overall DIGITAL 3% 7% 21% 24% 27% 18%
marketing budgets are maintaining efforts into
digital, while affecting decreases elsewhere.
There is however a slight curtailing of budget
increases for social media - which is a sub-set of
digital. The perception is that social is now a
SOCIAL
foundational (if slightly static) part of the overall 1% 6% 25% 32% 23% 13%
MEDIA
marketing playbook for many brands. “Digital” by
contrast includes investments into a range of new
capabilities, including O2O, AR/VR, Livestreaming
etc. - and therefore has a larger rate of increase.
Decrease of > 10% Decrease ofBUDGET PULLBACK?
INEFFICIENCY SLOWLY BEING CUT OUT WHAT AREAS (IF ANY) ARE BUDGET CUTS PLANNED FOR, IN 2021?
Overall, relatively few brands are making budget
cuts for 2021. When compared with Totem’s 2020 Influencer Marketing 17%
brand survey, there is only a slight increase in
planned budget cuts for 2021.
Brand-Level Media Investments 15%
For those brands that are planning cuts to budgets,
influencer marketing and brand-level media
Technology & Data Systems 11%
investments were the top planned cuts.
There is still a race amongst brands to capture Agencies & Vendors 8%
marketshare in China - which generally leads to
wastage - and overspending on un-targeted ads.
Branded Content & Creative 6%
2020 signaled a shift toward more efficiency in
marketing, with greater priority being assigned to Performance Ads 6%
targeting and performance - with blanket marketing
activities (eg. mass media and larger influencers)
being clipped back. Internal Staff & Resources 4%
Source: Totem Media 2021 China Brands Survey n=71There is a distinct sense that marketing strategies and goals in China are changing. Brands are shifting from mass marketing, to more direct (D2C) strategies, focusing more on audience insights, data and more detailed targeting. At the same time, new routines are being developed around livestreaming, private traffic and other activities which meld content more closely with commerce. Totem distinguishes three modes for marketing in China, each one built around a key platform; (1)Tmall, (2)WeChat and (3)Douyin.
THE CONNECTION BETWEEN
CONTENT-AND-COMMERCE IS GOING
  TO BE CRITICAL FOR BRANDS TO
        PLAN AND MASTER.
    Insight: Livestream selling was the most notable example of this in the past couple
     of years, but this theme will proliferate across all channels in the year(s) to come.
      Brands which once built funnels and complex paths-to-purchase, now need to
      work more toward supporting ‘instantaneous’ results - converting attention-to-
                                 action within each channel.
INVESTMENTS IN CHANNELS
HOW DO YOU PLAN ON ADJUSTING YOUR BRAND’S FORMAT SPEND IN 2021?
Livestream Video 3% 14% 27% 33% 23%
Private Traffic 3% 10% 38% 29% 20%
CONTENT-COMMERCE MERGING
Live Service Media 2% 8% 41% 31% 18%
The distinction between brand (awareness) and OOH 2% 10% 40% 34% 14%
performance (conversion) marketing is blurring
ECommerce 4% 48% 38% 10%
quickly in China. All media in China is ‘digital’ and, if
planned well can be measured and actionable. Social Commerce 6% 16% 36% 27% 15%
Podcasts - Audio Apps 6% 53% 38% 3%
In our 2021 survey, brands appear to favor
Ads on Tmall/JD 5% 12% 45% 24% 14%
concepts/formats which combine the best of
content (brand) and content (sales); livestream News Channel/Portals 5% 16% 42% 37%
video, private traffic, ecommerce, social commerce… Gaming 4% 11% 48% 24% 13%
Short Video 4% 17% 43% 25% 10%
While there is a bias toward conversion-focused
Influencers 14% 8% 44% 27% 7%
marketing, content-centric formats such as
podcasts, gaming, sponsorship and long-form video Sponsorships 5% 19% 44% 21% 12%
represent some of the more interesting areas for Long Video 2% 14% 53% 22% 9%
investments in brand building (affinity, emotional
Mini-Programs 13% 17% 45% 23% 3%
connections).
Display Ads 9% 16% 50% 21% 4%
Vertical Media Channels 6% 18% 55% 18% 4%
Search Marketing 3% 12% 69% 15% 1%
OTT 6% 18% 61% 15%
OTV Ads 3% 24% 61% 10% 1%
Large Decrease Small Decrease No Change Small Increase Large Increase
Source: Totem Media 2021 China Brands Survey n=71Social Commerce The modes for brand growth in China are evolving quickly. Social and commerce are moving closer together. With every channel in China designed for both content/discovery and for commerce/conversion, there is the expectation that paths-to-purchase can be abbreviated. Marketing in China is being designed around the increasing behavior by consumers to; “See Now, Buy Now.”
THE CHINA ECOSYSTEM IS DIFFERENT

                  GLOBAL
                  CUSTOMER JOURNEYS
                                      CHINA
                                       ‘SUPER APPS’ FULLY
                   ACROSS CHANNELS    ENCIRCLE AUDIENCES

                    AWARENESS            AWARENESS

                                        CONSIDERATION
*Advertising as                                                     *Digital platforms
predominant                                                         prioritize eCommerce
business model                            PURCHASE                  business model
                  CONSIDERATION

                     PURCHASE
                                           PAYMENT

                                         ENGAGEMENT

                                        ENTERTAINMENT
THERE ARE THREE MODES FOR
AUDIENCE CULTIVATION & BRAND
GROWTH IN CHINA.
Insight: These three modes coincide closely with the emergence of China’s big
three holding companies; 1. Alibaba (Taobao/Tmall), 2. Tencent (WeChat), and 3.
Bytedance (Douyin/Tiktok).
Domestic, Chinese brands are always first to recognize, understand and take
advantage of new modes for brand growth.THREE MODELS FOR GROWTH
MODE ONE: TMALL/TAOBAO MODE TWO: WECHAT MODE THREE: DOUYIN/RED
ADVERTISING-TO-COMMERCE COMMUNITY-TO-COMMERCE CONTENT-TO-COMMERCE
The early growth of digital-first brands in China With WeChat as THE hot channel, starting in The current mode of digital growth is defined
was squarely focused on Taobao and Tmall, with 2011, business models shifted toward; the less by a specific channel and more by a range
conversion organized around conventional development of multi-level distributors, the use of tactics which can be best observed by
“funnel” strategies; advertise to create of private traffic and a range of other user-get- what’s happening on RED and Douyin, where
awareness, convert traffic on Tmall/Taobao. user tactics. The goals in this model are to build brands are building high-levels of attention and
Alibaba has built its ecosystem in support of a large follower base, and; (1)to convert the then converting that attention in the moment.
this model, with systems to drive traffic volume followers to sales, (2)encourage repeat Livestream selling with KOLs is one of the
to branded destinations (flagship stores). purchase and (3)incentivize WOM referrals. notable tactics of “Mode Three.”
WEBSITE TMALL WEIBO JD WECHAT PDD DOUYIN RED KUAISHOU BILIBILI
Three Squirrels is representative of the first OneLeaf represents ‘Mode Two’ with a Perfect Diary has applied ‘Mode Three’ growth
mode of local, digital native brands in China. marketing/sales model similar to Amway. strategies very effectively.THREE MODES OF DIGITAL GROWTH IN CHINA
TMALL/TAOBAO (Mode One) 2016 2019
WECHAT (Mode Two) Taobao Live
Acquired Kaola &
was Launched
RED/DOUYIN (Mode Three) Expanded Cross Border Ecomm.
2020
SCALE OF ECOMMERCE
2016 Channels (short video), Live
Stream, Hashtag Launched 2020
Mini-Program
Launched RED Live
2012 2019 Launched
Douyin Shop
2014 2018 Launched
Tmall was
launched
WeChat Pay
Launched Live-streaming e-
commerce was taking off.
2017
2010 Douyin
Launched
Juhuasuan (Group 2016
buy) was Launched
2009 RED Store
Launched
First 11.11. shopping 2012
festival
2008 Moments & WeChat
Official Account
Launched
Taobao became the largest
marketplace in China.
2003 2013
2011
Taobao & Alipay
Launched WeChat Launched RED Launched
2003 2008 2010 2012 2014 2016 2018 2020
ADVERTISING-TO-COMMERCE COMMUNITY-TO-COMMERCE CONTENT-TO-COMMERCENOT ALL CHANNELS ARE EQUAL
CULTIVATING SALES VS TRUST
Some channels - such as DOUYIN - amplify
CONVERT EXCITEMENT TO content quickly, creating rapid attention and
SALES excitement, with attention dropping as quickly
as it rose.
Other channels - such as WeChat - are less
AUDIENCE ATTENTION EXCITEMENT
good at creating peak moments of
excitement BUT are good for creating
discussions and service which build trust.
CONVERT
DOUYIN: Converts excitement to action. It’s
DOUYIN great at creating rapid awareness and
ENGAGE & CULTIVATE
supporting impulse purchases (fashion,
TRUST beauty, hobbies…). Douyin is “Mode Three.”
CONVERT
WECHAT: Well designed for building trust
WEIBO CONVERT and cultivating audiences and WOM. It’s
better for creating more thoughtful
WECHAT engagement and most effective for
supporting higher-involvement purchases
(luxury, travel, home/baby, IT…).
WeChat is “Mode Two.”
WEIBO: It’s running the risk of being
overshadowed by Douyin and WeChat, but is
effective in supports discovery and is highly
DURATION LIFESPAN OF POST
linked to other channels (Tmall) and to
search/linking. It’s a place for consumers to
validate a brand before purchasing on Tmall.
Weibo is most aligned to “Mode One.”GOING FORWARD, INTO 2021, VIDEO
WILL BE TABLE STAKES FOR BRANDS
WHO WANT TO FUEL AUDIENCE/
BRAND GROWTH.
Insight: More broadly, it’s the connection between content-and-commerce which
is going to be critical for brands to plan and master. Livestream selling was the
most notable example of this in the past couple of years, but theme will proliferate
across all channels in the year(s) to come.LIVESTREAM VIDEO & SALES
LIVESTREAM ECOMMERCE
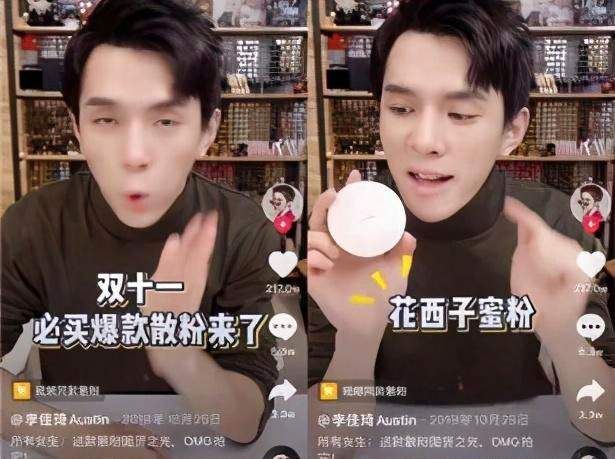
Alibaba is a clear leader (still) with Tmall Live as the 1,000 2017 - 2020 LIVESTREAMING TRANSACTION (RMB BILLIONS) BY PLATFORM
leading Livestream platform for sales. The success
of these platforms is highly dependent on ‘star 850
power’ - KOL ‘pitch people’ like Austin Li and Viya
are profoundly important for the platforms …and
Taobao Kuaishou Douyin
when in comes to sales success for brands.
667
KPMG estimates that GMV from Livestreaming will exceed
RMB1.0 trillion in 2020, and, perhaps more importantly, will
represent a 9% share of the total ecommerce GMV for China.
500
1,995
100%LIVESTREAM ECOMMERCE SALES/SHARE 2000 375 360
90% Share of e-commerce
80% GMV (RMB Billion) 333
1500
70%
250
60%
50%
1,050
1000
200 200
40% 150
30%
434 500
100
20% 14%
10% 1402% 4%
9%
25 30 40
371% 10
-0% 0 0
2017 2018 2019 2020 2021(e)
2017 2018 2019 2020 2021(e)
Source: Qianzhan, KPMGLivestream video has been a catalyst in resetting expectations for video, as marketing table stakes. As the exuberance over ‘livestream selling’ settles down, look for livestreaming to play a more routine function for brands in; creating branded experiences, engagement, and in customer service and sales. Brands that want to participate in this step-change to video will have to setup the resources and routines to produce an array of video content, serving multiple goals; branded storytelling, interest-based content, customer service, technical support, product demos, and sales.
BRANDS MUST DO MORE WITH LIVESTREAM VIDEO

                                                                                                            BRAND
                                                                                                            GROWTH

                                                                             3rd Party KOLs/Media can                   Brand storytelling and
                                                                                kick-start awareness,                   interest-based content
                                                                              interest in (a new) brand,              creates meaningful, lasting
                                                                               product …and/or widen                       engagement with
                                                                              appeal to new segments.                         audiences.

                                                                                                                                                                                                                   HIGH EQUITY
LOW EQUITY

                                  Livestream brand introductions and                                                                                   LandRover did a 30hour livestream

                                                                                                                                                                                               (Retain Audience)
             (Rent Audience)

                                  product demos from KOL accounts.                                                                                      to tell the story of its brand, and
                                                                                                                                                                 legacy on Douyin.

                                                                             KOL Livestream sales spark               Institutionalized broadcasts
                                                                             the link between attention-                  by brands (customer
                                                                              action, to generate quick                service, product demos) -
                                                                             sales and …ideally establish              elevates consideration, re-
                                                                                   “hero products.”                           enforces trust.

                               Austin Li, using his own channel to sell to                                                                             Beauty brands have institutionalized
                                   his audience, helped create a hero                                                                                  daily customer engagement, service
                               product for Florasis. He is a true advocate                                                                             and sales livestreams …all from brand
                               for this brand but for other brands, it can                                  CONVERT                                             “owned” accounts.
                                         be coldly transactional.
                                                                                                            SALES
LIVESTREAMING MEETS O2O
LOCATION-BASED LIVESTREAMING
While WeChat has not had much success (to-date)
with its Livestreaming efforts, in early 2021, it
deployed an interesting feature, allowing audiences
to “look around” and find Livestreams “Nearby.”
While this is yet to be proven as an important
feature, it is worth evaluating for brands with large
offline retail footprints.
With this function, a brand with 10’s or 100’s of
shops across China could activate local audiences
in/near each of those locations, by creating routine
Livestreams in those locations - becoming more
discoverable, across more locations.
The further opportunity with localized Livestream comes with
being able to be much more specific to local culture, activities,
weather …etc. Want to promote a connection to boardsports for
your brand? Do snowboard tutorials in Beijing, Skateboard
tutorials in Shanghai and Surfing tutorials in S. China.
Find Livestreams Nearby - WeChat’s Livestream features location (proximity) capabilities.RED & BILIBILI ARE QUICKLY
BECOMING FOUNDATIONAL
CHANNELS FOR BRANDS
Insight: GenZ’s preferences for newer channels is shifting the media landscape for
brands. While Tmall, WeChat and Weibo all remain as foundational channels, there
is a possibility to see some new foundational channels emerge - and a wider set of
channels put into play. Cost increases on mainstream channels could accelerate
some of this shift.INVESTMENTS IN CHANNELS
HOW DO YOU PLAN ON ADJUSTING YOUR BRAND’S CHANNEL SPEND IN 2021?
BILIBILI, RED TO LEAD WITH NEW INVESTMENT
BiliBili 5% 34% 39% 21%
Brands looking to unlock stronger, more expedient
growth, are increasing investments into BiliBili, RED RED 2% 7% 33% 27% 31%
and Douyin - provided that brands have products
which are complimentary with the audiences in
Tmall 3% 17% 23% 24% 34%
these channels.
Many/most brands are already fully invested into Tmall Live 13% 12% 29% 19% 28%
foundational channels such as WeChat and Weibo.
Therefore, newer channels such as BiliBili and RED Douyin 3% 8% 55% 13% 22%
benefit from being newer, more ‘greenfield’ and
often less costly.
Zhihu 3% 9% 54% 26% 9%
The other big story in terms of where brands are
making investments for 2021 is with the continued WeChat 10% 13% 46% 20% 11%
investments into Livestreaming, which are centered
around Tmall Live. Kuaishou 3% 10% 55% 21% 10%
Tmall Live also saw many brands planning to decrease budgets.
JD 5% 15% 49% 18% 13%
There is a sense among some brands who have experimented
with Livestream selling that it’s costly and did not yield
adequate ROI. Weibo 2% 13% 65% 10% 11%
Large Decrease Small Decrease No Change Small Increase Large Increase
Source: Totem Media 2021 China Brands Survey n=71INVESTMENTS IN CHANNELS
THREE YEARS FROM NOW, HOW CONFIDENT ARE YOU THAT THE FOLLOWING CHANNELS
TMALL, WECHAT AND WEIBO MOST STABLE WILL PLAY A KEY ROLE IN YOUR MARKETING PLAYBOOK?
Brands are attracted to ‘shiny new things’ and like Tmall 8% 21% 71%
to invest into hot, new channels.
Tmall Live 18% 40% 42%
Hot channels don’t necessarily become
foundational channels. There is a threshold that WeChat 14% 48% 38%
channels must rise above to hold the status of
being ‘foundational’ and worthy of long-term
Weibo 16% 49% 34%
investment and cultivation.
We asked brands to evaluate these channels based BiliBili 33% 38% 29%
on their confidence that the channel would be
relevant and important in +3years. It is no surprise Douyin 30% 43% 27%
that Tmall, WeChat and Weibo ranked highest, as
they are already viewed as foundational (and most RED 16% 60% 24%
brands have significant sunk costs in them).
JD 20% 70% 10%
Among this group, Kuaishou and Zhihu hold least
confidence for longer-term investments by brands.
Kuaishou 60% 34% 5%
Zhihu 59% 38% 3%
Not Confident Neutral Very Confident
Source: Totem Media 2021 China Brands Survey n=71RESULTS WITH SOCIAL CHANNELS
FOLLOWER NUMBERS IMPACT BRAND MORALE IN 2020, HOW WOULD YOU CHARACTERIZE YOUR RESULTS, WITH FOLLOWER GAINS/LOSSES:
WeChat continues to be challenging for most
brands when it comes to audience costs and traffic. WECHAT 11% 29% 39% 13% 9%
Building and maintaining audiences in WeChat is
considerably higher than other social channels.
WeChat is however working to make brands more
discoverable, so this trend might start to reverse in WEIBO 9% 19% 34% 25% 13%
2021, but for now, it’s a challenge for most,
(especially) smaller, lesser known brands to grow
there.
For newer, smaller, less well funded brands, RED, DOUYIN 3% 8% 41% 28% 21%
Douyin and Weibo offer better prospects for
building awareness and gaining traction.
Most brands have moved past follower count as a metric for RED 5% 37% 30% 28%
evaluating performance. Follower gains/losses do have impact
on morale and …if a brand is gaining in a channel, it tends to re-
enforce decisions to continue investing.
Large Loss Small Loss No Change Small Gain Large Gain
Source: Totem Media 2021 China Brands Survey n=71RESULTS WITH SOCIAL CHANNELS
DOUYIN & RED REACH NEW CONSUMERS IN 2020, HOW WOULD YOU CHARACTERIZE YOUR RESULTS, WITH REACH/AWARENESS:
Douyin performs well in creating new reach,
attention and access to new audiences - and it WECHAT 16% 24% 37% 16% 7%
does so for a wide range of brands.
RED performed almost as well as Douyin in this
area but its utility was somewhat more limited to
brands in fashion, beauty and other youth, female WEIBO 8% 16% 27% 33% 17%
focused areas.
Weibo is still a stable platform for building
awareness/reach - despite seeing attention slip
away, in favor of Douyin and RED in recent years. DOUYIN 2%4% 28% 17% 48%
WeChat performed the worst on this metric
because of a few factors; (1)WeChat is not open,
transparent account-to-account, (2)ads and KOLs
RED 5% 30% 36% 30%
are costly, and (3)measurement (ease of observing
results) is more difficult than other channels.
Large Loss Small Loss No Change Small Gain Large Gain
Source: Totem Media 2021 China Brands Survey n=71RESULTS WITH SOCIAL CHANNELS
RED IS POWERING BRAND TRACTION IN 2020, HOW WOULD YOU CHARACTERIZE YOUR RESULTS, WITH BUSINESS RESULTS (ROI):
Among these core social channels, RED is proving
itself to be a solid performer for helping brands to WECHAT 20% 23% 31% 16% 10%
generate consideration and conversions. The
perception that RED is driving results has a lot to
do with the fact that it’s a higher growth channel
(where audiences are more engaged and active).
Actual sales conversions on RED shops are less WEIBO 6% 14% 52% 22% 6%
impressive.
By comparison, more mature channels like WeChat
(for brands that have successful brands), are
actually much more productive in terms of sales DOUYIN 2% 7% 31% 27% 33%
conversion and as a hub for customer service and
support.
In this context, WeChat is the best performing social
RED 4% 27% 36% 33%
channel for larger, higher profile brands (those with
steady flow of traffic), while, RED is likely to be a
place where smaller brands can get much needed
traction. Large Loss Small Loss No Change Small Gain Large Gain
Source: Totem Media 2021 China Brands Survey n=71RESULTS WITH SOCIAL CHANNELS
SMALLER KOLS (& KOCS) SIZE/PROFILE OF KOL IN USE ACROSS KEY CHANNELS
Further insight into the nature of these four
channels can be gleaned when looking at how
WECHAT
WECHAT 5% 63% 22% 10%
brands deploy KOL resources.
Data from WEIQ in late 2020, show that RED is very
much a grassroots (and less expensive) channel -
with fewer large KOLs and a larger share of small WEIBO
WEIBO 24% 54% 17% 5%
KOLs/KOCs.
By contrast, WeChat is more skewed toward larger
KOLs, Celebrities and official media accounts.
DOUYIN
DOUYIN 10% 71% 8% 11%
This points to a divergence in strategies for larger,
more established brands (using WeChat) and
smaller, earlier-stage brands (using RED, Douyin).
In Totem’s analysis of DTC brands (such as Neiwai, Ubras, RED RED 33% 60% 4% 3%
Florasis, Perfect Diary …etc), we have seen these newer, digital
native brands drive significant growth through over-investing
into RED (and to some extent Douyin).
0 Small KOLs/KOCs
25 Mid-Tier KOLs 50 Large KOLs Others (Celebs, Media)100
75
Source: WEIQ November 2020Brands are increasingly looking beyond mainstream channels to; (1)large, but (often) under- appreciated channels (such as QQ), and (2)smaller, niche channels, which are growing around interests (eg. KEEP). The number of channels considered by brands will likely increase in the years ahead, as brands implement more finely targeted efforts around audience segments/groups. At the same time, anti-trust actions have started to gain momentum, which could see the holdings of BATB spun-off (eg. Alibaba divestments of Weibo, RED, BiliBili), resulting in a degree of freedom for smaller channels to grow.
BRANDS MUST DEVELOP STRATEGIES
   TO BALANCE FOUNDATIONAL
    CHANNELS WITH EMERGING,
      EXPERIMENTAL ONES.
    Insight: While there are new channels emerging, brands need to pick their spots
     and not attempt to maintain too many channels concurrently. Having too many
      channels in operation can be a drag on resources and the quality of audience
      engagement. Very few brands are executing multiple channels well, with high
                              quality content and operations.
MEDIA PORTFOLIO PLANNING
TMALL WECHAT
AUDIENCE SCALE
WEIBO
EARLY ADOPTERS EARLY MASS LATE MASS LATE PASSIVE
Small user base, deep Very quickly growing audience, Hit maximum potential in Very low active engagement.
involvement from creators. strong engagement. terms of audience #s.. Audience #s in decline.
Engagement % static.
DOUYIN
KUAISHOU
RED
BILIBILI
NEW & NICHE
PORTFOLIO
5% 10% 25% 60%
EXPERIMENTAL HIGH GROWTH CORE CHANNEL
(BETS ON BIG WINS) (ACQUISITION) (LONG TERM ENGAGEMENT)INVESTMENTS IN CHANNELS
ESTABLISHED NON-MAINSTREAM CHANNELS FOR BRAND INVESTMENTS
OVERLOOKED BUT NOT FORGOTTEN
There is a large set of digital channels (apps) in Himilaya 21% 35% 44%
China which fall outside the core channels for most
brands but still have; (1)large user bases, (2)strong QQ 34% 27% 39%
engagement, (3)and hold the potential for smart,
successful brand activations (campaigns). Tieba 31% 34% 35%
Among the non-core channels in the previous
Douban 54% 21% 25%
section, the most popular channels (with highest
consideration for brand ads/programs) are; Himilaya
(podcasting app), QQ (Tencent’s IM that boasts Weishi 62% 15% 23%
750m MAU), Tieba and Douban.
YY 66% 21% 13%
The next set of apps - mostly video and livestream
apps - have been largely overshadowed by bigger Douyu 73% 17% 10%
players in that space such as Douyin, Kuaishou and
Tmall Live.
Huya 77% 14% 8%
Meipai 85% 8% 7%
Inke 89% 7% 4%
No Consideration Low Consideration High Consideration
Source: Totem Media 2021 China Brands Survey n=71INVESTMENTS IN CHANNELS
NICHE APPS FOR BRAND INVESTMENTS
NICHE …BUT NICE FOR SEGMENT TARGETING
KEEP 55% 24% 21%
As brands in China become more attuned to
targeting niche audience groups, they will turn more
TapTap 58% 23% 20%
to smaller apps which hold the potential for both;
Meitu 65% 17% 18%
(1)segment-specific engagement with well defined
user groups - especially where brands can use the Poizon 68% 15% 17%
app to connect with audiences through shared
interests. Jianying 75% 13% 13%
(2)the possibility of catching a new app during its Qingyan 75% 14% 11%
early growth surge, before other brands pile in, and
create too much noise. Idle Fish 75% 14% 11%
Among this group of ‘niche apps’ KEEP (fitness & wellness) has
Oasis 80% 11% 8%
likely attracted the most attention from brands. The rise of
fitness/wellness in China, has attracted a huge number of Soul 83% 7% 10%
brands looking to align to this area of interest (passion).
Bixin 93% 3% 4%
ZaiHang 93% 4% 3%
Deja Vu 96% 3% 1%
No Consideration Low Consideration High Consideration
Source: Totem Media 2021 China Brands Survey n=71DIGITAL CHANNELS IN CHINA APPEAR
SET TO BECOME MORE DISPERSED -
AND LESS CONSOLIDATED BY BATB.
Insight: China’s major digital players, Alibaba and Tencent appear to be facing
similar anti-trust pressures (threats) as the US players (eg. Facebook) are. A
healthy outcome to this (for brands and customers) would be one, where; (1)there
are fewer cross-platform link blockages, (2)more opportunities for smaller apps to
grow, without getting crowded out (or acquired) prematurely, and (3)having more
(rather than fewer) apps to choose from.DIGITAL MEDIA MAP - INVESTMENTS/OWNERSHIP BY “BATB”
The current level of consolidation is significant
Social (Community) Video /Audio Entertainment/News Ecommerce Payments
TIEBA HAOKAN IQIYI QUANMIN BITAUTO NUOMI WOMAI WALLET
BAIDU BAIDU NEWS ZHIHU YY LIVE
XIAOSHIPIN
TMALL TAOBAO JUHUASUAN XIANYU
ALIPAY
WEIBO DINGDING YOUKU XIAMI MUSIC
EL.E ME KOUBEI SUNING HEMA
Shut down Feb 2021
RED BILIBILI
PITU KUAISHOU QQ MUSIC KUGOU KUWO JD PINDUODUO MEITUAN
TENCENT
VIDEO
WEPAY
WECHAT WECHAT FOR WORK QQ
WEISHI TING SHU HIMALAYA QUANMIN QQ NEWS DOUYU HUYA MEIRI YOUXIAN DIANPING
K GE
DOUYIN HUOSHAN XIGUA FANQIE
ZHIDIAN DONGCHEDI DOUYIN PAY
FEILIAO DUOSHAN FEISHU TOUTIAO WUKONG Q&A
JIANYING FACEU QINGYAN Shut down Feb 2021PLATFORM SHARE OF AD REVENUE
BATB CONCENTRATION SLIPPING? ADVERTISING REVENUE SPLIT BETWEEN BATB
Digital advertising spend increased 13.85% in 2020,
100%
moving up to a total of RMB497 Billion.
China’s big four digital holding companies, 30%
33%
ByteDance-Alibaba-Tencent-Baidu, account for 78% 80% 39% 37%
of all digital ad spending. However, that share is
starting to slip …a bit …with “other” platforms Alibaba Group
accounting for a record high of 22% in 2020. 15%
Tencent
60% 14% ByteDance
15% Baidu
Between 2019 and 2020, search was the biggest 15% Others
loser in ad revenue (going from 17% to 13%), while 19%
5% 12% 22%
video was the biggest winner in growth of share 40%
(going from 11% to 15%).
26% 14%
This comes at an interesting time, as the government is 21%
17%
threatening anti-trust actions against Alibaba and Tencent. 20%
While both Alibaba and Tencent make most of their revenue in
other areas (ex-Advertising), clipping back their holdings would 22%
15% 15% 14%
sting. Alibaba needs Weibo, RED and BiliBili as sources of
inbound traffic, to feed its core ecommerce business. 0%
2017 2018 2019 2020
Source: IMZ Lab. 2020 China Internet Advertising Data ReportAS LARGER CHANNELS HAVE
BECOME EXCEEDINGLY CROWDED,
BRANDS ARE LOOKING TO MORE
NICHE, INTEREST-BASED APPS.
Insight: From a channel planning perspective these apps are experimental (not
foundational), so should be treated as opportunities to spark new attention and
activate specific audience segments - rather than as channels where brands
necessarily have ‘always on’ presence.PODCAST / AUDIO STORIES
HIMALAYA / 喜⻢拉雅 - the #1 audio content app in
China, it integrates audiobook, podcast, radio, music,
voice parties, and voice social.
Covid accelerated the growth of audio apps, as they
were seen as a more intimate way to socialize.
Himalaya users have increased by 63% from Jan-
Mar 2020, and total usage time has doubled.
Himalaya has been integrated into 93% of smart
speakers in China. BMW, Audi & Tesla also connects
with Himalaya.
MAU: 111 million
MAU data from: Analysys 易观千帆
Novels Live Streaming KidsPODCASTS, ONLY PODCASTS
A LITTLE UNIVERSE / ⼩宇宙 - A place to listen to
podcasts and talk about them. Unlike Himalaya and
other audio apps, “A Little Universe” is designed
solely for podcasts.
Users can both listen to podcasts and organize
follow up discussions about the casts.
Recently, QQ music added a podcast tab, which
features “Little Universe” content/casts. This link
should accelerate the growth of the app and bring
a larger audience quickly.
MAU: N/A
Discover Comment/Discussion RankingCHINESE VERSION OF CLUBHOUSE
LET’S TALK 对话吧 - Developed by Inke and
launched in February 2021, as a localized version of
Clubhouse.
Unlike the majority of current voice social apps in
China that focus on mass entertainment, Let’s Talk
invites elite leaders from various industries to host
rooms/topics that encourage valuable information
sharing, inspirational discussion, and high quality
conversation. Users need a invitation code to use
the app.
MAU: N/A (Suspended from App Store)
Discover Topics Live Chat Rooms Recommend to FollowINTEREST BASED SOCIAL FOR GENZ
SOUL - Launched in 2016, it encourages users to
connect with strangers based on shared interest
and personality. Users are largely anonymous, they
connect with text, voice and avatars through AI
recommendations, voice parties and UGC sharing.
Users also need to complete a personality survey in
addition to interests survey when setting up the
profile. 36.5% of the users are GenZ according to
iResearch. According to company announcements,
the app has reached 100 million users and 30
million MAU.
MAU: 6.45 million
MAU data from: Analysys 易观千帆
Group Voice Chatting Parties The Latest Moments Soul MatchingINSTAGRAM FOR CHINA? OR ANOTHER RED?
OASIS - Weibo (Sina) launched Oasis (Luzhou) in
2019. They are pitching it as an Instagram-like
product focused on interests/passions, to address
lifestyle and fashion communities. Again, there is lip-
service to the concept of being interest-first, but the
structure of the app appears to be very similar to
LittleRedBook. So, speculation is that they will be
quick to add ecommerce and monetize the site, if
they can get a critical mass of new users.
If Sina can keep a focus on quality content (no ecommerce)
they could be in a good position with audiences. With Red
going all-in as an ecommerce platform, there will be a place for
Oasis. Brands would also welcome a place to do more content
focused marketing.
MAU: 10 million
MAU data from: Analysys 易观千帆
Following Discover by Users, Interest & Tags RecommendedINTEREST-BASED SOCIAL COMMUNITIES JIKE / 即刻 - Join a group, share insider jokes and read news about what you like. - A place for interest groups. - Read what happens of the groups in your feeds. - Share your stuff to the group it fits. - Popular especially among subcultures. MAU:
STOCKX FOR CHINA

POIZON - Started in 2015, Poizon is a vertical social
marketplace. It targets the young consumer group
of post 90 & post 95 - namely men.

It has expanded beyond sneakers and aims to
create a platform that enables people to sell and
purchase authentic trendy goods, receive first hand
information about trends, and share lifestyle, trend
and fashion experiences. Poizon is the third party
that connects buyers & sellers, but provides the
“Authentication” service for buyers. Users can
access it from Dewu App or WeChat Mini-program.

MAU: 4.2 million
MAU data from: Analysys 易观千帆

                                                        Buy - Main page   De Wu Social Page   AR Try-on
SECOND-HAND ECOMMERCE
IDLE FISH / 闲⻥ - Launched in 2014, Alibaba’s Idle
Fish is the largest C2C used goods marketplace and
community in China. Brands can offer sample items,
overstock merchandise, or refurbished products.
Building on the increasing consciousness for
sustainability, Idle Fish’s audience base has growth
quickly. GMV doubled in 2020 and MAUs exceed 90
million. Over 60% of users are millennials and GenZ.
Idle Fish also hosts over 1.3 million interest based
community groups.
MAU: 104 million
MAU data from: Analysys 易观千帆
Electronics Crafts To FollowBEAUTY CAMERAS
BEAUTY CAMERAS - There is a growing number of
players in the space, increasing MAU’s across the
board …and the potential to see these apps morph
into more mainstream social and ecommerce
channels.
Key Players & MAUs:
Meitu: 98.4 million
Beauty Cam: 58 million
Qingyan (Ulike) - 47.8 million
FaceU: 39.3 million
MAU data from: Analysys 易观千帆
Beauty camera Social Sharing Page Templates
Photo retouch, filter, editVIDEO EDITING APP FROM BYTEDANCE
JIANYING / 剪映 - Jianying could be classified
among the ‘beauty cameras’ but is interesting for its
emerging use in editing videos AND for the fact
that it is owned by ByteDance and is closely
integrated with Douyin.
It makes the creation of vlogs and videos for
Douyin more efficient, providing, filters, stickers,
sound effects, and templates.
It grew its user base by 118% in the first half of 2020,
with self-reported MAUs of 61 million.
MAU: 14.8 million
MAU data from: Analysys 易观千帆
Start to create Recommendations Video Editting Tutorials
(create the same style)FITNESS APP
KEEP - KEEP is China’s most notable fitness/
wellness app, offering fitness classes, training notes,
tracking and other wellness related content.
While it had a downturn in 2019, in 2020 (with
Covid), there was a massive increase in fitness,
wellness and in remote fitness classes/instruction,
which has propelled it forward.
KEEP has done a wide array of brand collaborations
and activations.
MAU: 23.6 million
MAU data from: Analysys 易观千帆
Workout Routines Training plans ShoppingESPORTS TRAINING BIXIN / ⽐⼼ - Bixin is an eSports training and tutorial app, designed to help hone the skills of budding eSports players: - Aspiring gamers can train with top players - Participate in youth e-sports competitions - Get access to counseling and therapy During Covid, the number of Chinese eSports players increased by 26 million. Bixin claims to have gained 20 million users in 2020 and had 200 million visits during the 2021 Chinese New Year 7-day break. MAU:
A DISCORD FOR CHINA

TAPTAP - TapTap is like the “Discord” of China - a
social networking community for game enthusiasts.

Its consumer-facing business facilitates a
community for gamers, game developers, and game
KOLs to discuss and share the latest trends, news
and technics in mobile gaming.

It also has a business-facing function providing a
platform for game developers to create and share.

Reached 20million MAU four years after launch.

MAU: 21 million
MAU data from: Analysys 易观千帆

                                                     Following   Popular Game Communities    Videos
EXPERT ADVICE - CONSULTING AS A SERVICE ZAIHANG / 在⾏ - Zaihang is designed as a network to facilitate professional sharing and growth. People seeking advice and professional advice pay experts for their time. Experts on the platform share their insights/advice in wide ranging areas, including; business, health, wellness, career, and creative areas. After selecting the expert, (and making payment) users book appointments. MAU:
BOOK REVIEWS, SWAPPING, SALES

DEJA VU / 多抓⻥ - Deja Vu is a niche social app,
dedicated to books and literature, where users
engage in book discussions, reviews/ratings and in
buying/selling books.

MAU:
TOTEM

 Chris Baker, Managing Director
   Email: chris@totemmedia.co
      www.talktototem.com
ABOUT TOTEM - WHAT WE DO
SELL-OUT ANALYSIS
Financial/Calendar Year Select Year MoM/QoQ
BUSINESS INTELLIGENCE,
Calendar Year 2019 Month
202,761 €8,566,343 €7,704,084 (€90,001)
DATA DRIVEN BRANDING
QUANTITY SOLD RRP (excl. VAT) INVOICED AMOUNT (incl. VAT) RETURNS AMOUNT (incl. VAT)
7,532 1,827 (€1,412,611) | -13.68% €517,755 €7,187,250 (€6,300) (€83,701)
EANs ARTICLES DISCOUNTS VAT INVOICED AMOUNT (excl. VAT) RETURNS VAT AMOUNT RETURNS AMOUNT (excl. VAT)
Select Key Financial Measure Excl / Incl VAT
Quantity Excl. VAT
Quantity by Organization
MACRO
Quantity by Regions 2017
275,077
2018
416,623 51.5%
2019
202,761 -51.3%
Totem works with a range of brands
1.SHG 2,262 01.GRTCHN 2,262
2.TKY
4.REG
5,499
195,000
02.JPN
3.KOR
04.SEA
5,499
37,896
157,104
Quantity trend
Jan Feb Mar Apr May Jun Jul Aug Sep Oct Nov Dec
globally, in APAC and China, on brand
37%
Quantity by Regions
China 2,262
19%
33% 48%
strategy and business intelligence
solutions.
36%
Hong Kong 5,499 -57% 57% 59%
62% -4% 51%
-5% 7% 1% 59% 43%
Indonesia 77,782 33% -7%
Malaysia 48,274
Philippines 23,627
South Korea 37,896
2017
2018
2019
2017
2018
2019
2017
2018
2019
2017
2018
2019
2017
2018
2019
2017
2018
2019
2017
2018
2017
2018
2017
2018
2017
2018
2017
2018
2017
2018
Our clients range across industries,
Thailand 7,421
DISTRIBUTORS
5 7 58 151
DISTRIBUTORS COUNTRIES
Count of Stores
CITIES
Quantity
STORES
including; retail, fashion, beauty, travel,
96
44
Trendz
PT Mitra
79,322 (39.12%)
77,782 (38.36%)
entertainment and finance.
7 YOONI&CO 37,896 (18.69%)
1 BS ASPA 5,499 (2.71%)
3 BS Shanghai 2,262 (1.12%)
Business intelligence and data
visualization projects for our clients
address critical issues including; market
positioning, new product launches, sales
© 2019 Mapbox © OpenStreetMap
Count of Stores by Total Quantity sold Quantity by Store customer_name store_name Sunway Pyramid
Trendz Sunway Pyramid Trendz
Sunway | Malaysia
5k 8
€295,172
RRP (Excl. VAT)
media optimization.
58%
10K
Count of Stores by Total Invoicing (€16,943)
-56%
DISCOUNTS | -6.53%
-10%
-41%
200k 7 RETURNS (Excl. VAT)
PRODUCT
Quantity trend
Jan Feb Mar Apr May Jun Jul Aug Sep Oct Nov Dec
37%
Totem’s Global Database of 1,000+ DTC brands Data/insights on Transformation of Mass Brands
33%
48%
19%
36%
57%
59%
-57%
62%
51%
-4%
43%
59%
-5%
7%
1%
33%
-7%
2017
2018
2019
2017
2018
2019
2017
2018
2019
2017
2018
2019
2017
2018
2019
2017
2018
2019
2017
2018
2017
2018
2017
2018
2017
2018
2017
2018
2017
2018
By Quantity sold By Invoiced Amount (Excl. VAT) By Avg RRP per unit By Avg Discount per unit By Avg % discount
COUNT OF ARTICLES
0 5 0 159 0 156 0 574 0% 572
1-25 1-500 1-50 1-25 1-25%
1 9 5 8 7
26-50 206 , 500-1k 194 0 51-75 3 26-50 209 9 26%-50% 309 1
5
51-100 114 1k-5k 351 76-100 386 2 51-75 91 51%-75% 167
>100 242 >5000 219 >100 223 >75 62 >75% 60
Quantity by Gender Quantity by Season tags Quantity by Season Quantity by Collections
19%
TOTEM
Null Null S19 COR
Adults COE
Unisex
3% W18
n Current Null
Current
Women
n No Season X18 SEA
Men
n Old X19
NSE
Kids Girls SMU
Boys 76% S18 OLDYou can also read