2020 WEALTH WORLD - Capgemini
←
→
Page content transcription
If your browser does not render page correctly, please read the page content below

WORLD
WEALTH
REPORT
2020

Contents
    Preface                                                                                     3

    Executive summary                                                                           4

    Wealth managers must navigate an uncharted, post-pandemic world
    without a playbook                                                                          6

      - Amid hyper-connectivity and economic and market ambiguity, unusual financial
        trends are emerging                                                                     6
      - North America and Europe surpassed Asia-Pacific to lead global performance in
        population and wealth growth                                                            7
      - While the populations of higher wealth bands grew the most in 2019, wealth itself
        was constrained                                                                         9

    Hyper-personalize to meet client expectations and capture future
    growth segments                                                                             11

      - 2020 volatility may drive asset adjustments as well as higher client expectations
        regarding value justification for advisory fees                                       11
      - As firms look to bolster revenues amid uncertainty, sustainable investing and
        value-added services are the way forward                                                13
      - Hyper-personalized offerings can address varied HNWI expectations and lock
        in firms’ future growth during uncertainty                                    16

    Safeguard profits with a focus on critical touchpoints and operating
    model optimization                                                                          18

      - Wealth management Achilles’ heel: A lack of personalized information and services
        along the client journey                                                                20
      - Technology can enhance client engagement and distribution channels to boost
        growth, revenue opportunities                                                           25
      - A smooth transition to Open X is essential as firms prioritize acquisition, advisory,
        and value-added services                                                                28

    Turning challenges to opportunities                                                         32

    Partner with Capgemini                                                                      33

    Methodology                                                                                 34

    Ask the experts                                                                             36

    Key contacts                                                                                37

    About us                                                                                    39

2
World Wealth Report 2020

Preface
At the turn of the new decade, it appeared that the record-long bull market – albeit caffeinated in 2019 by
unprecedented government stimuli – would continue roaring into the ’20s. Developed markets were leading global
wealth growth for the first time since 2012, with North America up by double digits. The ultra-high-net-worth wealth
segment was adding to its global ranks. And despite an undercurrent of trade and geopolitical tensions, global wealth
was climbing.
It was within this environment that we conducted the Global High-Net-Worth Insights Survey between January and
February 2020. We sought to understand the mindsets of the world’s wealthiest individuals in relation to their trust
and confidence in their wealth firms, their satisfaction with investment advice and returns delivered, their comfort
level with fees, and their take on personalized services. The survey revealed that HNWIs are increasingly willing to
engage with digitally capable BigTechs and suggested that firms could mitigate disruptor encroachment by focusing
on the most vulnerable client journey touchpoints.1 Our research also revealed that real-time access to information
and complex global interdependencies seemed ready to spark an evolution of novel individual investment patterns
and market growth trends.
Few predicted the unlikely black swan that would usher in the biggest health crisis and its severe social and economic
impact. Instead of new investment opportunities, it was the novel coronavirus that descended with such ferocity that
markets plummeted to their lowest since 1987. The pandemic was unexpected by most, unplanned for, and largely
unprecedented. While there is no historical guidance for what may happen next, the virus and its impact on the
global economy have materially changed the investment outlook for 2020. However, as virologists seek to flatten the
curve, wealth managers can raise the bar and safeguard profits by staying in tune with the evolving priorities of many
HNWIs – particularly as sustainability investments that uphold environmental and social priorities gain prominence in a
post-pandemic environment.
In the face of today’s extraordinary uncertainty, forecasts, models, and assumptions may merit review and potential
adjustments. Wealth firms that revisit their cost structure and distribution channels can build more resilient and agile
business and operating models. This unpredictable period may also present opportunities to reach underserved or
new investors, as demand for advice tends to increase during periods of market turbulence and the strategic case for
sustainable investment advances. Now, as wealth management firms are hard-pressed to get the most bang from
pressurized budgets, it will be wise to determine which critical capabilities (such as hyper-personalization and value-
added services) have the most potential to boost client experience and firm profits. Based on each wealth firm’s
core competencies and business goals, the shared ecosystem of the impending Open X2 era offers a direct line to
competitive advantages and profits by offering a mix of adaptable approaches such as build, buy, and partner with
trusted third parties.
Your firm’s response to the events of 2020 and the ability to effectively engage with clients whose priorities may be
shifting can define the future of your business. We hope the insights and real-world examples in our report spark your
innovative decision making throughout the months ahead. We are here to help.

Anirban Bose
Financial Services Strategic Business Unit CEO &
Group Executive Board Member, Capgemini

1
    High-Net-Worth Individuals (HNWIs) are defined as those having investable assets of USD1 million or more, excluding
    primary residence, collectibles, consumables, and consumer durables.
2
    Open X represents an enhanced approach to open banking characterized by a seamless eXchange of data and resources to
    eXpedite product innovation for excellent customer eXperience.

                                                                                                                           3
Executive summary
A post-pandemic world influenced by as-it-happens news sharing and
complex global interdependencies has tossed wealth management
firms into uncharted waters
• Dull by today’s standards, 2019’s idling economy spawned 8.8% growth in the high-net-worth individual (HNWI)
  population, while global wealth grew by 8.6% amid good stock market performance.3

• Developed markets led 2019 global wealth growth (the first time since 2012), with North America leading at
  11% growth and surpassing the traditional leader, Asia-Pacific.

• The ultra-HNWI segment increased most in terms of population, by 9.1%, but its wealth growth (8.2%) was
  less hearty.

• As for what lies ahead, ever-increasing access to real-time information, coupled with today’s uncertainty
  and complex global interdependencies, may spark an evolution of novel individual investment patterns and
  unexpected market trends.

Within the uncertain COVID-19 environment, hyper-personalized
offerings and socially responsible investment options will be
essential to meeting client expectations, retaining current business,
and capturing growth opportunities
• 2020 unpredictability has suppressed HNWI risk appetite, as expectancies around value for advisory fees
  creep upward.
     ––The harsh COVID-19 investment environment will likely increase client expectations on value delivered for
       fees charged.

• Firms that expand product offerings with sustainable investment options and value-added services can open
  new doors to revenue.
   ––Environmental, Social, and Governance (ESG) investments are likely to take on even more significance for
     HNWIs and wealth management firms in a world increasingly impacted by environmental and social risks.

• Proactive care to clients’ unique needs during transition points in their life and financial journey can also help
  wealth management firms tap future growth segments.

• Aided by technologies such as artificial intelligence (AI) and analytics, firms can hyper-personalize the customer
  experience (CX) to uniquely meet the individual needs of existing as well as prospective clients.

3
    For the purposes of our analysis, we separate HNWIs into three discrete wealth bands:
    Millionaires next door: those with USD1 million to USD5 million in investable wealth
    Mid-tier millionaires: those with USD5 million to USD30 million
    Ultra-HNWIs: those with USD30 million or more.

4
World Wealth Report 2020

Wealth management firms can safeguard profits in uncertain times,
with a focus on critical touchpoints and operating model optimization
• In the face of today’s unprecedented uncertainty, wealth firms that revisit their cost and clients’ fees structure
  and distribution channels can build more resilient and agile business and operating models.

• Firms can maximize the impact of their investments through a laser focus on capability building to identify the
  critical 20% of the value chain that impacts 80% of CX and profitability (80/20 principle).

• A lack of personalized information/services delivery is proving to be the Achilles’ heel for wealth management
  firms, but a focus on the stages of acquisition, advisory, and value-added services can help safeguard a client
  base that is increasingly willing to engage with BigTechs.

• Across the firm’s value chain too, the stages of acquisition, advisory, and value-added services emerge as the
  critical 20% for future growth as emerging technologies enhance internal capabilities in these areas.

• Embracing the Open X mindset, where FS and non-FS players collaborate effectively in an open environment,
  can enable firms to prioritize capability-building in critical focus areas while leveraging ecosystem collaboration
  to quickly and cost-effectively fill capability gaps in other areas.

                                                                                                                       5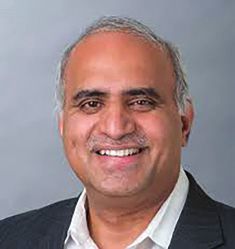
Wealth managers must navigate an
uncharted, post-pandemic world
without a playbook
Amid hyper-connectivity                                                                           prepared for the impact of macroeconomic trends that
                                                                                                  never fully materialized. It was a wait-and-watch year
and economic and market                                                                           that featured a global economic slowdown, disruptive
ambiguity, unusual financial                                                                      international trade wars, and political tectonics such
trends are emerging                                                                               as Brexit, Hong Kong social unrest, and Latin American
                                                                                                  power plays.
The biggest health crisis of the past century, COVID-
                                                                                                  Nevertheless, around the world, the high-net-worth-
19, has severely impacted billions of lives, both socially
                                                                                                  individual (HNWI) population and financial wealth each
and financially. With a projected 3% decline in the
                                                                                                  grew by nearly 9% in 2019.
global economy, 2020’s financial challenges may not
be over.4 However, our trends study of 2019 market                                                Rising trade tensions and geopolitical unrest took a
growth indicates that despite a dwindling economy,                                                toll on business confidence, investment decisions, and
financial markets could prove resilient and boost the                                             global trade. However, a notable shift to monetary
global outlook.5                                                                                  policy accommodation across regions – and tech
                                                                                                  sector performance optimism – calmed tensions
Like a tea kettle that refused to whistle, pent up
                                                                                                  around financial market sentiment and activity.
anxiety characterized pre-pandemic 2019 as markets

Figure 1. Number of HNWIs by region (millions), 2012–2019

                                                    CAGR 2012–2018: 7.1%             Annual growth 2018–2019: 8.8%
                                                                                                                                        % Change
                                                                                                                          19.6          2018–2019
                                 20                                                                 18.1       18.0            0.2
                                                                                                         0.2        0.2   0.6
                                                                                     16.5                                  0.8       Africa          6.1%
                                                                          15.4              0.2      0.6        0.6
                                                               14.7                                  0.7        0.7
                                                    13.7                      0.2     0.6                                            Latin America   2.7%
                                 15                                 0.2               0.6                                 5.2
    HNWI population (millions)

                                                        0.1               0.5
                                        12.0                    0.5       0.6                       4.8         4.8
                                                    0.5        0.6                                                                   Middle East     9.3%
                                              0.1   0.6                              4.5
                                                                           4.2                                                       Europe          8.7%
                                        0.5                    4.0
                                        0.5         3.8
                                 10                                                                                       6.3        North America 10.9%
                                        3.4                                                         5.7         5.7
                                                                                     5.2
                                                                           4.8                                                       Asia-Pacific     7.6%
                                                               4.7
                                                    4.3
                                        3.7
                                 5

                                                                                                    6.2         6.1       6.5
                                                               4.7         5.1       5.5
                                        3.7         4.3

                                 0
                                       2012         2013      2014        2015       2016           2017       2018       2019

Note:                                 Chart numbers and quoted percentages may not add up due to rounding.
Source:                               Capgemini Financial Services Analysis, 2020.

4
               Congressional Research Service, “Global Economic Effects of COVID-19,” May 1, 2020; https://fas.org/sgp/crs/row/R46270.pdf.
5
               World Federation of Exchanges, “First Quarter 2020 & Full Year 2019 Market Highlights,” May 7, 2020;
               https://www.world-exchanges.org/news/articles/world-federation-exchanges-releases-first-quarter-2020-full-year-2019-
               market-highlights.

6
World Wealth Report 2020
Figure 2. HNWI financial wealth by region (USD trillions), 2012–2019
CAGR 2012–2018: 6.7% Annual growth 2018–2019: 8.6%
74.0 % Change
2018–2019
70.2 68.1 1.7
75
63.5 1.7
1.6 2.9
58.7
56.4 1.5 2.5 Africa 6.5%
2.6 8.8
HNWI financial wealth (USD trillions)
52.6 1.4 2.4 8.7
1.4 8.4 Middle East 10.2%
46.2 1.3 2.3 8.0
2.3 16.7 Latin America 4.4%
50 2.1 7.4
1.3 7.7 15.9 15.4
1.8 7.7 14.7 Europe 8.8%
7.5 13.6
13.0 North America 11.0%
12.4
19.8 21.7
10.9 19.6 Asia-Pacific 7.9%
18.0
25 16.6
16.2
14.9
12.7
18.8 21.6 20.6 22.2
14.2 15.8 17.4
12.0
0
2012 2013 2014 2015 2016 2017 2018 2019
Note: Chart numbers and quoted percentages may not add up due to rounding.
Source: Capgemini Financial Services Analysis, 2020.
In Q1 2020, the impact of COVID-19 wiped out over robust Q4 2019 gains as trade uncertainty faded in
USD18 trillion from markets globally over the course of December when the United States and China rolled
February and March 2020, before recovering slightly out their Phase One trade deal. The markets benefited
in April.6 Based on our analysis of various market from measures taken by the US Federal Reserve to
and economic parameters, a quick estimate shows a pump billions of dollars into the financial system after
decline of 6–8% in the global wealth till the end of tumult in mid-September. They also were aided by
April 2020 (vs the end of 2019). optimism surrounding technology companies. The top
five contributors in the market surge were tech stocks
North America and Europe – Apple and Microsoft accounted for nearly 15% of
S&P gains.7
surpassed Asia-Pacific to
In Canada, both HNWI population and wealth posted
lead global performance in increases of more than 8% in 2019. Diminishing
population and wealth growth US-Canada trade tension had a significant impact on
Canada’s equities market as well, with the S&P/TSX
For the first time since 2012, the Asia-Pacific region
Composite rising more than 19% following a nearly
did not lead global HNWI wealth growth (or decline
12% decline in 2018.8
in 2018). North America was the driving force in
2019, with an 11% increase in both HNWI population Growth performance in Europe topped that of key
and wealth. It accounted for 39% of global HNWI emerging regions – Asia-Pacific and Latin America –
population gains and 37% of HNWI wealth growth in 2019, with HNWI population and wealth growth
(USD2.2 trillion). at around 9%. European central banks supported
Eurozone stock markets by stepping back from tighter
In the United States, the HNWI population shot up 11%
monetary policy. Economically sensitive sectors
in 2019 compared with 1% in 2018. US equities made
6
World Federation of Exchanges, “First Quarter 2020 & Full Year 2019 Market Highlights,” May 7, 2020; https://www.world-
exchanges.org/news/articles/world-federation-exchanges-releases-first-quarter-2020-full-year-2019-market-highlights.
7
CNBC, “The stock market boomed in 2019. Here’s how it happened,” December 31, 2019;
https://www.cnbc.com/2019/12/31/the-stock-market-boomed-in-2019-heres-how-it-happened.html.
8
GLC Asset Management, “GLC 2019 Market Year in Review,” January 6, 2020; https://www.glc-amgroup.com/news-insights/
market-reviews/2019-market-year-in-review.html.
7such as manufacturing and information technology of international investors to China’s A-shares market
performed well, but safe-haven consumer staples and – one of the world’s largest – with a total value of
real estate sectors were also top performers. USD7,903 billion.9
Amid the uncertainty surrounding Brexit throughout Hong Kong stocks capped off a gloomy 2019 with a
2019, both HNWI population and wealth in the United December rally supported by a government resolution
Kingdom grew more than 6%. to manage the US-China trade deal. Also, its residential
property price index rose by more than 5% during
Despite robust market performance from a few of
2019.10
its countries in 2019, APAC overall fell behind the
average (9%) global HNWI growth rate by expanding Other major Asian markets – India, South Korea, and
just 8%. Singapore – recorded weak progress in 2019, which
led to sub-par growth in HNWI population and wealth
Key Asian countries – Hong Kong, China, and Taiwan –
for the entire region. Anemic performance in these
experienced double-digit HNWI population and wealth
markets was the result of economic slowdown and
growth. On the heels of more significant government
weakening local currencies.
support for the domestic economy, China’s CSI 300
stock index climbed upward. The United States, Japan, Germany, China, and France
continued as the top five countries by total HNWI
Before the novel coronavirus began to affect China in
population in 2019, with their contribution increasing
late 2019, the country reaffirmed its commitment to
significantly over 2018. The top four countries
expanding its markets and to improving the domestic
accounted for nearly 62% of the HNWI population in
business environment in the People’s Republic for
2019, and they were responsible for more than 67% of
foreign companies; as a result of a trade war truce
global HNWI population growth.
with the United States. The move shifted the attention
Figure 3. HNWI population by country, 2018–2019
(thousands) 2019 2018
5,909
7,000
61.6% of global HNWI population
5,322
6,000 (61.1% in 2018 and 58.4% in 2012)
HNWI population
5,000
3,387
3,151
4,000
3,000
1,466
1,350
1,317
1,189
2,000
702
591
635
556
438
392
Canada 362
Switzerland 384
1,000
South Korea 235
Spain 224
Russian Federation 200
Kuwait 188
Saudi Arabia 191
Brazil 186
174
Taiwan 162
Hong Kong 153
145
Sweden 129
Thailand 127
Indonesia 129
243
215
203
199
Norway 182
178
Austria 155
142
134
134
Australia 266
India 256
284
263
235
207
172
298
Italy 275
287
Netherlands 259
0
United Kingdom
United States
Japan
Germany
China
France
Annual
growth (%) 11% 8% 9% 11% 11% 6% 14% 8% 8% 11% 7% 3% 3% 5% 8% 10% 6% 7% 4% 10% 12% 7% 10% 6% 3%
2018–2019
Ranking
change – – – – – – – – – +1 –1 – – – – +1 –1 – – – – – +2 +2 –2
2018–2019
Source: Capgemini Financial Services Analysis, 2020.
9
Schroders, “Eight charts that explain the growing importance of China A-shares,” September 24, 2019;
https://www.schroders.com/en/ch/wealth-management/insights/markte/eight-charts-that-explain-the-growing-importance-
of-china-a-shares.
10
Global Property Guide, “Hong Kong’s property market remains resilient, but uncertainty persists,” February 18, 2020;
https://www.globalpropertyguide.com/Asia/Hong-Kong/Price-History.
8World Wealth Report 2020
Within the top-25 HNWI-population markets, a producer Saudi Aramco raising USD25.6 billion in a
noteworthy shift was Sweden’s gain of more than 10% much-anticipated IPO that propelled the Saudi stock
in HNWI population growth to move up two places exchange into the top bourses globally.11
(to rank 23). The Netherlands moved up, too, to join
Compared with 2018, both HNWI wealth and
the top-10 list as a result of robust real estate sector
population growth were more evenly distributed
growth and an increase in market capitalization.
across all wealth bands in 2019. The ultra-HNWI
segment was responsible for 32% of the global
While the populations of higher increase in HNWI wealth (USD5.9 trillion), whereas, in
wealth bands grew the most in 2018, it accounted for 75% of global wealth decline.
With restricted ultra-HNWI wealth growth – and with
2019, wealth itself was constrained all wealth bands almost equally driving growth – is
Population and wealth grew at an even pace in 2019 access to information and the speed of communication
for millionaire-next-door and mid-tier millionaire leveling the playing field for wealth growth?
wealth bands. In contrast, ultra-HNWI wealth growth In today’s volatile times, complex global
was below average compared with population growth interdependencies – combined with increasing access
– an unusual trend. to and speed of information – may drive unusual
In 2019, ultra-HNWI population and wealth grew 9% market growth trends
and 8% over 2018, respectively. Higher wealth bands Investment based on market emotions: Despite
often make investments beyond equity markets – economic stagnation in many markets, there was a
such as private equity – that can be unstable during surge in equity market investment in 2019 around the
uncertain times. A possibly more cautious approach by world, with improved market sentiments driven by
ultra HNWIs and a bias toward owning local stocks may favorable government measures in various countries.
also have restricted their wealth growth.
Unprecedented global market scenarios: The size
However, the Middle East region recorded higher of the stock market relative to the size of the economy
ultra-HNWI population and wealth growth than the was at an all-time high in 2019. Overvalued markets
global average in 2019. The energy industry led an and overvalued tech stocks in the United States
equity market surge in Q4 2019 with state-owned oil
Figure 4. Global number of individuals per wealth band (2019) and growth (2018–2019)
Number of HNWI population HNWI wealth
individuals % of HNWI
2019 CAGR Growth CAGR Growth wealth
(thousands) 2012−2018 2018−2019a 2012−2018 2018−2019a 2019
Ultra-HNWI 183.4 9.1% 8.2%
7.2% 5.9% 33.6%
USD30m+ (0.9% of total) (+12.9PP) (+14.5PP)
Mid-Tier Millionaires 1,757.6 8.9% 8.8%
7.1% 7.1% 22.6%
USD5m–USD30m (9.0% of total) (+11.2PP) (+11.4PP)
17,666.6 8.8% 8.8%
Millionaires Next Door 7% (+8.9PP) 7.1% (+9.2PP) 43.8%
(90.1% of total)
USD1m–USD5m
a. PP in parentheses denotes the change in growth percentage in 2018–2019 over 2017–2018.
Source: Capgemini Financial Services Analysis, 2020.
11
Zawya, “Four IPOs raise $26bln in GCC in Q4 2019,” February 18, 2020;
https://www.zawya.com/mena/en/markets/story/Four_IPOs_raise_26bln_in_GCC_in_Q4_2019-SNG_167591980/.
9and elsewhere helped to drive up HNWI wealth.12 The future is uncharted for markets and investors
Throughout the year, both equities and bonds across the globe as individual investment patterns
performed equally well, breaking the usual negative evolve in the wake of increasing information
correlation between these asset classes.13 transparency, speed of worldwide communications,
and complex geopolitical interdependencies.
Dramatic movements in financial markets colored
the first four months of 2020 as new coronavirus Undoubtedly, 2020 will also be a year of unusual
pandemic implications unfolded every day. Amid market growth trends.
negative global GDP growth projections, markets
crumbled in March 2020. The S&P 500 rode a
precarious seesaw, and in only 22 trading days fell
30% from a record high on February 19, 2020.14 But
despite the anticipated recession and decline in GDP,
and record unemployment numbers, equity markets
gained during much of April 2020. An additional
USD2.3 trillion stimuli from the US Federal Reserve
jolted the S&P 500 index, which advanced 25% from
March lows.15
12
CCN, “Overvalued Stock Market Has a Major Pop Risk – And It Just Lit Up,” January 16, 2020;
https://www.ccn.com/overvalued-stock-market-has-a-major-pop-risk-and-it-just-lit-up/.
13
CNBC, “In a rare occurrence, both stocks and bonds are having a great year,” June 26, 2019;
https://www.cnbc.com/2019/06/26/in-a-rare-occurrence-both-stock-and-bonds-are-having-a-great-year.html.
14
CNBC, “This was the fastest 30% sell-off ever, exceeding the pace of declines during the Great Depression,” March 23, 2020;
https://www.cnbc.com/2020/03/23/this-was-the-fastest-30percent-stock-market-decline-ever.html.
15
Financial Times, “Federal Reserve action boosts equity and credit markets,” April 9, 2020;
https://www.ft.com/content/b8c1b7f4-1380-4ce3-8c52-a040c3d3d878.
10World Wealth Report 2020
Hyper-personalize to meet client
expectations and capture future
growth segments
2020 volatility may drive grew 11%, and in Q1 2018, equities were the top asset
class. Nevertheless, when wealth dipped 3% in 2018,
asset adjustments as well as clients immediately moved to cash/cash equivalents,
higher client expectations making it the largest asset class in Q1 2019.
regarding value justification Stock markets were bullish in 2019 amid global
for advisory fees economy inertia, and equity regained the top spot.
Equities replaced cash and cash equivalents to become
Considering market volatility over the last 24 months, the most significant asset class in Jan–Feb 2020 to
we believed an analysis of asset allocation trends account for 30% of the global HNWI financial portfolio
spanning the previous three years was merited. The – up nearly four percentage points (pp) from Q1 2019
results revealed a link between robust global wealth – while cash/cash equivalents slipped to the second
and equity asset class dominance. However, after a position at 26%, down three pp from Q1 2019.16
year of wealth decline, investors shifted to safer assets
such as cash and fixed income. In 2017, HNWI wealth
2017 2018 2019
Total wealth (USD trillion) 70.2 68.1 74.0
Wealth growth (%) 10.6% (3.0%) 8.6%
Figure 5. Asset allocation, Q1 2018, Q1 2019, Jan–Feb 2020 (global)
100%
9.4% 13.0% 12.9%
16.8% 14.6%
15.8%
75% Alternative Investmentsa
15.8%
Percentage of assets (%)
17.6% 17.1% Real Estateb
50% Fixed Income
27.2% 25.2%
27.9% Cash & Cash Equivalents
With 2020
likely being Equity
25%
a volatile
year, what will
30.9% 25.7% 30.1% asset allocation
look like in
Q1 2021?
0%
Q1 2018 Q1 2019 Jan–Feb 2020 Q1 2021
a. Includes structured products, hedge funds, derivatives, foreign currency, commodities, private equity.
b. Excludes primary residence.
Note: The chart reflects HNWIs’ asset allocation at the time we conducted the survey (between January and February 2020).
Question asked: “What percentage does each of these asset classes approximately represent in your CURRENT financial
portfolio?” Chart numbers may not add up to 100% due to rounding.
Source: Capgemini Financial Services Analysis, 2020; Capgemini Global HNW Insights Survey 2020.
16
The 2020 Global High Net Worth Insights Survey was conducted during January–February 2020, and therefore HNWI
responses may not reflect significant COVID-19 outbreak impact.
11Within a portfolio that before now had typically been delineate their concerns about fees in 2019, HNWIs
dominated by cash/cash equivalents, Japan exhibited cited transparency (47%), performance (41%), and
the most exciting trend as equities became the most value received versus fees charged (39%).
favored asset class for the first time since we started
And in terms of fee structure, HNWIs preferred
tracking it in 2010. Japanese HNWIs allocated 31%
performance- and service-based fees instead of an
of their portfolio to equities (eight pp more than the
asset-based fee structure. This preference, when
previous year), the highest among all asset classes.
compared to the fee structures HNWIs actually receive
North America recorded the highest equity allocation today, reflects a further disconnect between what
at 39%, significantly higher than in other regions. HNWIs expect and what they receive from their WM
As discussed earlier, robust equity markets and firms. More than a third (35%) of HNWIs said they
the financial stimulus helped to restore trust in would prefer a fee structure based on investment
equity assets. performance compared with a quarter (26%) of HNWIs
whose fees are structured around performance
As 2020 unfolds, and the unprecedented impact
already. This expectation will be fueled further during
of COVID-19 continues to be tallied, it remains to
a potential decline period (the year 2020), as COVID-
be seen whether or not more asset-class allocation
19 implications are revealed. Only 13% of HNWIs said
adjustments are on the 2021 horizon. We will continue
they desired an asset-based fee structure while a
to monitor this trend.
much higher percentage (24%) is currently bound to
Fees also are under enormous pressure as gaps asset-based fees.
between HNWI expectations and reality widen amid
The gap between existing and desired states for
economic volatility
performance-based fee structures was highest among
Around a third (33%) of HNWIs said they were HNWIs aged 60 or above (22 pp) and millionaires next
uncomfortable with the fees their firms charged in door (16 pp).
2019, as concerns and high expectations grew. This
These critical expectation gaps merit consideration
number is expected to increase further in 2020 due
because HNWIs say they may switch firms as they are
to volatile markets in the current pandemic scenario,
dissatisfied with fees perceived to be too high. In the
and HNW clients continue to scrutinize fees. Comfort
next 12 months, 22% of HNW individuals say they plan
levels varied among age groups, with 24% of those
to change their primary wealth management firm,
under-40 uncomfortable with fees charged compared
with high fees being the top reason (for 42% of HNWIs
with 50% of HNWIs aged 60 or older. When asked to
who wish to switch firms). Interestingly, Latin America
Figure 6. HNWIs want a performance/service-based fee structure vs. asset-based fee structure,
Jan–Feb 2020 (global)
Fee structure Existing Desired
Based on investment
performance
35%
26%
Based on overall service
quality (not just investment
performance)
11% 15%
% As a percentage of assets
24%
13%
Questions asked: “How do you currently pay your wealth manager for wealth-related services?” and “In an ideal world, how would
you like to pay your wealth manager for wealth-related services?”
Source: Capgemini Financial Services Analysis, 2020; Capgemini Global HNW Insights Survey 2020.
12World Wealth Report 2020
and North America had the highest percentage of
HNWIs, 55%, and 47%, respectively, citing high fees as Education is key. Working with
their primary reason for switching firms. individuals educationally provides
Over the past few years, clients have been demanding a sustainable framework for long-
more value delivered against the fees paid to term financial planning moving
firms, and in the increasingly volatile and uncertain forward. This would be a key
environment that lies ahead, the voice for this demand component of what responsible
will become louder. sustainable investing should be for
the long term."
As firms look to bolster revenues — Joel Carpenter
amid uncertainty, sustainable Director – Marketing, Asia, St. James‘s
investing and value-added Place Wealth Management, Singapore
services are the way forward
The growing interest in sustainable investing Value-added services can also positively influence
offers firms a high-potential product opportunity.17 client experience. Our survey revealed that 43%
With environmental risks becoming more and of HNWIs globally believe additional services can
more prominent, it is not surprising that customers positively impact their experience with the firm.
recognize the importance of sustainability, a A more granular look into the trends across the
concept that is increasingly impacting the wealth extremes of age and wealth bands indicated that
management industry. HNWIs younger than 40 and the ultra-HNWI segment
Funds focused on socially responsible investing have were driving interest in value-added services.
been a rare bright spot in 2020 market activity – In fact, within both wealth bands, younger HNWIs also
which offers a signal for sustainable investors and showed a significantly higher willingness to pay for
could serve as a proof point for how HNWIs can trust value-added services.
environmental, social, and governance (ESG) funds in
turbulent markets. The cross-section of ultra-HNWIs younger than 40
was the most bullish, with almost half interested
In the first four months of 2020, investors poured in value-added services, and 80% of interested
more than USD12 billion into funds that invest in ESG
individuals also willing to pay for such services. High
practices, according to investment research platform
interest and willingness to pay makes it lucrative for
Morningstar Direct – doubling the YoY amount that
ESG funds attracted.18 firms to experiment with value-added services for this
sub-segment.
We explore the sustainable investing trend further on
page 15. A deeper dive into these segments revealed that the
most sought value-added services among this cross-
section of ultra HNWIs younger than 40 were:
Increased demand for sustainable 1. Real estate investment advice
investing options is being driven 2. Tax planning
3. Legal consultation
by wealth transmission. Younger
4. Inheritance advice
clients are very interested in 5. Services catering to investments of passion (e.g.,
sustainable investing." art, wine, collectibles, luxury cars, yachts, etc.).
— Geoffroy Vermeire An excellent example of taking client experience to
Member of the Management Board, Van the next level with the help of value-added services
Lanschot Kempen Wealth Management, is HSBC Jade, a unique service for those with complex
Belgium needs and investible assets greater than USD1 million.
17
Sustainable investing is an investment strategy of incorporating environmental, social, and governance (ESG) factors into the
investment portfolio. HNWIs who invest sustainably prefer to invest in companies, corporations, and funds to generate
financial returns along with measurable social and environmental impact.
18
The Wall StreetJournal, “ESG Investing Shines in Market Turmoil, With Help From Big Tech,” May 12, 2020;
https://www.wsj.com/articles/esg-investing-shines-in-market-turmoil-with-help-from-big-tech-11589275801.
13Figure 7. Ultra-HNWIs under 40 are very interested and willing to pay for value-added services, Jan–Feb 2020 (global)
Millionaires Next Door Ultra-HNWIs
(World Wealth Report 2020
HNWIs want sustainable investing (SI) options
Younger ultra-HNWIs are SI enthusiasts
27% of overall HNWIs express HNWIs in Asia-Pacific (excl. Japan) and
27% interest in SI products Latin America are most drawn to SI products
17% 40% 41% 16%
Millionaires vs Ultra- of HNWIs vs of HNWIs
Next Door HNWIsHNWIs, many of whom are being targeted by • Personalized portfolio construction and tailored
new digital players. Incumbent firms may find it advice: Using data analytics and machine learning to
challenging to capture this segment once they start assess the investor’s trading history and risk profile,
their HNWI journey as digital natives. firms can create customized portfolios so clients can
Interestingly, only a third of the executive survey achieve their specific financial goals.
respondents said their firm offers tailored solutions They can also leverage technology to analyze
for this segment. However, 55% of respondents client behavior and provide advice tailored to their
also said that although they are not catering to the individual context. Charles Schwab’s Project Bear
mass-affluent segment now, they plan to soon. program uses AI to scan its client base to find
With HNWI segments displaying unique preferences investors who may potentially react to market
and financial goals, especially at key transition points, volatility and stop them from possibly making poor
addressing these needs will be critical, especially investment decisions.20
during today’s uncertain environment exacerbated
• Customized client reporting: Instead of using
by the public health crisis. Technology-driven hyper-
different dashboards to track a single client’s
personalization is an approach firms can employ to
portfolio of investments, organizations are creating
fulfill these urgent requirements.
a comprehensive view of the client’s investments
with the help of APIs and delivering insights using
multiple data sources to serve clients in a more
Acing the client experience is also personalized manner.
about delivering great investment As an example, Addepar, a wealth management
management capabilities through platform, with the use of data analytics, provides
a broader lens by addressing a personalized portfolio aggregation and reporting for
wider array of needs and services registered investment providers to serve their clients.21
that clients require." One size does not fit all. In an increasingly volatile
— Kerry Ryan environment that is rewriting the rules of interaction
Director, Global Go to Market Lead, and success, hyper-personalization can enhance the
Wealth & Asset Management, client experience through data-driven advice and
Salesforce, US reporting.
Successful client engagements
Hyper-personalized offerings are now defined by knowing
can address varied HNWI everything about your client —
expectations and lock in firms’ from their family to their business
future growth during uncertainty — a full 360-degree view that can
be used to guide and coach as part
Technologies such as artificial intelligence (AI) and of service offerings."
analytics can help firms enhance CX by providing
personalized solutions and services in diverse areas: — Andy Wang
Global Head of Wealth & Asset
• Bespoke risk profiles: Organizations can leverage Management, Salesforce, US
advancements in behavioral sciences and sentiment
analysis to interpret clients’ risk profiles at a more
granular level rather than being limited to five or six
predefined profiles for the entire client base.
20
Fortune, “Schwab’s ‘Project Bear’ Uses A.I. to Predict When Investors Are Getting Nervous – And Warn Them Against Making
Bad Decisions,” Chris Taylor, July 10, 2019; https://fortune.com/2019/07/09/schwab-uses-a-i-to-predict-nervous-investors/.
21
Addepar, https://www.addepar.com/, accessed April 2020.
16World Wealth Report 2020
UOB Private Bank prepares the next generation of Asia’s business heirs
for success
Singapore-based United Overseas Bank (UOB) offers a wide range of financial services, including consumer
banking, wealth management, private banking, and commercial and corporate banking. Founded in 1935, UOB
is a leading bank in Asia with a global network of more than 500 branches and offices spanning 19 countries and
territories across Asia-Pacific, Europe, and North America.
Business objective: The great wealth transfer from Baby Boomers to their children is underway, with nearly USD9
trillion expected to change hands over the next two decades. In Asia alone, high-net-worth individuals (HNWIs)
with assets of USD5 million or more will pass on as much as USD2 trillion to their next-generation heirs.22 However,
wealth transfers present challenges and opportunities for wealth management firms. For instance, millennial
clients may have very different advisory and service expections from their parents. This is borne out in research
that shows close to 30% of the children of HNWIs leave their parents’ wealth manager.23
UOB Private Bank is bucking this trend. Given the increase in intergenerational wealth transfer in the region, the
Bank recognized the need to engage its clients and their children to prepare the next generation for success as
they take on future responsibilities and leadership roles in family businesses.
Strategic implementation: UOB Private Bank created the Next-Generation Programme to bring together
younger HNWIs to network and to exchange ideas with their peers, and to learn from leading technology
companies around the world on how to tap digital trends to prepare their family businesses for the future. The
initiative offers an environment for participants to nurture their ideas as they prepare to take over the reins of
their family businesses in time to come.
The three-part program includes leadership and technology modules, as well as an internship. The leadership
module equips participants with management and financial skills such as how to make sound investment and
business decisions. The technology module introduces participants to emerging technologies likely to impact
their businesses and prepares them to better navigate technology disruption. Finally, participants complete an
internship at a FinTech startup or technology firm through the Bank’s ecosystem partners such as The FinLab, an
innovation accelerator, or equity-crowdfunding platform OurCrowd.
Benefits/results: The UOB Private Bank Next-Generation Programme prepares the participants for success as
future leaders of their family businesses. This initiative provides them a platform to foster friendships and to tap
the insights and thinking of captains from various industries. The practical training and networking opportunities
offered by the Next-Generation Progamme was instrumental to UOB Private Bank being named Best Private Bank
for Millennials by The Banker in 2019. UOB is the first Asian bank to win the award.
Sources: Capgemini Financial Services Analysis, 2020; World Wealth Report 2020 Executive Interviews.
22
Markets Insider, “More Than $15 Trillion in Global Wealth to be Transferred by 2030,” June 26, 2019;
https://markets.businessinsider.com/news/stocks/more-than-15-trillion-in-global-wealth-to-be-transferred-
by-2030-1028310838.
23
GlobeNewswire, “Intergenerational Wealth Transfer: Seizing the HNW Opportunity,” October 22, 2019;
https://www.globenewswire.com/news-release/2019/10/22/1933386/0/en/Intergenerational-Wealth-Transfer-Seizing-the-
HNW-Opportunity.html.
17Strategy for uncertain times
Safeguard profits with a focus on
critical touchpoints and operating
model optimization
In the eye of a perfect storm – such as floods and pandemics – are considered the
number-one industry disruptor, with almost 60%
The wealth management industry is in the midst
rating it as high impact. Potential competition from
of a high-pressure tempest as economic forces,
BigTechs did not rank among the top disruptors
competition from new entrants, and client
though this may be an area that requires more
expectations mount. Our global survey of wealth
considerable attention.24
management executives revealed that natural events
Figure 8. The wealth management industry faces disruption on multiple fronts, Mar–Apr 2020 (global)
Impact of natural events
such as pandemics
Changing client profiles
Global economic slowdown
and expectations
59%
35% 39%
The great wealth transfer
and uncertainty regarding
31% Wealth 31% Impact of technology and
change in business models
future customers management
industry
Fee pressure due to zero
disruptors Geopolitical instability
trading commissions and
increasing shift towards 29% 29%
passive products
26% 26%
Changing market dynamics
through increasing Threat of new entrants such
information transparency as BigTech firms
Question asked: “How much will the following factors impact wealth management firms in 2020?; Please rate on a scale of 1–7,
where 1= minimal impact, and 7= very high impact.” The above values represent ratings of 6 and 7.
Source: Capgemini Financial Services Analysis, 2020; World Wealth Report 2020 Executive Interviews.
24
BigTechs are large, data-driven technology firms such as Amazon, Apple, Facebook, Google, Alibaba, etc.
18World Wealth Report 2020
After robust market performance in 2019, the new decade began on a promising note. Within months,
however, COVID-19 had leveled unprecedented uncertainty. The urgent health crisis and collective concern
over the high social toll became the focus of individuals as well as businesses.
The cascading economic impact of the pandemic quickly became glaring, with enterprises shuttering and
unemployment soaring. Global financial markets suffered knock-out blows in the first quarter, with many
indexes dropping by more than 20% and oil prices hitting negative territory.25 Tech stocks may have driven
the market in 2019, but by early March 2020, the novel coronavirus had decimated nearly USD460 billion of
BigTech market cap.26
As markets slowly revive, powerful business lessons remain etched in our shared experience:
• The nature of disruption rarely allows sufficient time for strategic reaction.
• Therefore, digital capabilities have become central to business continuity.
• The ability to scale up or down quickly is a crucial skill.
• Physical assets can sometimes be a liability – look what happened to oil!27
The takeaway for wealth management executives? Business models that empower their firm’s resilience and
agility to prioritize the client journey are critical to achieving operational and profit goals.
Enter the 80–20 principle, in which 80% of all and then align high-impact client touchpoints with
outcomes are determined by 20% of all inputs. 28 those objectives. Once firm executives pinpoint the
We applied the principle to both the wealth most critical 20% of the value chain, they can focus on
management client journey and to the firm building capabilities that boost client engagement in
operating model to identify high-impact areas for the aligned touchpoints and explore ways to reduce
customer experience (CX) and firm profits. costs in lower-impact areas. Particularly within today’s
uncertain environment, astute prioritization can
The takeaway? Instead of trying to do the nearly
maximize overall benefits to the firm and positively
impossible, recognize the firm’s most important goals,
affect revenues.
Figure 9. Wealth management client journey and firm operating model
Client journey touchpoints
Researching Product/ Firm Receiving Personal- Receiving Accessing General Interactions Receiving
information service or selection portfolio ized educational Executing portfolio communi- with value-
about the investment and advice updates market transactions information cation with specific added
firm information onboarding about new information wealth experts in services
search products/ manager the firm
services
Wealth management firm operating model
Customer Customer Developing & Executing Value-added
Reporting
acquisition onboarding managing portfolio transactions services
Regulatory compliance
Source: Capgemini Financial Services Analysis, 2020.
25
BBC, “Coronavirus: Stock markets suffer worst quarter since 1987,” March 31, 2020; https://www.bbc.com/news/business-52113841.
26
CB Insights, “The Covid-19 Outbreak Has Erased Nearly $460B Of Big Tech’s Market Cap,” March 10, 2020;
https://www.cbinsights.com/research/coronavirus-facebook-apple-microsoft-google-amazon-impact/.
27
The New York Times, “What the Negative Price of Oil Is Telling Us,” Neil Irwin, April 21, 2020;
https://www.nytimes.com/2020/04/21/upshot/negative-oil-price.html.
28
Investopedia, “80–20 Rule,” February 19, 2020; https://www.investopedia.com/terms/1/80-20-rule.asp.
19The past few years have seen tremendous changes in beliefs (globalization, international
cooperation), in jurisdictions perceived to be safe and predictable (US, UK) and in the
role of technology in our lives. More recently, the global pandemic drove division (social
distancing) and unity. As the crisis subsides, we will have to consider to what extent these
developments should shape where we invest, where we locate assets, and how I should
engage with my advisors, balancing digital interaction and face-to-face solutions."
— Alexis Calla
Chief Investment Officer, Private Banking & Wealth Management, Standard Chartered Bank, Singapore
Wealth management Achilles’ backdrop, investors are similarly keen to access their
account information quickly to gain assurance about
heel: A lack of personalized their assets.
information and services Our survey of high-net-worth individuals, conducted
along the client journey just before the pandemic stoked worldwide fear in
mid-March 2020, revealed that investors are least
In today’s fear-of-missing-out information age, data is
satisfied at touchpoints related to personalized
a lifeline for businesses and individuals. The ubiquity
information or services from their firm. More than
of e-commerce has sparked research-intensive
60% of HNWIs reported unsatisfactory experience
consumer behavior when it comes to purchases or
during their attempts to research information
significant decisions. With the novel coronavirus as a
Figure 10. Firms are missing an opportunity to wow HNWIs in personalized information/ services,
Jan–Feb 2020 (global)
Touchpoints with lowest CXa Wow impact of touchpointsb
Personalized updates about
new products services 60% 44%
Researching information
61% 48%
More than 40% of
about the firm respondents said a
positive experience at
these touchpoints highly
Receiving educational market impacts their overall
information 63% 42% perception of the firm.
Receiving value-added
services
64% 43%
a. Percentages in the chart represent HNWIs who are not satisfied with their experience at the touchpoint.
b. Percentages in the chart represent HNWIs for whom a good experience at the touchpoint will strongly improve
overall firm perception.
Questions asked: (1) “For each of these interactions (touchpoints) with your primary wealth management firm, rate your
satisfaction with the service provided. Please use this sliding scale: 1 = Not at all satisfied, 7 = Extremely
satisfied.” The above values represent ratings 1–5.
(2) “To what extent will the quality of experience at each of the following interactions (touchpoints) impact your
overall perception of your primary wealth management firm?” The above values represent percentage of
HNWIs who chose the option “A good experience at this interaction will drastically improve overall firm
perception.”
Sources: Capgemini Financial Services Analysis, 2020; Capgemini Global HNW Insights Survey 2020.
20World Wealth Report 2020
about a firm, regarding personalized updates about good experiences at these touchpoints profoundly
new wealth offerings, when receiving educational affect their overall impression of a firm, and this
market information, and regarding value-added percentage may go up as a result of COVID-19 impact.
services. Given the current uncertainty, we expect the The proportion was higher (i.e., around 50%) for
experience and satisfaction levels to have dropped HNWIs younger than 40 for whom these touchpoints
further since our survey. generate the highest wow factor.
HNWIs aged 50–59 were the most dissatisfied with Including top-notch client experience as part of
their experience at touchpoints related to information the delivery of personalized information/services
access and value-added services. In terms of regions, is crucial for wealth management firms because
the lack of satisfaction was most pronounced among these touchpoints are the most vulnerable to
HNWIs in Europe (more than 65%) and Japan (more BigTech encroachment.
than 80%). We believe dissatisfaction may intensify
during the pandemic crisis as demand for digital HNWIs expect BigTechs to deliver personalized
services mounts. information or services better than incumbent firms.
While less-than-stellar CX at these touchpoints does The top five touchpoints in which HNWIs believe
not characterize core wealth management services, BigTechs can outperform incumbent firms relate to
it represents a missed opportunity to wow clients. information access or value-added services.
More than 40% of the HNWIs we interviewed say
Figure 11. HNWIs believe BigTechs outpace incumbent wealth management firms in wow-ability,
Jan–Feb 2020 (global)
% HNWIs who strongly agree that _____ firm is more likely to provide excellent service at the touchpoint
Wealth management BigTech
Researching information about the
13% 31% 18 pp
firm and its capabilities
11% Receiving value-added services 29% 18 pp
Receiving educational market
11% 29% 18 pp
information
13% Accessing portfolio information 30% 17 pp
Receiving personalized updates about
12% 29% 17 pp
new products and services
Note: pp denotes how much higher is the percentage of HNWIs who rate BigTechs as more likely to provide
excellent service.
Question asked: “For each of the following interactions, which institution – your wealth management firm or a BigTech firm – do
you think is more likely to provide an excellent service?; Please use this sliding scale: 1 = My wealth management
firm is more likely to provide an excellent service, 7 = A BigTech firm is more likely to provide an excellent
service.” Ratings 1 and 2 represent HNWIs who strongly agree that their wealth management firm is more likely
to provide excellent service, while ratings 6 and 7 represent HNWIs who feel so about BigTech firms.
Source: Capgemini Financial Services Analysis, 2020; Capgemini Global HNW Insights Survey 2020.
21This is not surprising, when you consider that more and HNWIs’ warm and fuzzy perception of BigTechs is
more digitally savvy HNWIs seek and prefer to receive especially concern-inducing when reflected in tandem
information via online channels. Self-service through with their openness to wealth management offerings
website emerged as the top channel of preference from BigTech firms . While 74% of HNWIs said they
for HNWIs when it came to firm or product research, are willing to consider BigTech wealth management
receiving updates, and executing transactions. offerings, the number jumps to 94% among those who
BigTechs lead in personalized online/mobile CX say they may switch their primary wealth management
thanks to technology advances firm in the next 12 months.
Alibaba’s online and mobile shopping website Taobao HNWIs in Latin America and Asia-Pacific (excl. Japan)
has evolved its push notifications from general, to expressed the highest likelihood to adopt wealth
targeted, to personalized to enhance CX by reducing management offerings from BigTechs. In Japan and
unnecessary notifications and boosting message North America, the interest in adopting BigTech
content specificity.29 offerings increases dramatically for HNWIs who are
likely to switch firms in 12 months.31 In terms of age
In addition to automated suggestions and a personalized
groups, HNWIs younger than 40 are most inclined, with
homepage, Amazon’s website showcases top lists such
as Bestsellers, Hot New Releases, Movers and Shakers, nearly 90% saying they are willing to adopt offerings
Most Wished For, and Most Gifted, to make customers’ from BigTech firms.
research and decision-making process easy.30
Figure 12. HNWIs are very open to adopting wealth management offerings from BigTech firms, by region (%),
Jan–Feb 2020
Customers Customers
overall likely to switch
78% 92%
Customers Customers
overall likely to switch Europe
61% 91% Customers Customers
overall likely to switch Customers Customers
overall likely to switch
North America 93% 98%
72% 100%
Asia Pacific
Customers Japan
likely to Customers Customers
Customers switch firms overall likely to switch
overall in
12 months
94% 96%
74% 94%
Latin America
Global
Note: Questions related to BigTech perceptions were posed only to those respondents who said they were familiar
with BigTech services (64% of overall global HNWI survey participants)
Question asked: “If technology firms such as Google, Apple, Facebook, Amazon, Alibaba, or Tencent were to offer wealth
management services, would you consider becoming a client? (Yes/No)”
Source: Capgemini Financial Services Analysis, 2020; Capgemini Global HNW Insights Survey 2020.
29
Alibaba Cloud, “Push Notifications Evolved: Taobao Knows You Better Than You Know Yourself,” November 8, 2019;
https://www.alibabacloud.com/blog/push-notifications-evolved-taobao-knows-you-better-than-you-know-yourself_595527.
30
MerchantWords, “How Sellers Can Leverage Amazon’s Approach to Personalization,” October 25, 2018;
https://www.merchantwords.com/blog/amazon-disruption-shopping-personalization.
31
Of HNWIs familiar with BigTech services, more than 8% in Japan and more than 26% in North America are likely to switch
their wealth management firm.
22You can also read