2020 NATIONAL REPORT - England, Northern Ireland, Scotland, Wales and the Republic of Ireland
←
→
Page content transcription
If your browser does not render page correctly, please read the page content below
England, Northern
       Ireland, Scotland,
       Wales and the
       Republic of Ireland

       COMBINED FIVE-NATION
       REPORT

2020
2020
       NATIONAL REPORT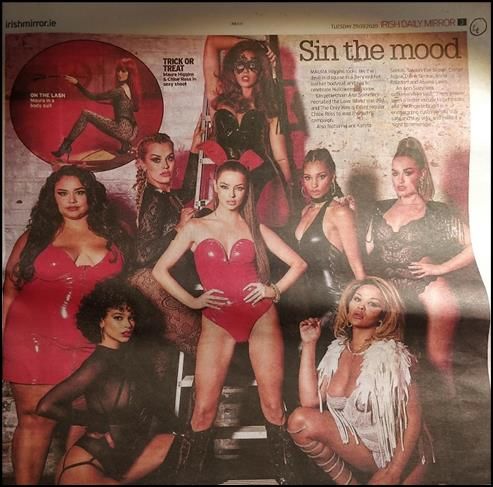
Global Media
  Monitoring
  Project

  2020

GMMP 2020 is licensed under creative
commons using an Attribution-
NonCommercial-NoDerivs.

GMMP 2020 is co-ordinated by the World
Association for Christian Communication
(WACC), an international NGO which
promotes communication for social
change,.

                                                  In Partnership with

Data for GMMP 2020 were collected
through the collective voluntary effort of
hundreds of organizations including gender
and media activists, grassroots
communication groups, university
researchers, students, media professionals,
journalists associations,
alternative media networks and faith
groups.
Noncommercial. You may not use this
work for commercial purposes.
No derivative Works. You may not
alter, transform, or build upon this
work.
For any use or distribution, you must         .
make clear to others the license
terms of this work. Your fair use and
other rights are in no way affected by
the above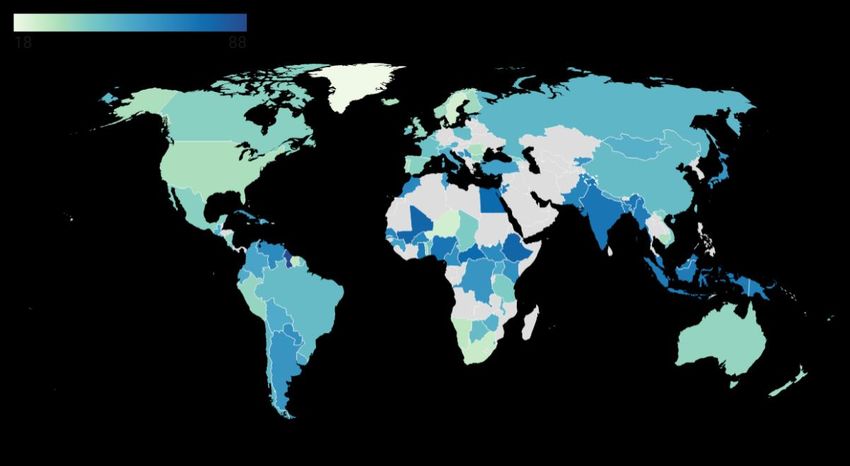
Acknowledgements

I would like to thank everyone who took part in GMMP2020 from the five nations which are
included in this report: England, Scotland, Wales, Northern Ireland and the Republic of
Ireland (RoI). Thanks to the coordinators for Scotland (Karen Boyle), Wales (Cynthia Carter),
Republic of Ireland (Dawn Wheatley) and Northern Ireland (Rhiannon Waterhouse Bradley)
for their hard work and good humour in working as part of this five-nation team and with
their group of monitors, and thanks to those latter. Thanks also to my own extensive and
excellent group of monitors for England. The names of all the monitors who worked as part
of this brilliant UK and RoI team are included in Annex 2 to this report.

Karen Ross
GMMP2020 Coordinator, UK
June 2021
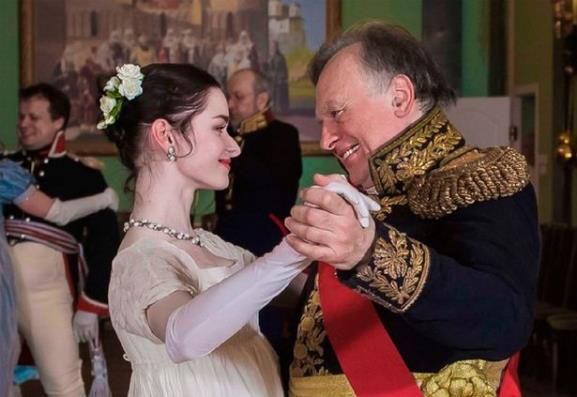
Table of contents

  PREFACE ___________________________________________________________________________ 6
    Global Context ____________________________________________________________________ 6
    Regional Context __________________________________________________________________ 7
    National Context __________________________________________________________________ 8
  Executive Summary __________________________________________________________________ 9
  A DAY IN THE NEWS IN FIVE NATIONS ___________________________________________________ 11
  THE CONTEXT ______________________________________________________________________ 11
    A. TOPICS IN THE NEWS ___________________________________________________________ 11
    B. NEWS SUBJECTS AND SOURCES ___________________________________________________ 13
    D. JOURNALISTIC PRACTICE ________________________________________________________ 20
    E. FOCUS ON COVID-19 NEWS ______________________________________________________ 22
    F. CASE STUDIES _________________________________________________________________ 25
  SUMMARY AND CONCLUSIONS ________________________________________________________ 29
  RECOMMENDATIONS AND ACTION PLAN 2021-2025 _______________________________________ 30

Annex 1. Methodology _________________________________________________________________ 31
Annex 2 - list of monitors and media monitored _____________________________________________ 33
THE WORLD AT A GLANCE
GENDER GAP IN SUBJECTS, SOURCES AND REPORTERS IN THE NEWS.

Figure 1. Gender Gap: News Subjects & Sources. Newspaper, radio and television news.

Data source: Global Media Monitoring Project, 2020

Figure 2. Gender gap: Reporters in the stories. Newspaper, radio and television news.

Data source: Global Media Monitoring Project, 2020

                                                       5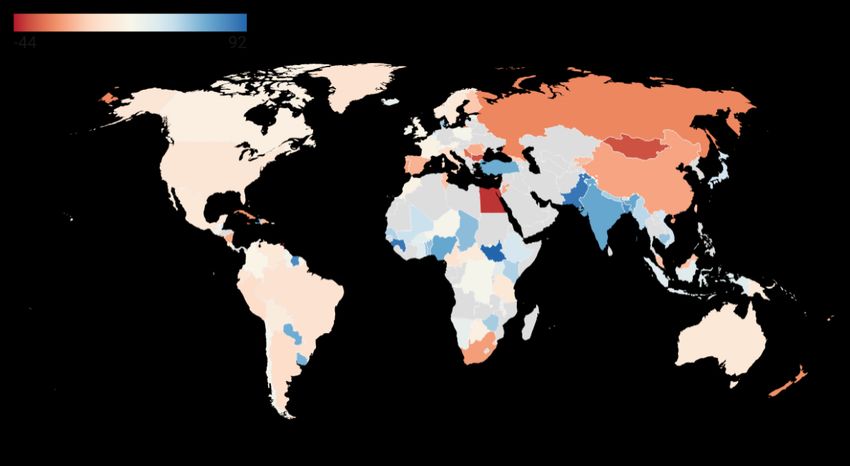
PREFACE

Global Context
The Global Media Monitoring Project (GMMP) is the world’s longest-running and most
extensive research on gender in the news media. The research was designed to capture a
snapshot of gender on one ‘ordinary’ news day in the world news media. An ordinary news
day is defined as one in which the news agenda contains the run-of-the-mill mix of stories,
everyday articles on politics, economy, social issues, crime and other issues.
It began in 1995 when volunteers in 71 countries around the world monitored women’s
presence in their national radio, television and print news. The media monitoring has been
repeated every five years since then, taking stock of change in the gender dimensions of
news media content and collecting statistical data on new indicators.
The 1995 research revealed that only 17% of news subjects – the people who are
interviewed or whom the news are about – were women. It found that gender parity was
“a distant prospect in any region of the world. News [were] more often being presented by
women but [they were] still rarely about women”.1
The first noteworthy change in women’s overall presence in the news was registered in 2005
in the third iteration of the research.2 Women comprised 21% of news subjects, a three-
percentage point increase over the period 2000 to 2005. Their near invisibility continued
however, with only 10% of stories focusing centrally on women, underrepresentation in the
major news topics and as voices in the news.
By the fifth GMMP in 2015, it was clear that “ordinary” news days could not be predicted or
planned in advance: unexpected events take place that dominate the news, from the Kobe
earthquake in 1995, to the Germanwings plane crash in the Alps in 2015.
The 2015 research in 114 countries revealed continued severe gender disparities in news
media content. Findings on key indicators suggested that progress towards gender equality
had lost traction; women remained only 24% of the persons heard, read about or seen in
newspaper, television and radio news, exactly the same level found in the fourth wave of
the research in 2010. Three editions of the research – in 2005, 2010 and 2015 – found no
change on the indicator measuring women’s participation in the news as reporters; only
37% of stories in legacy media were reported by women.

Women’s relative invisibility in traditional news media had also crossed over into the digital
news delivery platforms included in the GMMP monitoring for the first time. Only 26% of
the people in stories on mainstream news websites and media news Tweets combined were
women. The challenges of news media sexism, gender stereotyping and gender bias were
apparently intractable across time, space and content delivery platforms.

1
  Global Media Monitoring Project, Women’s participation in the news. National Watch on Images of Women in the Media (MediaWatch)
Inc. 1995
2
  Gallagher, Margaret. Who makes the news? Global Media Monitoring Project, 2005. World Association for Christian Communication.
                                                                6
UN Under-Secretary-General and UN Women Executive Director Phumzile Mlambo-Ngcuka
underlined that the ways in which women are depicted in the media “have a profound effect
on societal attitudes and reinforce traditional gender roles. Women and girls are half of
humanity. Giving equal time and weight to their stories, featuring them as positive models
not victims, plays an under-appreciated part in creating a better, freer world for all of us.”3

Events during the 2020 GMMP year were even more extraordinary; beginning in late 2019
and intensifying during the year, the world was ravaged by the novel coronavirus Covid-19.
This sixth wave of the research offered an opportunity to scrutinize gender in media
coverage during a global catastrophe, a time marked by a worldwide health crisis, and the
intensified inequalities accompanying the crisis.
GMMP teams in 116 countries monitored 30172 stories published in newspapers, broadcast
on radio and television, and disseminated on news websites and via news media tweets in
2251 news outlets. The number of participating nations increased by 63% since 1995 as
baseline data was collected for eight countries joining the study for the first time. The
number of news items monitored has doubled over the past 25 years and risen by over
8,000 since the 2015 edition.
Findings from the sixth GMMP reveal a mixed picture of progress, stagnation and
regression. While some glass ceilings are clearly being edged upwards, others are setting in
on certain important news media gender equality indicators, The past five years have seen
small incremental changes towards parity, at the same time, the overall pace of change
remains glacial.

Regional Context
News media remain the major and most influential source of information, ideas and opinion
for most people around the world. It is a key element of the public and private space in
which people, nations and societies live. A nation or society that does not fully know itself,
cannot respond to its citizens’ aspirations. Who and what appears in the news and how
people and events are portrayed matters. Who is left out and what is not covered are
equally important. Across the world, the cultural underpinnings of gender inequality and
discrimination against women are reinforced and sometimes challenged by the media. Who
is behind the camera, who sits in the newsroom and who controls the news desk have an
influence on what the public get to read, hear and watch about the world’s events and
GMMP calls attention to the extent to which news media continue to discharge their
responsibilities as the fourth estate.
      In 2015, 33 countries participated in GMMP 2015 and in 2020, 32 countries took part
(see Annex 2). While there has been a core set of European countries which have
participated in all or nearly all the GMMP monitoring days, 2020 was particularly challenging
because of Covid-19. That so many people, coordinators and monitors did so, is a testament
to their and our commitment to the broader GMMP project. While the impact of the
pandemic continues to be felt as I write this report in June 2021, it is interesting that on

3
    In Who makes the news? The Global Media Monitoring Project report, 2015
                                                      7
2020 monitoring day, only 27% of stories were coded as associated with Covid-19. This gives
us confidence to suggest that the data discussed in this report continue to serve an
important comparative function in relation to previous iterations.

National Context
In the UK, Covid dominated news agenda in relation to two major stories carried by all the
mainstream media: a) PM Boris Johnson was asked in a press briefing about the new C-19
restrictions which had just been imposed on the North East of England and made a mistake.
He later took to Twitter to say he had ‘misspoken’ and put the record straight; b) students
are to be ‘allowed’ to return home over the Christmas break: earlier it had been suggested
that they would have to stay on campus or in their accommodation over Christmas if they
tested positive or someone in the household did, to prevent the spread to other parts of the
country; c) another story which was carried by many news outlets concerned the 46 th
birthday of actor Gwyneth Paltrow who posted pictures of her naked body on her Instagram
account claiming that she looked good for her age because of what she ate; d) a fourth story
which was widely reported concerned the murder of a police officer who was shot by a man
who had been arrested and was in a holding cell in the police station awaiting processing; e)
a fifth story which was widely reported was allegations that Donald Trump had paid almost
no tax since he became President and very little in the preceding 10 years.
    In the Republic of Ireland, Covid-19, in some form, was also present across the news
media coded. September 29th was the day which recorded more than one million deaths
worldwide from the virus, so much of the coverage had a slightly more global element than
normal coverage over the previous six months. Domestically, four other stories appeared
repeatedly across the news: a) Covid development in Ireland, such as fears of a growing
second wave, employment/economic concerns, etc., and reaction to footage of students in
Galway city drinking/congregating on the streets; b) a follow-up story about a high-profile
judge who attended a golf dinner and breached Covid-19 guidelines; c) the release of
national crime figures (news reports typically highlighted the data and trends, rather than
any kind of analysis that drew on external sources); d) ongoing reaction to the news the
previous day that a politician was resigning his role to become involved in a banking
lobbying group which drew a lot of attention due to questions over a conflict of interest.

                                             8
Executive Summary
• Over the 15-year time period from 1995 to 2010, there was a slow but steady improvement
in the visibility of women as producers and subjects of news in the UK and the Republic of
Ireland. Between 2010 and 2015, there were some indications that this improvement had
stalled in some areas and the current data for 2020 show that there has been some progress
in women’s visibility over the past five years, but it is painfully slow, mostly showing
increases of a few percentage points and in some aspects, women are less visible than they
were in 2010.
• Across the five nations, we sampled 81 media including 23 newspapers, 17 TV and 11 radio
programmes, 13 twitter news sites and 17 online news sites. We coded a total of 1090
stories, 2040 sources and 893 media professionals.
• While we coded the secondary topic for Covid-19 stories so as to be able to provide
comparisons between the 2020 data and previous GMMP iterations, Covid-19 dominated
the news agenda, comprising the primary or secondary topic in 40% of all stories and so the
pandemic has necessarily exercised some influence in terms of our findings. We cannot
really know quite how the news landscape on sampling day was particularly influenced by
Covid-19, nor can we readily disentangle issue of gender from issues of Covid but
nonetheless, it is worth highlighting some of the headlines from the 2020 dataset.
• We coded a total of 1090 news stories across five media, distributed as: print (353), radio
(101), TV (185), internet (228) and twitter (228). Perhaps unsurprisingly, the major topic of
‘science/health’ was the most popular and accounted for 23% of stories. The influence of
the pandemic is very clear in these data when compared with the 2015 data from GMMP
UK/Republic of Ireland, when the ‘science/health’ major topic accounted for 8% of all news
stories across all media.
• There were only six stories which were coded as explicitly about gender although around 60
stories (5%) across all five media platforms mentioned some aspect of gender in/equality or
challenged gender stereotypes in some way.
• Across all five media types, we coded 2040 sources (an increase of 80 sources on 2015) of
which 31% were women in legacy media and 27% were women in internet and twitter
stories. If we disaggregate the five media, print provides the most opportunities for
women’s visibility (32%, an increase of 1% on 2015), followed by TV (31% an increase of 2%
on 2015), twitter (28%) and internet (27%), with radio including the least number of women
(23%, an increase of 1% on 2015). In 2015, sources for twitter and internet were combined
at 25% so again, a slight increase in 2020.
• Overall, across all media, women comprise 29% of all sources and subjects, an increase of
2% on 2015. The headline takeaway from this is that women are slightly more visible as
sources and subjects in news than in 2015, but for every one woman in the news there are
nearly three men, a ratio that has scarcely changed over 25 years.
• Women were most likely to be sources or subjects in stories categorized as ‘social and legal’
and least likely to be included in stories focused on ‘politics and government’. They are thus
9significantly under-represented in hard news stories such as politics and the economy and in
all the authoritative, professional and elite source occupational categories and are, instead,
significantly over-represented as voices of the general, public as homemakers, parents,
retired persons and young people.
• We also looked at the visibility of women and men from minority ethnic backgrounds,
identified either visually through accompanying photographs as being non-white or else
through their ethnicity being mentioned in the news stories themselves. We coded 124 (6%)
people as being from minority ethnic backgrounds, 30% of whom were women which
confirms the same pattern of gendered in/visibility we see across all sources.
• If we look at the function women perform in stories, their contribution as experts (26%) and
spokespeople (27%) are modest and have increased by 6% and 1% respectively on 2015 and
they are much more likely to speak in a personal capacity because of their particular
experience or direct involvement in the story. In other worlds, women are still positioned in
the private sphere of citizen rather than the public sphere of expert and professional.
• Findings show that there is an inverse relationship between gender and age, so as women’s
age increases, so their visibility in the news decreases: 31% of sources/subjects who were
coded as aged 50-64 in print media and 25% on TV were women, dwindling to 13% and 15%
in the 65-79 age group for the same media.
• As well as looking at subjects and sources, we also considered the people who are behind
the camera and in the newsrooms and coded a total of 893 journalists, reporters and
presenters, 41% of whom were women. The total number of media professionals has
increased by 431 on 2015 and the total number of women has increased by 9% on 2015,
largely because of the number of women writing in the digital news landscape.
• In terms of medium of employment, Twitter showed the most stories with a woman
journalist (51%), followed by TV (49%), internet (41%), print (37%) and finally radio (23%).
Interestingly in TV, the number of stories with women journalists has seen a significant
increase (15%) whereas for print (5%) and radio (2%), the increase has been rather less
dramatic and for radio, the number of women reporting stories is 13% lower than in 2010.
• Looking at TV and radio presenters, 47% of stories presented on radio had women
presenters, a more than doubling on 2015 (23%) although the proportion of TV presenters
has scarcely changed over the past five year, up 1% to 51%.
• As with news subjects, we also coded the age of 153 TV presenters (79 women and 74 men)
and found that 100% of everyone coded between the ages of 19 and 34 were women, with
two-thirds of women comprising the 35-49 yrs age group but only 37% of presenters who
were coded in the age group 50-64yrs. When we did the same for on-screen reporters, we
coded 100 reporters (50 women; 50 men) and we see the same pattern, with 80% of the
age group (35-49 yrs) being women, 50% of the next oldest age group comprising women
and only 16% of reporters in the age group 50-64ys comprising women.
• In summary, women continue to be under-represented as much as subjects and sources in
news media, as media professionals. They remain largely confined to the sphere of the
private, emotional and subjective, while men still dominate the sphere of the public,
10rational and objective. Given that more women than men are graduating from university
journalism courses, our findings suggest that women might be entering the profession but
are not progressing into the more prestigious beats at the same rate as men. Women have
been slowly advancing across the range of professions but do not enjoy the same visibility in
the media as expert and authoritative sources. The silencing of women’s voices as subjects,
creators and narrators of news is not a good news story, not for women, not for men, not
for society.
A DAY IN THE NEWS IN FIVE NATIONS
THE CONTEXT
We looked at 81 media including 23 newspapers, 17 TV and 11 radio programmes, 13
twitter news sites and 17 online news sites. We coded a total of 1090 stories, 2040 sources
(29% women) and 893 media professionals (41% women). The media outlets were chosen
on the basis of distribution, popularity and reach, and for the online/Twitter outlets, our
choices were based on sites which published a minimum number of stories and tweets as
set out in the global GMMP methodology. The five national coordinators were assisted by a
team of 37 media monitors and a list of their names and the media we monitored is
contained in Appendix 2. We also included three special questions: a) is this person from a
minority ethnic background; b) is the story about the Black Lives Matter campaign; c) is this
story about the Covid-19 regulations. Throughout the report, where we mention “legacy
media” we mean print, TV and radio and “digital” refers to the online news websites and
Twitter accounts we sampled. We also use the abbreviation “RoI” to refer to the Republic of
Ireland.
A. TOPICS IN THE NEWS
We start the description of the data we collected with the focus of the news on sampling
day and Fig 1 provides a breakdown on topics by main categories: these 6 categories
aggregate a total of 1090 stories. However, given the pandemic, we coded for topics which
related to Covid-19 (yes/no) but also coded those Covid-19 stories with their associated
topic focus. This means that Fig 1 includes all stories, both Covid-19 stories and non-Covid-
19 stories, and Fig 2 shows the breakdown of the sub-topics associated with the Covid-19
stories. We provide a discussion of the Covid-19 stories later in this report.
11Fig 1 – stories by major topic category
We coded a total of 1090 news stories across five media, distributed as: print (353),
radio (101), TV (185), internet (228) and twitter (228). Perhaps unsurprisingly, the major
topic of ‘science/health’ was the most popular across most media (with the exception of
print) and several of the other major topics showed similar patterns of frequency. Topic
categories which showed the most difference between the different media were ‘crime and
violence’ which were much more popular with digital media than broadcast and ‘celebrity,
arts, media and sports’ which were much more popular in print and TV news. In volume
terms across legacy media, ‘science and health’ topics accounted for 23% of stories,
followed by ‘politics and government’ and ‘celebrity, arts, media and sports’ with both
accounted for 17% and then economy (16%), ‘social and legal’ (15%) and ‘crime’ (9%). The
frequencies for digital media were: ‘science and health (21%), ‘politics and government’ and
‘social and legal’ (both 19%), ‘crime and violence’ (16%), ‘economy’ (12%) and ‘celebrity,
arts, media and sports’ (10%). Digital media’s higher incidence of stories about crime and
violence compared with legacy media is interesting and perhaps relates to assumptions
about the audience for digital news as being more vulnerable to ‘clickbait’ stories. The
influence of the pandemic is very clear in these data when compared with 2015 when the
‘science/health’ major topic accounted for 8% of all news stories across all media. Across all
media, we only coded six stories as gender-focused (one radio, one TV, three internet and
one twitter) although as we will see later, there were more stories which included some
element of gender in their narrative. As is clear from Fig 2, none of the Covid-19 stories had
a gender aspect.
12Fig 2 – the sub-topics associated with Covid-19 stories B. NEWS SUBJECTS AND SOURCES Overall visibility Across all five media, we coded 2040 sources of which 31% were women in legacy media and 27% were women in internet and twitter stories. If we disaggregate the five media, print provides the most opportunities for women’s visibility (32%), followed by TV (31%), twitter (28%), internet (27%), with radio including the least number of women’s voices (23%). Overall, across all media, women comprise 29% of all sources and subjects. As Table 1 below shows, in 2020 women were most likely to be sources or subjects in stories categorized as ‘social and legal’ and least likely to be included in stories focused on ‘politics and government’. Looking at the historical data, we can see that for both legacy and digital media, there is a slight (+2%) increase in women’s voices over the past five years but the proportion is still less (- 1%) than the 2010 landscape which, for a period of 10 years, is extremely disappointing. We coded six stories under the ‘gender-related’ major topic but sources in these stories do not appear in Table 1 as the combined number is
While it’s good to see more women appearing in the higher ‘value’ news genres such as
politics and the economy, both of which have seen an increase on the 2015 data, there is
almost no movement from 2010 and in fact a slight decrease for their visibility in these
stories. Given that the British Parliament has the largest proportion of women MPs in this
current term than any other period in its history, the lack of visibility is woeful: there have
also been increases in the proportion of women elected to the Irish Parliament, the Dáil
Éireann (the Irish Parliament), as well as the devolved administrations, but their voices
continue to be sidelined. However, this can be partially explained by the fact that, as we saw
earlier, the pandemic was (and still is) a significant feature of the 2020 news landscape with
political voices being dominated by political leaders and those with health portfolios, almost
all of whom are men, with the exception of Scotland, which has a woman Leader (First
Minister Nicola Sturgeon) and a woman Health Secretary (Cabinet Secretary for Health and
Sport, Jeane Freeman). If we look only at the Scottish data, we see that women accounted
for 33% of voices in political news and 42% of voices in science and health topics across
legacy media, showing the importance of women who occupy elite political position in
relevant areas, but also the potential skew. While we did not code individual names, it is
likely that Sturgeon and Freeman accounted for a high proportion of voices in those two
categories.
         The broader lack of women’s political voice was noted in several news reports which
appeared periodically during the first year of the pandemic, in which commentators pointed
to the very male-dominated line-ups of press briefings and the general absence of women’s
political voice. The ‘politics/government’ category accounts for the highest volume of all
media stories (22%), so women’s absence in these stories is a double blow. Interestingly,
when compared with the 2020 data for Europe comprising 33 countries including the UK
and the Republic of Ireland, women in our sample were more visible in stories about
celebrity (+7%), crime/social (+5%), social/legal (+2%) and politics (+2%) and less visible in
stories about the economy (-3%) and science/health (-6%) than the European average.
         For internet and twitter stories, we see a slightly different trend, with a more than
fourfold increase in women’s visibility in the lighter news genres such as celebrity, arts,
media and sports which is interesting but the reason why is not immediately obvious
although as we suggest at the beginning, this could simply be a function of the orientation
of the news agenda on the sampling day. Interestingly, looking at the Scottish data, only
13% of political stories included women’s voices, so prominence is not always associated
with frequency, at least not in digital media. Different patterns of visibility can be discerned
when comparing our data with that from the European region for internet and twitter
stories, where women are more visible in stories about celebrity (9%), crime/violence (+2%),
science/health (+1%) and less visible in stories about social/legal (-14%), economy (-3%) and
politics (-3%).

Occupation
Along with understanding which topics invite or attract women’s voices, who they are is also
meaningful to analyse. Table 2 gives a breakdown of occupations of women subjects and
sources as a proportion of all occupations we coded, although 116 sources had no
occupation mentioned, across legacy media. There were a number of occupational codes
which returned 0 for women including tradesperson/labourer, religious figure, sex worker

                                              14
and criminal suspect. As the data make very clear, women feature strongly as members of
the public with no other occupation provided and in predominantly non-professional
occupations. Unsurprisingly, politicians feature significantly in our sample, constituting by
far the largest group of sources and subjects (40%) but women are significantly under-
represented as a proportion of political sources, even though they comprised the largest
occupational group amongst all women in the sample (101 women – 26%). The percentage
of women politicians in the news in the British and Irish news stories are very similar (25%
and 24% respective), but again, if we look at the Scottish data, we see that 33% of politicians
we coded were women.
What’s interesting about comparing the UK data with the Republic of Ireland is that
although the percentage of women speaking in stories is more or less the same, they
comprise 34% of the UK Parliament and 22% of the Irish Parliament, the Dáil Éireann. This
suggests that Irish media are more willing to give their women politicians a voice than their
British counterparts. A similar pattern can be seen in the internet and twitter stories with
the most popular occupations amongst women sources comprising politician, government
employee, academic and media professional. Looking at the data for women’s occupations
in 2015 which indicated the top five and the bottom five most frequent occupations, we see
that there are some interesting differences but the highest % increases are where the actual
number of sources has decreased. The biggest % increase is in the academic expert
occupation and this could be explained by the more frequent inclusion of health academics
because of the pandemic. Conversely, the biggest % decrease is amongst health workers.
This suggests an increased reliance on expert sources at the expense of individuals on the
ground, further confirming much of the literature which suggests that high ‘status’ sources
are preferred as authoritative voices but as we see in Fig 3, these are still mostly men.
Table 2 – Occupation of sources/subjects
OCCUPATION % (+/- 2015) N (+/- 2015)
Retired person, pensioner 67 3
Homemaker, parent 66 (+8%) 9 (-15)
Child, young person no other occupation given 65 20
Student, pupil, schoolchild 50 (-34%) 34
Villager or resident 50 2
Activist or worker in civil society org., NGO, trade union 45 44
Media professional, journalist, film-maker, etc. 43 28
Academic expert, lecturer, teacher 40 (+25%) 59 (-6)
Royalty, monarch, deposed monarch, etc. 38 (-29%) 18
Health worker, social worker, childcare worker 31 (-57%) 21 (+1)
Lawyer, judge, magistrate, legal advocate, etc. 27 (+9%) 29 (-20)
Doctor, dentist, health specialist 25 44
Politician/ member of parliament, ... 24 (+2%) 409 (+5)
Business person, exec, manager, stock broker... 21 (+8%) 70 (- 32)
Office or service worker, non-management worker 20 (-47%) 10
Police, military, para-military, militia, fire officer 19 32
Celebrity, artist, actor, writer, singer, TV personality 18 50
15Government employee, public servant, spokesperson,
etc. 14 91
Sportsperson, athlete, player, coach, referee 8 24
Science/ technology professional, engineer, etc. 7 (-3%) 17
Function
When we look at the function that women perform in the stories in which they appear we
see that women are most likely to be included either because they provide eye witness
testimony, or because of personal experience, or as the voice of public opinion. Fig 3 below
shows the functions that women perform across legacy and digital media and although
there are some differences between them, the pattern is broadly similar: only around one
quarter of women contribute as experts or spokespeople. Twitter is something of an outlier
in terms of women’s role in news stories, including half as many women experts as the
other media and, conversely, including nearly twice as many women speaking their person
testimonies. Print media were the most likely to include women as voices of authority and
competence, perhaps because print is a longer-form of journalism than the other four and
journalists can include a more diverse range of sources by not always having to reach for the
usual suspect.
Fig 3 – function of source x medium
As we see from Fig 4 below, there has been very little change in terms of the function that
women perform in news stories over the past decade, with a significant skew which
continues to place women in the realm of the personal rather than professional. Over the
10-year period since 2010, the proportion of women spokespeople has risen by 2% and by
1% for women experts. This, despite efforts by media unions, third sector and and some
media organsiations to increase the pool of women experts through initiatives such as
expert women databases such as The Women’s Room
(https://www.thewomensroom.org.uk/)
16Fig 4 – function of source x time period
The age thing
Across the media of print, TV and the internet, we coded for age where it was possible to do
so, and found that as sources got older, women were less and less visible across all media.
For example, the most frequent age groups were 35-49 yrs and 50-64 yrs, and in print
media, women comprised 43% and 31% of sources in those age groups and for TV, the
statistics are even more stark at 32% and 25%. Internet stories showed a similar pattern of
25% and 25% respectively. In the age category of 65-79 yrs, there were even fewer women:
13% (print) 15% (TV) and 8% (internet) although interestingly, their numbers increased
slightly in the admittedly very infrequent (n=15) visibility of sources aged 80+ yrs,
comprising 27% and 25% respectively for print and TV. These findings are consistent with
the many studies which show how women more or less fall off the edge of the media
landscape when they reach middle-age.
The gender in/equality dimension
As well as a general interest in where women appear across the news landscape, we were
also interested in understanding more about those news stories which are explicitly focused
in issues of gender in/equality or where being a woman was the focus of a story. Of the 638
stories we coded in print, radio and TV, two (one each in TV and radio) were coded as being
about gender as the primary focus (both stories coded as ‘Sexual harassment against
women, rape, sexual assault, #MeToo #TimesUp’), although 25 stories (4%) mentioned
some aspect of gender and equality/inequality, the most popular major topic category being
the composited category of ‘social and legal’. In terms of stories which challenged gender
stereotypes, we coded 5% of stories as including this dimension with the major topic
categories of ‘politics’ and ‘crime/violence’ being the most likely. Of the 452 internet and
twitter stories in the sample, four were coded as being about gender, three of which were
coded as ‘sexual harassment against women, rape, sexual assault, #MeToo #TimesUp’ and
one as ‘other gender violence’. In these four stories, three of which were written/reported
on by women and one by a man, three women were coded as subjects/sources as were
seven men, demonstrating that even in stories about gender-based violence and
harassment, men were still more than twice as likely to be mentioned or sourced than
17women which says something rather troubling about who is accorded authority and
competence to speak on these issues. There were a further six stories which focused on
gendered aspects of major topics, including three about women politicians (all reported on
by men) and three on some aspect of the women’s movement, feminist activism or gender
advocacy, two of which were reported on by women and one by a male reporter.
Across all story topics in legacy media, women journalists were no more likely than
men to mention gender in/equality issues in their reportage with the exception of stories in
the ‘politics and government’ category, where women journalists (11%) were more than
twice as likely as men (4%) to mention the issue. Conversely, men were slightly more likely
(6%) to write stories which challenged gender stereotypes than women (4%), although such
stories work in both directions in terms of which gender stereotypes are being challenged.
In 2015, 27 stories (4%) included some aspect of gender in/equality, so we have seen
absolutely no change across the past five years, despite campaigns such as #me too, Times
Up, and the regular highlighting of gender pay gaps and women’s vulnerability to precarious
employment, all significantly exacerbated by Covid-19.
Victims and survivors
Across much media research, there has been a marked tendency for women to feature in
news as victims or survivors, often of male violence. Across legacy media, in 2010, women
were three times more likely to be described as a victim than men with a total of 19% of all
sources coded as victim. By 2015, the ‘victim’ status for both women and men had
decreased to 11% although 78% of domestic violence victims were women. In 2020, 10% of
all sources were described as victims, comprising 36 women (55%) and 30 (45%) men. In
addition to the ‘other’ victim category for both women and men, the next most frequent
victim category was as victim of domestic violence/rape/murder (19% respectively) with
slightly more women (54%) than men coded in this category. However, only women were
coded as victims of non-domestic sexual violence/rape/murder: men were more likely to be
described as victims of non-domestic crime (66%) and of war/terror (75%). Only 10 people
were coded as survivors (5 women; 5 men). When we compare the UK/RoI data with the
European data, we see that 62% of women were coded as victims of domestic violence/rape
and murder, 79% of women were coded as victims of non-domestic sexual violence and 48%
as victims of non-domestic crime. These small but important differences demonstrate why
its important to disaggregate regional data in order to identify national trends.
Those extra little details
There are several other gender-based differences in story content which are useful to
discuss. for example, for the UK legacy media, 23% of women subjects compared with 10%
of men had their family status mentioned and for digital media, the figures were 24% and
8%. For the RoI, the data were 15% and 5% respectively for both legacy and digital media.
Women journalists were much more likely to mention women’s family status than their
male counterparts and for internet stories, women journalists were significantly more likely
to source women to speak than men. Similarly, there were differences in the extent to
which women and men are invited to speak in stories with women being slightly more likely
(87%) to be quoted than men (78%). Interestingly, this is a switch from the 2015 data which
showed the opposite tendency. Finally, women were more likely to be photographed than
men in the UK (37% and 27% respectively) although women and men were almost equally
18likely to be photographed in RoI stories (37% and 38%).
The multiplier effect
Given that most of the digital media sites which were sampled (online news and twitter)
were the online versions of the legacy media we sampled, all the data are presented
separately so as to avoid amplification and over-representation of the findings. We were
interested to understand the extent to which news stories are multi-purposed across
different digital platforms and found that 43% of online news stories were shared on twitter
and 32% on Facebook, demonstrating the transversal nature of the media’s digital footprint.
The majority of tweets were original, 91% for UK and 88% for RoI.
Special Questions
In 2020, the GMMP methodology added a new aspect which encouraged national
coordinators to ask up to three ‘special questions’ which were pertinent to their particular
context. A number of European countries, including those in the UK and the Republic of
Ireland devised one SQ which asked if the source/subject was a member of a minority ethnic
community. The answer was determined by two criteria: whether the person was from a
visible minority compared with the majority (white) population where stories included a
picture; or if the person’s ethnic identity was mentioned in the news story itself in order to
pick up sources and subjects who were visibly white but from countries other than the five
nations in our sample. This is a very imprecise measure because of the subjective nature of
identification by eye only, hence also looking for mention of ethnic markers in the news
stories themselves, but our data does at least give a sense of minority/majority
representation. We coded 124 sources and subjects as being from a minority ethnic
background (6%) with news items concerned with crime being the most likely to mention or
include such a person (32%), followed by political stories (19%), stories about the
science/health (17%) and celebrity stories (14%). Stories including people from minority
ethnic backgrounds were more likely to be carried by print media (37%) than any other
media, with internet stories being the second most likely at 31%.
Interestingly, women from minority ethnic communities were most likely to appear
in celebrity stories (77% of all sources in these stories and 37% of all women) and crime
stories (25% of all sources and 26% of all women). Only one source (out of 21 coded) about
science/health was a woman. The latest official figures for Black and Minority Ethnic
communities in the UK, taken from the 2011 census, is estimated at around 14% although
by 2020, this will have increased substantially, likely by at least 50%, but even at the official
figure, it is obvious that people from those communities are considerably under-
represented across the news landscape.
The killing of George Floyd in on 25 May 2020 sparked protests around the world,
many using the hashtag #BlackLivesMatter, so our second SQ was to ask if the news item
was about any aspect of the BLM movement. However, by the time of the collection point,
as is so often the case, the BLM movement had ceased to be especially newsworthy and we
only coded five stories about it, two in politics-focused stories and three on celebrity news.
Our third special question related to Covid itself and asked if the story was about the
Covid restrictions because in late September 2020 in the UK, there was considerable
confusion about what the restrictions were and which nations were observing which
restrictions, to the point where even the Prime Minister gave the ‘wrong’ answer to a
19journalist and subsequently took to social media to remedy his error. This special question
was not included in the Republic of Ireland sample as it was not relevant. We coded 110
such stories, most of which were science/health and social/legal (31% and 28% respectively)
with print, TV and the internet being the media most likely to carry such stories. Women’s
voices accounted for 40% of the sources in this latter group of stories, comprising exactly
half the sources in science/health stories and just over half the sources in the social/legal
stories.
D. JOURNALISTIC PRACTICE
As well as looking at subjects and sources, we also considered the people who are behind
the camera and in the newsrooms and coded a total of 893 journalists, reporters and
presenters, 41% of whom were women. This is an increase of 9% on the 2015 study where
we coded 431 media professionals, of whom 32% were women. In terms of medium of
employment, Fig 5 shows the percentage of women working as journalists in the three
legacy media over the past 10 years, demonstrating that for TV, the number of women
working as journalists has seen a significant increase whereas for radio and print the
increase has been rather less dramatic and for radio, their numbers are nowhere near as
high as in 2010. Women are also significantly involved in digital reporting, with 41% of
online and 51% of twitter stories being attributed to women journalists which suggests that
the digital landscape is offering more opportunities for women journalists, although this
does not seem to have had an impact on women’s visibility in digital news which remains
below the level of legacy media. In terms of TV and radio presenters, we coded 47% of
stories presented on radio had women presenters, a more than doubling on 2015 (23%)
although the proportion of TV presenters has scarcely changed over the past five years, up
1% to 51%. That women are more visible as announcers on TV than in any other role or
medium reflects the findings of many other studies and is likely to be associated with what
has been termed the ’feminisation’ or ’intimisation’ of news, where news is fronted by an
attractive young-ish woman (sometimes paired with an older, not necessarily attractive
man), whose friendly persona is regarded as more appropriate for delivering news-as-
infotainment. Their ’success’ in this role is somewhat offset by women’s continuing struggle
to achieve visibility as reporters across all media.
20Fig 5 – journalist x medium x time period
Notwithstanding the caveats around the problems of subjectivity when coding for age,
when we did this for news presenters, we attempted to find out the actual ages of
presenters by using search engines although this did not always yield information. However,
we coded the age of 153 TV presenters (79 women: 74 men) and found that 100% of
everyone coded between the ages of 19 and 34 were women, with two-thirds of women
comprising the 35-49 yrs age group but only 37% of presenters who were coded in the age
group 50-64 yrs.
When we did the same for on-screen reporters, we coded 100 reporters (50 women;
50 men) and we see the same pattern, with 80% of the age group (35-49 yrs) being women,
50% of the next oldest age group comprising women and only 16% of reporters in the age
group 50-64 yrs comprising women. Once again, these findings reflect other research which
show that younger women are often paired with avuncular men and given the lighter stories
to present, yet another example of horizontal segregation. The near-invisibility of older
women as both presenters and reporters is also a trend found in much of the literature,
although the statistics are a slight improvement on the 2015 landscape when, for example,
only 4% of reporters in the older age group were women.
Scope
In terms of geographic scope, we saw similar patterns for women and men writing local and
national stories, with around two-thirds writing stories coded as ‘national’ and around 20%
being ‘local’ across legacy media outlets. Where there were differences were in the ‘sub-
regional’ and ‘foreign’ stories, with 5% of women writing the former compared with 3% of
men, and 11% of women writing the latter compared with 15% of men. While these are
relatively small percentage differences, there were twice as many men writing foreign news
stories than women which suggests that women still struggle to attract the international
beats compared with men. In terms of major topics, women and men have very different
beats as demonstrated in Fig 6. Women are more likely to write stories about celebrities
(54%), science and health (45%) and social/legal (37%) and men more likely to write stories
21on politics/government (75%), crime/violence (74%) and the economy (68%). This once
again conforms to other studies which look at horizontal segregation in terms of news beats
with women working in the least prestigious area of celebrity and lifestyle.
Fig 6 – journalism beat
E. FOCUS ON COVID-19 NEWS
Covid-19-related stories accounted for 40% of all stories across all media, with TV having the
highest proportion (51%) and twitter the lowest (33%). Table 3 demonstrates the key
differences between Covid-19 stories and all stories. This demonstrates the considerable
impact that the pandemic had on news content. In terms of major topic, although ‘science
and health’ were the top topics across all media, there was more variation across the other
topic areas, with print and internet favouring ‘social and legal’, radio and TV favouring
‘economy’ and twitter favouring both economy and ‘social and legal’. This demonstrates
that the pandemic not only affected the health of the nation but was associated with all
aspects of social, cultural and economic life. While stories focused on crime and violence
showed the least association with Covid-19, those that did were mostly stories about the
rise in domestic violence, including increased use of helplines and incidence of reported
crime as a consequence of lockdown measures. Neither of the gender-focused stories
showed a Covid-19 association.
Given that 40% of all stories were related to Covid-19, when we compare the Covid-
19 stories with all stories, we see that some media and some topics are particularly
dominated by pandemic narratives, in particular TV and internet stories about the economy,
print stories about social/legal and twitter stories about science and health. What is perhaps
surprising is how few Covid-19 stories are related to crime and violence, given the increased
incidence of domestic violence during lockdown although this can also be understood as a
function of the GMMP methodology and its focus on a single reporting day. It also needs to
be acknowledged that some of the numbers are very small: for example, there were only six
stories in the ‘celebrity’ category on radio and only four stories in ‘crime/violence’.
22Table 3 – Covid-19 stories and all stories x topic and medium
COVID-19-RELATED PRINT RADIO TV INTERNET TWITTER
Politics and Government 32% 38% 18% 45% 20%
Economy 46% 58% 79% 42% 34%
Science and Health 61% 67% 70% 73% 76%
Social and Legal 65% 33% 53% 58% 33%
Crime and Violence 0% 0% 8% 6% 6%
Celebrity, Arts and Media, Sports 12% 50% 38% 18% 20%
ALL TOPICS PRINT RADIO TV INTERNET TWITTER
Politics and Government 17% 21% 15% 19% 20%
Economy 15% 19% 16% 11% 14%
Science and Health 20% 30% 27% 23% 20%
Social and Legal 12% 18% 18% 20% 18%
Crime and Violence 12% 4% 7% 16% 16%
Celebrity, Arts and Media, Sports 21% 6% 16% 10% 11%
Finally, Fig 7considers women’s functions across different story topics. They contribute as
experts across the broad topics of politics, economy, science/health and social legal but still
comprise less than 28% of expert commentators.
Fig 7 – source x major topic x function
23Women were least likely to be the subjects of news and featured most strongly in science
and health topics (25%): across the whole sample, women were coded as subjects in 30% of
news stories. However, they mostly contribute personal experiences, popular opinion and
eye witness accounts, mostly in economic topics (75% of popular opinion voices), science
and health (64% of personal experiences) and social/legal (75% of eye witnesses). Across
the whole sample, women were coded as providing 55% of eye witness accounts, 45% of
personal experiences and 44% of public opinion. This suggests that Covid-19 stories
provided more opportunities for women’s voices to be heard but they were mostly in the
domain of the personal rather than political or professional.
24F. CASE STUDIES
ARTICLE # 1
Headline: “Sin the mood”
Published in the Irish Daily Mirror, print version
Blatant stereotype
Summary: Ann Summers is an ‘adult’ brand which sells a variety of adult merchandise including
lingerie. Here, the story is about their new ‘Halloween at home’ campaign which features two reality
TV stars, Maura Higgins and Chloe Ross.
Analysis: The story takes up most of a page (3) using a very large image taken from the photoshoot
for the Halloween campaign, accompanied by a small amount of text. The main focus is on Maura
Higgins who is in the centre of the picture,
and in the separate inset picture in the top
left of the page. Although the photograph
includes women from a mix of ethnic
backgrounds and body shapes, which could
be seen as positive (although this is down to
Ann Summers rather than the journalist), it
nonetheless re-circulates the male gaze
which merely consumes the female body
for its own entertainment while denying
women’s agency, despite their provocative
‘power’ stance, by pouting for the camera.
That the photo is on page 3 is also salient
given that the UK’s Sun newspaper routinely
portrayed semi-naked young women on
page 3 and indeed ‘page 3’ became
synonymous with naked women. The play
on words in the title is a typical tabloid
conceit designed to be a bit ‘cheeky’ and to
show that the article is meant to be light-hearted and fun, perhaps attempting to obscure the very
obvious pornificaion of the women. A spokesperson (unnamed woman) for Ann Summers is quoted
as saying that the brand encourages customers to stay safe and sexy.
MEDIA ACCOUNTABILITY SCORECARD
Story is fair, accurate and balanced from a gender equality perspective - POOR
Story clearly highlights the human and/or women’s rights dimensions of the issue - POOR
Story contains the views, perspectives and concerns of women as well as men, told in their own voices – POOR
SCORE: E
25ARTICLE #2
Two story comparison (on same page)
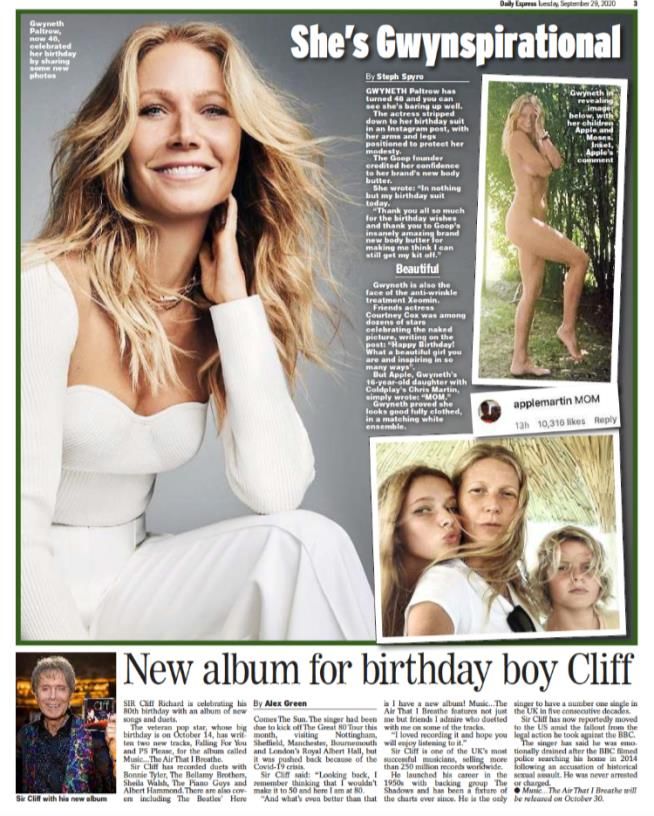
Headline 1: “She’s Gwynspirational”
Headline 2: “New album for birthday boy Cliff”
Published in the Daily Mirror, print version
Subtle stereotype
Summary: two articles appear on the same page, both about celebrity birthdays, actor Gwyneth
Paltrow (48) and singer Cliff Richard (80) but the orientation and focus of each article is very
different.
Analysis: the Paltrow article includes a very large photo of Paltrow looking happy and tanned and
two smaller inset photos, one of an Instagram post Paltrow made of herself and one of her and her
two children. The article mentions that she company she founded has produced a body butter and
that she is the face of an anti-wrinkle
treatment, positioning her as someone who
monetises her body/face, although she is
also framed as an entrepreneur. But the
journalist fails to mention that she’s an
established actor who has won several
major awards including an Oscar, an Emmy
and a BAFTA. On the other hand, the much
smaller article (in terms of page space) on
Cliff Richard documents his past and
current achievements, describes him as a
‘veteran pop star’ who has sold more than
250 million records and mentions his
knighthood (Sir Cliff Richard). All this
information is crammed in a small space
because the accompanying photo is tiny
and the font is small. The overall impression
is that Paltrow is little more than a pretty
body and a mother of two, while Richards is
a highly accomplished artist who has been
honoured for his achievements.
MEDIA ACCOUNTABILITY SCORECARD
Story is fair, accurate and balanced from a gender equality perspective - WEAK
Story clearly highlights the human and/or women’s rights dimensions of the issue - WEAK
Story contains the views, perspectives and concerns of women as well as men, told in their own voices – WEAK
SCORE: D
26ARTICLE #3
Headline: “Dad spent two days identifying dismembered body parts of daughter ‘killed by her lover’”
Published by The Mirror, online
Subtle stereotype/missed opportunity
Summary: this is a story about the trial of a man accused of murdering his lover. The prosecution’s
case is that Anastasia Yeschenko was a young woman student who was shot three times at close
range, her body dismembered and then thrown in a river in St Petersburg by the man described as
her ‘lover’ who has also one of her university professors, Oleg Sokolov.
Analysis: the headline is rather misleading as Yeschenko’s father is only quoted once at the
beginning of the article and the rest of the content comprises quotes from neighbours who heard a
row on the night she died, and a comment from
her mother that Anastasia was about to end the
relationship. We are told nothing about
Yeschenko’s character but Solokov is described as
an “internationally-acclaimed Napoleon expert”.
As part of his defence, Sokolov alleged that
Yeschenko sent him ‘vile and disgusting’ text
messages. The article also includes two photos of
Yeschenko and Sokolov enjoying time together,
with the subtle implication that there must have
been a reason why Solokov was provoked to
murder since he was not denying his action,
merely justifying it as provocation. The only perspective we read is Sokolov’s and a video showing
him in court defending himself sits at the top of the article: he is quoted at the top, in the substance
and at the end of article. The very obvious power differential between the two, both in status and
age (she was 24, he was 64) is not discussed, nor are comments invited to describe Yeschenko’s
character, so she is left tainted by Sokolov’s comments as a ‘disgusting’ woman and implicitly, an
unworthy victim, with no one speaking on her behalf.
MEDIA ACCOUNTABILITY SCORECARD
Story is fair, accurate and balanced from a gender equality perspective - WEAK
Story clearly highlights the human and/or women’s rights dimensions of the issue - WEAK
Story contains the views, perspectives and concerns of women as well as men, told in their own voices – WEAK
SCORE: D
ARTICLE # 4
Headline: “Women who go private to give birth more likely to have Caesarean”
Published in The Irish Times, print version
Missed opportunity
Summary: women who attend private hospitals to deliver their babies are almost three times more likely
to have an elective Caesarean section than women attending a public hospital, according to a recent
study.
Analysis: the article discusses women who opt for private care are more likely to have experienced
pregnancy loss, infertility treatment and multiple pregnancies, and are on average more than five years
older than public patients. This story reports on a study published in BMC Pregnancy and Childbirth
Journal that finds women who attend private hospitals for childbirth are three times more likely
than public patients to have an elective Caesarean section. The story outlines the details of the
27You can also read