2 Local government & the Welsh budget: Outlook and challenges for the next Welsh Government - Cardiff University
←
→
Page content transcription
If your browser does not render page correctly, please read the page content below
2

Local government & the Welsh
budget:
Outlook and challenges for the next Welsh Government

                                                                       WELSH ELECTION BRIEFING

Wales Fiscal Analysis
               Fiscal Analysis │ Local government & the Welsh budget
A P R I LWales
          202    1                                                                      1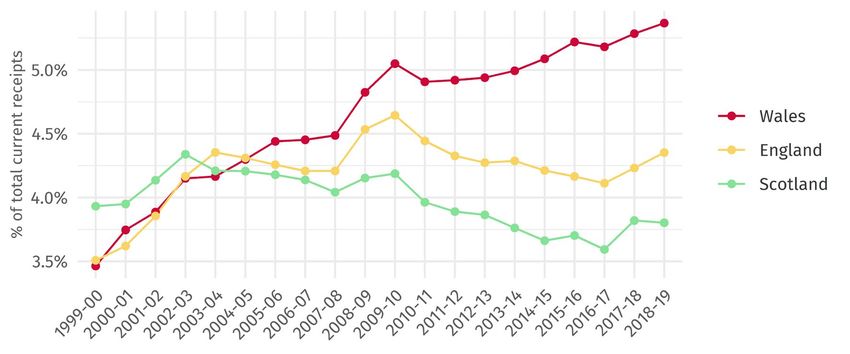
Preface

Declaration of funding
Wales Fiscal Analysis is hosted by the Wales Governance Centre and the School of Law and
Politics at Cardiff University, and funded through a partnership between Cardiff University, the
Welsh Government, the Welsh Local Government Association and Solace Wales. The
programme continues the work of Wales Public Services 2025 hosted by Cardiff Business
School, up to August 2018.

About us
Wales Fiscal Analysis (WFA) is a research body within Cardiff University’s Wales Governance
Centre that undertakes authoritative and independent research into the public finances,
taxation, and public expenditures of Wales.

The WFA programme adds public value by commenting on the implications of fiscal events such
as UK and Welsh budgets, monitoring and reporting on government expenditure and tax
revenues in Wales and publishing academic research and policy papers that investigate matters
of importance to Welsh public finance, including the impact of Brexit on the Welsh budget and
local services, options for tax policy, and the economics and future sustainability of health and
social care services in Wales.

Working with partners in Scotland, Northern Ireland, the UK and other European countries, we
also contribute to the wider UK and international debate on the fiscal dimension of devolution
and decentralisation of government.

Accessing data tables
Data tables to accompany this report have been made available online:
www.cardiff.ac.uk/wales-governance-centre/finance

Contact details

Cian Siôn
sionc1@cardiff.ac.uk
029 2251 1795                                                             Wales Fiscal Analysis
                                                                            Cardiff University
Guto Ifan                                                                        Law Building
ifandg@cardiff.ac.uk                                                         Museum Avenue
029 2087 4626                                                                Cardiff CF10 3AX

Wales Fiscal Analysis │ Local government & the Welsh budget                                    2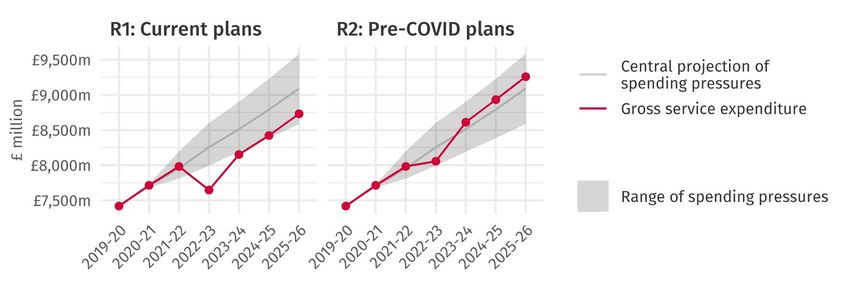
Local government & the Welsh budget:
     Outlook and challenges for the next Welsh Government

                         WELSH ELECTION BRIEFING 2
                                    Wales Fiscal Analysis
                                  Wales Governance Centre

Wales Governance Centre Director
Professor Richard Wyn Jones

Wales Fiscal Analysis Academic Lead
Dr Ed Gareth Poole

Honorary Senior Research Fellow – Wales Fiscal Analysis
Michael Trickey

Wales Fiscal Analysis │ Local government & the Welsh budget   3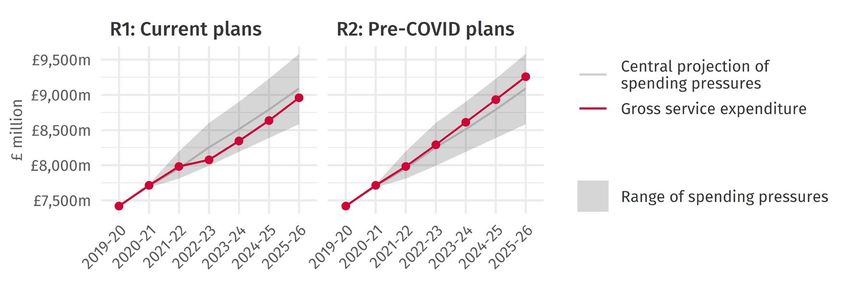
Contents

Executive summary ................................................................................................... 5

1. Introduction........................................................................................................... 8
2. Recent trends in local government finance ............................................................... 9
   2.1. Funding revenue expenditure ......................................................................................... 9
   2.2. Trends in revenue expenditure ..................................................................................... 11
   2.3. Other income (including fees & charges) ...................................................................... 13
   2.4. COVID-19 and local authority budgets ......................................................................... 13
3. Spending pressures to 2025−26 ...............................................................................14
   3.1. Schools ......................................................................................................................... 16
   3.2. Social services .............................................................................................................. 20
   3.3. Other local government services .................................................................................. 24
   3.4. Ongoing COVID-19 expenditure and income losses ..................................................... 26
   3.5. Summary of spending pressures .................................................................................. 28
4. Revenues outlook to 2025−26 ................................................................................. 31
   4.1. Aggregate External Finance & specific grants .............................................................. 32
   4.2. Council Tax .................................................................................................................. 33
   4.3. Overall revenues outlook ............................................................................................. 35
5. Estimating the funding gap ................................................................................... 36
   5.1. The funding gap to 2025−26 ......................................................................................... 37
   5.2. The potential impact of NHS COVID-19 legacy costs ................................................... 38
6. Conclusion ........................................................................................................... 40

A. Annexes ...............................................................................................................42
   A1. Projecting spending pressures ...................................................................................... 42
   A2. How are local authorities funded? ................................................................................ 45
B. References ...........................................................................................................47

Wales Fiscal Analysis │ Local government & the Welsh budget                                                                               4
Executive Summary

COVID-19 has presented a series of unique challenges for local authorities. Not only has it
required increased expenditure on existing – as well as new – responsibilities, but it has also
constrained local authorities’ own revenue-raising capacity. In 2020−21, most of these costs
were met through the Welsh Government’s Single Hardship Fund; but from April 2022,
government spending is once again set to become more restrained.

This report outlines the sources and scale of local authority sending pressures over the next five
years. It identifies a gap between the projected path of funding for local authorities and the
levels of expenditure required to meet future spending pressures on current UK spending plans.
The possibility that the next Welsh Government may be under pressure to divert a considerable
sum of additional resources to the NHS to meet the legacy costs of COVID-19 means that this
funding gap could be considerable. 1

Recent trends in local government finance

       •    There has been a marked change in the way local authorities in Wales are funded over
            the past decade. The value of government grants to local authorities fell by 16.8% in
            real terms between 2009−10 and 2019−20.
       •    Council Tax now accounts for a significantly larger share of the total tax take in Wales
            (5.4%) than in England (4.3%) and Scotland (3.8%).
       •    Spending on local authority services fell by 6.0% in real terms between 2009−10 and
            2019−20. Adjusting for population growth, spending per head is 9.4% lower than it was
            a decade ago.
       •    More than £500 million was delivered to local authorities through the Single Hardship
            Fund during 2021−21. In total, the value of Welsh Government support to aid local
            authorities’ response to the pandemic exceeds £1 billion.

Spending pressures to 2025−26

       •    On central projections, meeting local authority spending pressures in full entails an
            average increase in spending of 3.4% a year (in cash terms) between 2020−21 and
            2025−26 (2.5% and 4.4% in our lower and higher cost scenario, respectively).
       •    Despite the considerable uncertainty around the ongoing costs of COVID-19, they are
            dwarfed by the underlying demographic and inflationary pressures. Unfunded costs
            associated with the pandemic account for only 9% of total spending pressures in
            2022−23, and this share continues to fall in future years.
       •    By 2025−26, social services accounts for 55% of all local authority spending pressures,
            with school pressures accounting for a further 21% (Figure E1).

1   See, (Ifan 2021) for an analysis of the legacy costs of COVID-19 on the health service in Wales.

Wales Fiscal Analysis │ Local government & the Welsh budget                                            5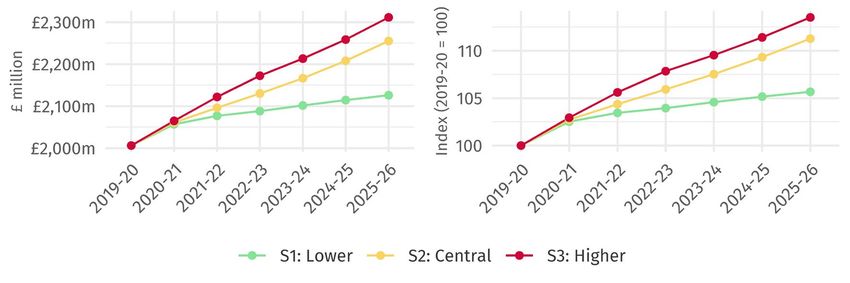
Figure E1
         Components of spending pressures for local authorities from 2019−20

          Source: WFA analysis. See Annex A for further detail. Excludes COVID-19 pressures funded through the
                                                                                         Single Hardship Fund.

Revenues outlook to 2025−26

    •    On current spending plans, local authority gross revenue expenditure is projected to
         grow by 2.9% a year on average between 2022−23 and 2025−26. If the UK Chancellor
         reverses cuts made to planned spending since March 2020, gross revenue expenditure
         is projected to grow by an average of 3.8% a year over the same period.
    •    The local government settlement is spared from the real terms cuts that some
         government departments are set to face because of the multi-year spending plans for
         schools in England. Pupil numbers are set to rise in England and contract slightly in
         Wales meaning that the implied growth in funding for Welsh schools exceeds growth
         in underlying funding pressures.

Estimating the funding gap

    •    In 2022−23, spending pressures are projected to exceed local authorities’ spending
         power by £178 million due to a combination of COVID-19 legacy costs and slower
         growth in the settlement. This gap narrows in future years, but spending levels remains
         £132 million short of the amount required to meet all pressures in 2025−26 on current
         plans (in cash terms).
    •    If the Welsh Government decides to meet the projected legacy costs of COVID-19 on
         the NHS from within its own budget, local authorities’ spending power could fall short
         of spending pressures by £607 million in 2022−23, and an average of £362 million a year
         over the following three years. Even if the UK government reverts to its pre-COVID

Wales Fiscal Analysis │ Local government & the Welsh budget                                                 6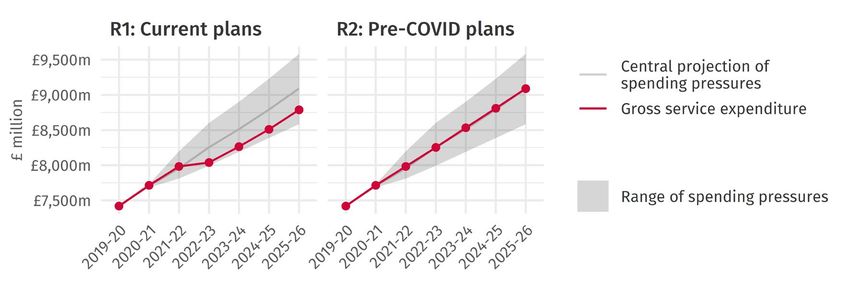
spending plans, funding remains £198 million short of spending pressures in 2022−23,
         though the pressures could be met in future years (Figure E2).
    •    Above-inflation increases to Council Tax are set to continue – the numbers quoted
         above are predicated on a 4.5% annual increase. Reversing the cuts made to spending
         plans since March 2020 could release enough funding to allow Council Tax to rise by
         inflation (2.0%), but this seems unlikely given the additional demands for funding in the
         health service. This arguably strengthens the case for revisiting the way the local
         taxation system operates in Wales.
    •    Although the UK government’s spending plans act as a soft constraint on local
         government spending, the Welsh Government’s newly acquired powers over devolved
         taxes and local taxation arrangements could provide an alternative way of funding
         additional local expenditure over the next Senedd term.

         Figure E2
         Estimate of the funding gap to 2025−26 (4.5% Council Tax increase & NHS COVID-
         19 legacy costs are met)

         Source: WFA analysis. See Annex A for further detail. Excludes expenditure financed by COVID-19 grants
                                                                                        in 2020−21 and 2021−22.

Wales Fiscal Analysis │ Local government & the Welsh budget                                                  7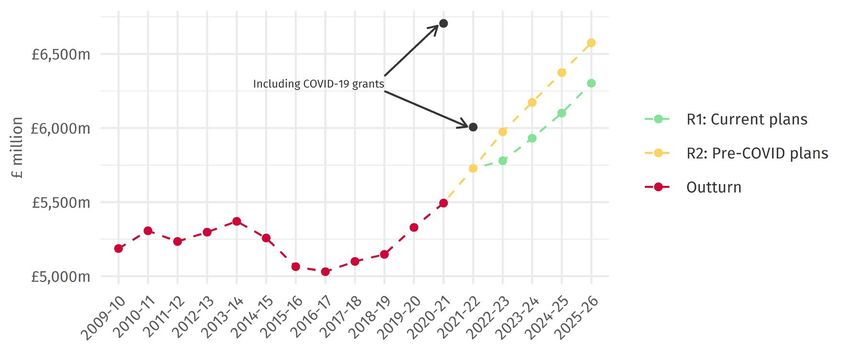
1           Introduction

COVID-19 has presented unprecedented challenges for governments across the UK. For local
government, not only has the pandemic required increased expenditure on existing – as well as
new – responsibilities, but it has also constrained local authorities’ own revenue-raising
capacity. Income that is normally generated by council activities has been considerably reduced
as lockdown measures have restricted the operation of many of these services.

In 2020−21, local authorities could submit claims to the Welsh Government’s Single Local
Government Hardship Fund to cover the additional expenditure and income losses incurred
because of COVID-19. As of mid-March 2021, around £500 million has been paid through this
scheme. The Welsh Government has provided further hypothecated grants to fund other
policies, such as extending Free School Meals provision over the holidays and financing direct
payments to businesses and individuals through business rates grants and self-isolation
payments. A relatively generous local government settlement allocated an additional £264
million to aid local authorities with their response to COVID-19 in 2021−22.

But from April 2022, government spending is once again set to become more restrained. The
Chancellor’s decision to revise UK spending plans downwards in November 2020 and March
2021 means that the projected size of the Welsh budget will be approximately £600 million a
year smaller in 2022−23 and 2023−24, compared to pre-pandemic plans (Ifan, Rodríguez, and
Siôn 2021, 7). A smaller spending envelope, underlying demographic and inflationary pressures,
and the ongoing costs of dealing with the aftermath of the pandemic combine to create a
challenging fiscal outlook. On current UK spending plans, local authorities face a funding gap
of £178 million in 2022−23, and an average shortfall of £152 million a year over the following
three years. If the Welsh Government decides to allocate additional resources to meet NHS
spending pressures, the outlook for local government could be considerably more austere.

This report sets out the sources and scale of local government spending pressures over the next
five years and presents an estimate of the funding gap under different scenarios. It proceeds as
follows:

    •    Chapter 2 sets the context by outlining the trends in local government expenditure
         and sources of financing from 2009−10 to 2019−20
    •    Chapter 3 provides a breakdown of the spending pressures facing local authorities
         over the next five years
    •    Chapter 4 presents the outlook for local government revenues to 2025−26
    •    Chapter 5 brings together the discussion in the previous two chapters and offers
         estimates of the funding gap
    •    Chapter 6 concludes by summarising the fiscal outlook.

Wales Fiscal Analysis │ Local government & the Welsh budget                                   8
2            Recent trends in local government finance

The 2010s marked a sustained period of restraint on public spending in the UK. These curbs on
spending hit government departments unevenly, with local authorities being
disproportionately subjected to steep spending cuts. As we shall see, even within local
authorities, some areas of spending fared better than others. In Wales, the burden has been
increasingly shifted onto Council Taxpayers to fund local authority services, though this only
partly offsets the reduction in central government support. These themes have been explored
in detail in our previous publications, so this chapter only offers a broad overview of the recent
trends in local government finance. 2 This sets the context for our projection of spending
pressures, revenues outlook and estimates of the funding gap over the next five years.

2.1. Funding revenue expenditure
Between 2009−10 and 2019−20, there was a marked change in the way local government
revenue expenditure was funded in Wales. Figure 2.1 documents how the value of government
grants fell by 16.8% in real terms over this period while Council Tax revenue increased from
£830 million to £1,369 million (a 39.3% increase in real terms). By the end of the decade, grant
funding financed less than 65% of gross revenue expenditure (down from nearly 73%), while
Council Tax financed more than a fifth (up from 14% a decade earlier).

Figure 2.1
Components of gross revenue expenditure (excl. housing benefits grant), 2009−10 to 2019−20 3

                                                                                                           Real %
 Funding source                   Measure                    2009−10        2019−10      % change          change
 Specific & general grants        £ million                     4,382          4,322          -1.4%         -16.8%
 (excl. HB)                       % of total revenue           72.8%          64.5%
 Council Tax (net of CTRS)        £ million                       830          1,369         65.0%           39.3%
                                  % of total revenue           13.8%          20.4%
 Non-domestic rates               £ million                       805          1,008         25.3%            5.8%
                                  % of total revenue           13.4%          15.0%
 Total                                                          6,017          6,698         11.3%           -6.0%

                             Source: WFA analysis of StatsWales (2019−20) Financing of gross revenue expenditure.

2 See, for example,Ifan and Siôn (2019a, 2019b).
3 Thecost of council tax benefit has been added to the Revenue Support Grant in years prior to its devolution. This
ensures consistency with the way the RSG-funded element of Council Tax Reduction Scheme is treated from
2013−14 onwards.

Wales Fiscal Analysis │ Local government & the Welsh budget                                                           9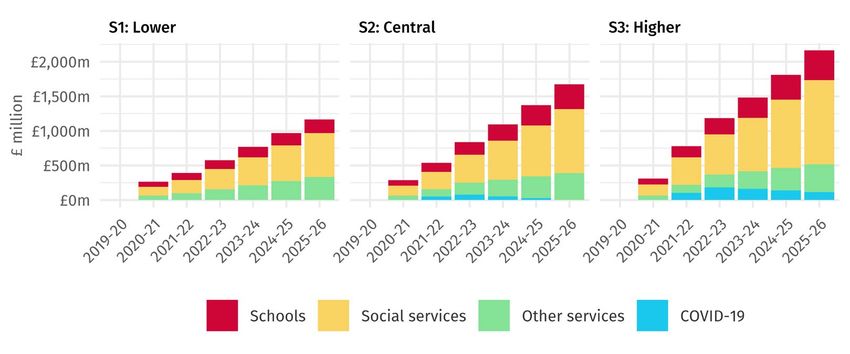
Overall, gross revenue expenditure fell by 6.0% in real terms over this period, directly impacting
the funds available to spend on local government services.

But although local authorities across the UK have seen a reduction in central government
funding, the policy response has differed. The Council Tax system has operated under an
effective cap in England following the introduction of a local referendum requirement for
‘excessive’ increases. In Scotland, a Council Tax freeze was followed by a 3% cap on annual
increases, which was only lifted in 2019−20 (it has been frozen again in 2021−22). In contrast,
the Welsh Government did not impose a formal cap on Council Tax levels. Many Welsh local
authorities responded by approving significant increases to Council Tax bills to mitigate some
of the spending cuts. This has meant that spending on local services has been relatively better
protected in Wales compared to other parts of the UK, but it has also meant that a larger share
of the tax burden has been shifted onto Council Taxpayers. 4

Figure 2.2 tracks the proportion of current government receipts collected through Council Tax
between 1999−00 and 2018−19. In Wales, Council Tax revenues grew from 3.5% of current
receipts to 5.4% in 2018−19. It now accounts for a significantly larger share of the total tax take
than the equivalent share in England (4.3%) and Scotland (3.8%). This trend pre-dates the onset
of the financial crisis, but unlike in England and Scotland where the trend appears to have been
halted by measures put in place to curb Council Tax increases, Council Tax levels have continued
to climb as a proportion of total receipts in Wales. Given the weak growth in earnings and
working-age benefits over the past decade, this effect is likely to have been more acutely felt
by households in more recent years.

Figure 2.2
Council Tax revenue as a share (%) of current receipts (excluding oil and gas revenues),
1999−00 to 2018−19

                          Source: WFA analysis of ONS (December 2019) Country and regional public sector finances.

4   See, Box 3.2 in GERW 2019 (Ifan, Siôn, and Poole 2019, 28).

Wales Fiscal Analysis │ Local government & the Welsh budget                                                    10
This is worth highlighting for several reasons; not only is local taxation a larger component of
the tax system than it was two decades ago, but it is well documented that the way Council Tax
operates is regressive (Adam et al. 2020). Similar households in different local authorities can
pay vastly different levels of tax for the same level of services. And even within local authorities,
Council Tax is regressive relative to its base: the more a dwelling is worth, the less is paid in tax
as a proportion to its value. Even though the Council Tax Reduction Scheme dulls the bluntness
of its application to poorer households, the overall effect remains regressive with respect to
income – Council Tax bills account for a relatively larger share of the disposable income of
poorer households. 5
2.2. Trends in revenue expenditure
Net current expenditure on services fell by 6.0% in real terms between 2009−10 and 2019−20
(Figure 2.3). 6 Adjusting for population growth, spending per head is 9.4% lower than it was a
decade ago.
Figure 2.3
Net current expenditure on local authority services, 2009−10 to 2019−20 7
Source: WFA analysis of StatsWales (2019−20 and previous) Local authority outturn tables. Excludes element
financed by the Housing Benefit grant.
These headline figures disguise the variation in the way cuts have impacted different local
authority services. As shown in Figure 2.4, social services and education spending have been
relatively better protected than other service areas, with planning departments across Wales
seeing real terms cuts of more than 50% over a 10-year period.
5 Further discussion on the operation of Council Tax in Wales can be found in (Ifan and Poole 2018).
6 The minor difference between the change in gross revenue expenditure and net current expenditure on services is
explained by trends in non-service expenditure.
7 The ‘current prices’ series is unadjusted for inflation.
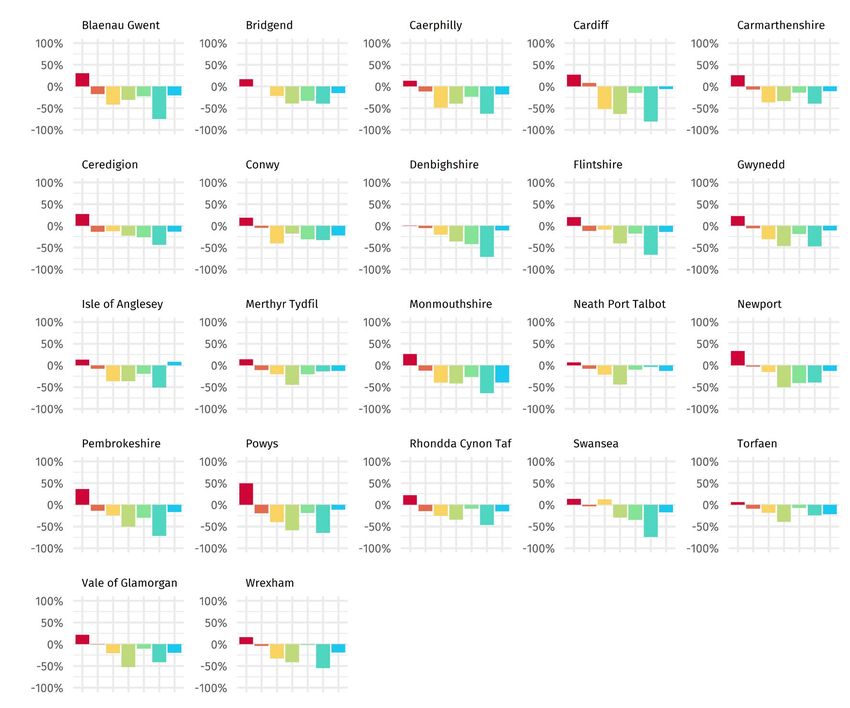
Wales Fiscal Analysis │ Local government & the Welsh budget 11Figure 2.4
Real terms percentage (%) change in net current service expenditure, 2009−10 to 2019−20
Source: WFA analysis of StatsWales (2019−20 and previous) Local authority outturn tables.
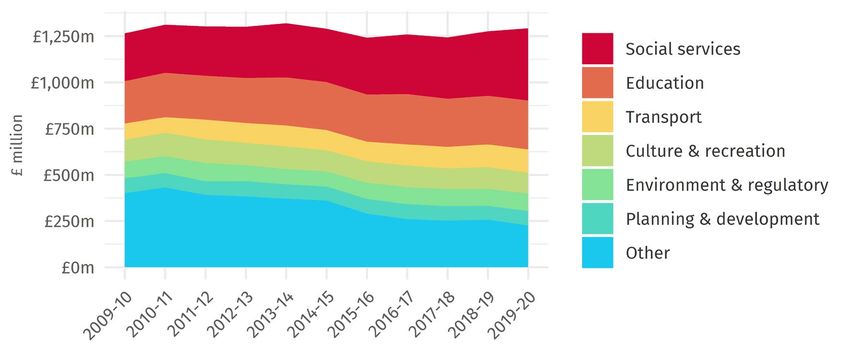
Wales Fiscal Analysis │ Local government & the Welsh budget 122.3. Other income (including fees & charges)
In addition to the revenue sources previously discussed, local authorities offset service
expenditure against other income – most of which is generated through fees and charges levies
on commercial activities. Total local authority income has remained broadly flat in cash terms
over the past decade (Figure 2.5), with a slight increase in income levied from social services
(mostly relating to the fees charged for older adult care).
Figure 2.5
Total income by service area, 2009−10 to 2019−20 (current prices)
Source: WFA analysis of StatsWales (2019−20 and previous) Local authority outturn tables.
2.4. The impact of COVID-19 on local authority budgets
The data presented in this chapter precedes the onset of the COVID-19 pandemic, which has
had a huge impact on both local government spending and financing. Additional costs and new
responsibilities combined with income losses from commercial activities to create a challenging
picture for local authorities. In Wales, these challenges have been largely met through
additional grant funding by the Welsh Government and the introduction of a Single Emergency
Hardship Fund, from which local authorities could submit claim for additional expenditure and
income losses incurred as a result of COVID-19.
More than £500 million worth of claims have been paid from this fund as of mid-March 2021,
and the overall value of COVID-19 support to local authorities in 2021−22 exceeds £1 billion.
The final local government settlement for 2021−22 included further allocations totalling £264
million to aid local authorities with their response to COVID-19 (Siôn 2021). But the medium-
term outlook is much less certain. In the next chapter, we evaluate the spending pressures that
are likely to arise over the next five-year period.
Wales Fiscal Analysis │ Local government & the Welsh budget 133 Spending pressures to 2025−26
This chapter presents estimates of local authority spending pressures over the next five years.
These estimates are underpinned by several assumptions about future costs and demand. By
adjusting these assumptions, we can delineate a range of plausible scenarios that track the
trajectory of spending pressures over the forecast period. A detailed description of the
methodology used can be found in Annex A of this report and the key assumptions made in
each scenario are summarised in Figure 3.1.
The core assumptions can be split into four categories – demand, productivity, earnings, and
COVID-19. We assume that demand for local government services is driven by the underlying
rate of population growth, as outlined in the ONS 2018-based population projections. These
demand projections are adjusted for the two largest areas of spending – schools and social
services – with school spending being driven by the pupil projections published by the Welsh
Government and demand for children and adult social services varying in each scenario (as set
out in Figure 3.1). Productivity refers to the rate at which unit costs grow relative to input costs,
or how the output for each unit of input changes over time. We assume zero productivity
growth for non-school spending in our central scenario and vary this assumption in our
alternative scenarios. We also make varying assumptions about earnings growth relative to the
OBR’s forecast for average earnings and the National Living Wage. Lastly, the scenarios are
adjusted to include assumptions about the scale and persistence of COVID-19 costs, and the
extent to which local authority income recovers its pre-pandemic level over the forecast period.
As we are primarily interested in the spending pressures that must be met from local authority
budgets; additional costs incurred (and income losses experienced) as a result of COVID-19
during 2020−21 and the first half of 2021−22 have been excluded from our analysis. Local
authorities will be compensated for most of these costs through claims submitted to the Welsh
Government’s Single Hardship Fund. According to current plans, as set out in the Welsh
Government’s Final Budget, this fund will be withdrawn at the end of September 2021,
therefore only COVID-19 costs incurred from September 2021 onwards are included in our
analysis (Welsh Government 2021, 4).
The three scenarios are labelled as follows:
• S1 Lower cost & demand pressures
• S2 Central cost & demand pressures
• S3 Higher cost & demand pressures
Wales Fiscal Analysis │ Local government & the Welsh budget 14Figure 3.1
Summary of key assumptions made in each spending pressures scenario*
S1 Demand
Lower cost & • Demand for adult social care services grows by 1% a year
demand pressures • Number of children looked after grows by 2% a year
Productivity
• Unit costs rise in line with input prices for services other than education; education sees 0.4%
growth in productivity each year
Earnings
• Pay freeze for all non-NLW staff in 2021−22
• Earnings grow at 50% of the OBR forecast for average earnings in future years; non-NLW
staff earnings grow in line with the NLW forecast
• Earnings for social care workers grow in line with average earnings, with adjustments for
NLW increases
COVID-19
• No COVID-19 costs beyond September 2021
• Local authority income recovers its pre-pandemic level by September 2021
S2 Demand
Central cost & • Demand for adult social care services grows by 2% a year
demand pressures • Number of children looked after grows by 4% a year
Productivity
• Unit costs rise in line with input prices for services other than education; education sees 0.2%
growth in productivity each year
Earnings
• No pay freeze in 2021−22, but the Chancellor’s decision indirectly impacts earnings growth
(non-NLW staff earnings grow by 1.0%)
• Earnings grow in line with the OBR forecast for average earnings in future years; non-NLW
staff earnings grow in line with the NLW forecast
• Earnings for social care workers grow in line with average earnings, with adjustments for
NLW increases
COVID-19
• 10% of COVID-19 costs continue beyond September 2021, reducing to zero by 2025−26
• Local authority income recovers 95% of its pre-pandemic level by September 2021, and fully
recovers by 2025−26
S3 Demand
Higher cost & • Demand for adult social care services grows by 3% a year
demand pressures • Number of children looked after grows by 6% a year
Productivity
• Unit costs rise in line with input prices for services other than social care; social care sees a
2.0% fall in productivity in 2021−22, recovering its pre-Covid level by 2025−26
Earnings
• No pay freeze in 2021−22 (non-NLW staff earnings grow by 2.4%)
• Earnings grow in line with the OBR forecast for average earnings in future years; non-NLW
staff earnings grow in line with the NLW forecast
• Real Living Wage introduced for social care workers in 2021−22; wages grow in line with
average earnings or the RLW (whichever is higher) thereafter
COVID-19
• 20% of COVID-19 costs continue beyond September 2021, reducing to 10% by 2025−26
• Local authority income recovers 90% of its pre-pandemic level by September 2021,
increasing to 95% of pre-pandemic levels by 2025−26
* Note: A detailed description of the methodology used can be found in Annex A.
Wales Fiscal Analysis │ Local government & the Welsh budget 153.1. Schools
Among local authorities’ key responsibilities is the provision of education to the resident
school-age population. In 2019−20, education spending accounted for more than 40% of local
authority gross expenditure on services. 8 Of the £3.1 billion spent on education services, £3.0
billion was classed as school-based expenditure, with the remainder spent on education-related
services provided in other settings, including adult and community education. In this section,
we focus solely on school-based expenditure.
Although schools were spared from some of the steepest cuts to spending between 2009−10
and 2018−19, levels of spending per full time equivalent learner still fell by 6% over this period
– roughly equivalent to the change in the block grant (Sibieta 2020, 25).
There is strong evidence in the academic literature on the link between school spending and
learner outcome, and that these effects may be compounded for learners from more
disadvantaged backgrounds (Sibieta 2020, 20). Given the amount of school-time lost because
of the pandemic, there is also an increased risk that the current school-age cohort will be at a
disadvantage compared to their older (and younger) counterparts. Based on an extensive
review of the international evidence, one academic paper found that a year of schooling
increases individuals’ earning by 8% per year, on average, in more economically developed
countries (Psacharopoulos and Patrinos 2018). This may strengthen policy-makers’ resolve to
increase school spending by an amount at least equal to underlying funding pressures over the
coming years.
Figure 3.2
Pupil population projections for local authority-maintained school, 2019−20 to 2025−26 9
Source: WFA analysis of StatsWales (2018-based) Pupil Projections.
8 Gross expenditure on services is presented net of the element financed by the Housing Benefit grant. See Annex
A for further detail.
9 Demand for school places in local authority-maintained schools is driven by the change in the school-age
population, adjusted to account for the proportion of the population educated in other settings.
Wales Fiscal Analysis │ Local government & the Welsh budget 16As illustrated in Figure 3.2, the pupil population in local authority-maintained schools is projected to fall by around 13,000 (3%) between 2019−10 and 2025−26; this has a significant dampening effect on spending pressures. 10 But even if overall demand for school places trails the underlying rate of population growth over the next five years, growth in earnings will continue to drive spending upwards. Employee costs account for roughly two-thirds of total spending on schools. Although education policy is devolved, responsibility for setting public sector pay in the sector does not neatly align with devolved responsibilities. The Welsh Government determines pay awards for the 27,000 teachers and associated professionals employed by local authorities based on recommendations made by the Independent Welsh Pay Review Body. But pay for school support staff, along with other local authority workers, is determined on an England-and-Wales basis (Ifan and Siôn 2020a). In theory, the UK Chancellor’s decision to freeze public sector pay in 2021−22 (with exceptions for those earning less than £24,000 a year) applies to school support staff in Wales. However, the final recommendation on pay awards will be made by the National Joint Council for Local Government Services – this decision may not be finalised until a few months into the new financial year. If the pay-determining body recommends a pay uplift in 2021−22, this cost will need to be met from local authority budgets. Figure 3.3 sets out the path of school employee costs in each of our spending scenarios. In our central scenario, we assume that the salaries of both teachers and support staff grow by 1.0% during the 2021−22 academic year and rise in line with average earnings thereafter. 11 This reflects the possibility that the Chancellor’s announcement may indirectly influence decisions on pay awards. We further assume that the starting threshold on the main pay range for teachers rises to £30,000 by 2023−24 (a year later than planned in England), and that growth in productivity averages 0.2% a year (in line with historic trends). In this scenario, total employee costs are projected to reach £2.26 billion by 2025−26, increasing by 1.6% in 2021−22 and 1.7% a year on average between 2022−23 and 2025−26. Our higher cost projection assumes that wages grow in line with average earnings from 2021−22 onwards, that the increase to the starting threshold of the main band is completed by 2022−23 (as originally planned), and zero productivity growth. This implies that staff costs are £57 million higher than our central projection at the forecast horizon, of which, £29 million is due to faster earnings growth in 2021−22 and £28 million is due to slower productivity growth. The lower projection assumes that earnings are frozen in cash terms in 2021−22, and that restraints on public sector pay continue. To model this, we assume that the wages of teachers and support staff that are not subject to the National Living Wage grow at half the rate of average earnings over the forecast period and that productivity growth outpaces historic trends, averaging 0.4% a year. 10 This reduction will not be uniformly felt across age cohorts (e.g. the secondary population is expected to grow). 11 This does not apply to staff that are otherwise subject to increases in the National Living Wage. Wales Fiscal Analysis │ Local government & the Welsh budget 17
Figure 3.3
Projection of school staff costs, 2019−20 to 2025−26

                                                        Source: WFA analysis. See Annex A for full methodology.

On our central projection, fully meting the spending pressures implies that total spending on
schools increases by 1.6% in 2021−22, and averages 1.8% a year thereafter (Figure 3.4). This is
only slightly faster than the rate of growth in school spending over the past decade (1.6%), but
the projected decline in the pupil projection implies that spending per learner will grow
considerably faster over the next five years. School spending will need to increase by £357
million between 2019−20 and 2025−26 (£197 million and £431 million in our lower and higher
cost scenarios, respectively).

However, these figures are subject to important caveats. An inbuilt assumption of our model is
that as demand for school places falls, this feeds through into a reduction in the size of the
workforce. This may not be desirable – or even plausible – given that the pupil-teacher ratio has
been rising over recent years (Ifan and Siôn 2020a, 34). On top of this, the demand for catch-up
tuition to compensate for lost learning is likely to require more rather than fewer school staff.
Maintaining – or even expanding – the size of the current workforce would entail higher levels
of spending than what is outlined in our central projection.

The final local government settlement for 2021−22 allocated £11.8 million towards an
Accelerated Learning Programme (on top of the £16.6 million already allocated in 2020−21).
Around half of this programme funding is targeted at disadvantaged pupils – a larger share than
in England and Scotland (20-30 per cent) (Sibieta and Cottell 2021, 28-30). A further £72 million
package to support learners was announced by the Welsh Government last month. 12 To put
these announcements in context, the cost of providing half a year of school education amounts
to £1.5 billion annually. Further allocations may be necessary to meet demand, and any future
costs associated with these “catch-up” programmes would be in addition to the pressures
quantified in our model.

12 See, https://gov.wales/extra-72m-support-learners-they-return-school

Wales Fiscal Analysis │ Local government & the Welsh budget                                                 18
Figure 3.4
Components of school spending pressures from 2019−20
£ million
Scenario Pressures 2019−20 2020−21 2021−22 2022−23 2023−24 2024−25 2025−26
S1 Teacher costs 0 34 52 53 57 61 64
(lower) Other staff costs 0 17 19 29 39 48 56
Non-staff costs 0 23 32 45 57 68 77
Total 0 74 103 127 153 176 197
S2 Teacher costs 0 36 65 84 106 132 164
(central) Other staff costs 0 18 25 40 54 70 85
Non-staff costs 0 25 38 58 74 92 108
Total 0 80 128 182 235 294 357
S3 Teacher costs 0 39 84 117 143 171 207
(higher) Other staff costs 0 19 32 49 64 81 98
Non-staff costs 0 27 46 68 87 107 125
Total 0 86 162 234 294 359 431
Figure 3.5
Gross expenditure on schools, with projections of spending pressures to 2025−26
Wales Fiscal Analysis │ Local government & the Welsh budget 193.2. Social services
Spending on social services accounts for a further £2.4 billion (32.8%) of local authority gross
revenue expenditure. Historically, this has been one of the largest sources of councils’ funding
pressures. Perhaps counterintuitively, the largest proportional increase in demand – and by
extension, spending – over the past decade has been on children and families’ services rather
than older adult care (Ifan and Siôn 2019b, 10). Of the three recorded spending categories –
care for older adults, younger adults, and children and families’ services, the latter category is
now the largest element of spending on social services. Figure 3.6 plots the rise in the number
of children looked after from 2003 to 2020. This follows a similar trajectory to overall levels of
spending on children and families’ services over the same period.
Figure 3.6
Number of children looked after, 2003 to 2020, with projections to 2025
Source: WFA analysis of StatsWales (2021) Children looked after at 31 March by local authority.
Between 2016 and 2020 alone, the number of children looked after rose by 27% to over 7,000.
The Commission on Justice in Wales (2019, 304) highlighted that in 2018, the rate of looked
after children in Wales was 102 per 10,000, compared with 64 per 10,000 in England. Several
factors contribute towards higher rates of looked after children in Wales, including the
relationship with deprivation, variations in the way local authorities and the judiciary deal with
individual cases, as well as the role of parenting capacity and resources (Hodges and Bristow
2019). And although the reasons behind the rising rates of children in care are complex, it is
nevertheless clear that future patterns will be a significant determinant of social services
spending pressures going forwards.
There is limited evidence to assess the impact of the COVID-19 crisis on demand for children
and families’ social care services. As a result, we do not incorporate any assumptions about a
COVID-induced shock to demand into our modelling. However, as noted by the Institute for
Fiscal Studies in their analysis of local government spending pressures in England, this presents
Wales Fiscal Analysis │ Local government & the Welsh budget 20a potential risk of further upwards pressure on spending (Ogden, Phillips, and Spiliotis 2020, 15). In the absence of more detailed modelling of the factors that influence the number of children in care, we assume that recent trends will continue in our central scenario, and that the number of children in care – a proxy for demand for children and families’ services – will grow by 4% a year on average over the forecast period. This figure is reduced to 2% in our lower scenario and increased to 6% in our higher scenario. Demand for older adult care can be expressed as a function of the number of people receiving formal care services and the average amount of care being delivered per person. A widely used model developed by Wittenberg et al. (2018) projects that demand for adult care services in England will increase by an average of 2.2% a year over the forecast period, significantly higher than projected population growth (0.5% a year). We adjust this projection slightly to reflect differences in the age profile of the Welsh population with respect to England. This implies that demand for care in Wales (which represents the total volume of formal care services delivered) grows by an average of 2.0% a year to 2025−26. This is adjusted by +/- 1 percentage point in our higher and lower cost scenarios, respectively. There are limitations to this approach, not least the fact that demographic pressures do not appear to have been the sole driver of demand for older adult care services in recent years (Siôn and Trickey 2020, 28-29). Moreover, the projection makes no assumption about a COVID- induced shock to demand or changes in preferences towards different types of care offerings. The growing prevalence of homeworking and the potential for increased wariness of care homes could both play a role in shifting the balance of care that is delivered formally and informally post-COVID. However, given the limited evidence on the long-term impact of the pandemic on attitudes towards adult care services, we have not incorporated any assumption about changing preferences into our model. Another factor driving costs of providing social services is the trend in productivity. Over the longer term, healthcare spending typically lags economy-wide measures of productivity (A. Charlesworth and Johnson 2018, vi). This phenomenon is referred to as the Baumol effect; the cost of inputs (including salary costs) rises in line with other jobs that have experienced faster growth in productivity, rather than rising in line with output in the healthcare sector, which grows more slowly. While there is some scope for improvements in productivity through better treatment and diagnosis, the delivery of care services changes less rapidly. Since social care services largely encompass the delivery of care, productivity gains are harder to find. Quality- adjusted estimates produced by the ONS show that the productivity of publicly funded social care services in England fell by an average of 0.4% a year over the last five years. 13 The gap between earnings growth and productivity is a key driver of spending. 13 Estimatesbased on ONS (2020) Public service productivity, adult social care, England: financial year ending 2019: https://www.ons.gov.uk/economy/economicoutputandproductivity/publicservicesproductivity/articles/publicservic eproductivityadultsocialcareengland/financialyearending2019 Wales Fiscal Analysis │ Local government & the Welsh budget 21
In our central and lower cost scenario, we assume zero productivity growth over the forecast
period – this would represent a marginal improvement on historic trends. Our higher cost
scenario assumes a 2% decrease in productivity in 2021−22 to reflect the possibility that
enhanced infection control measures could have a lasting impact on output in the medium
term. We assume that productivity recovers its pre-COVID level by 2025−26.

Since most care provision is outsourced, “staff costs” only capture the direct costs of the social
care workforce employed by local authorities. In our model, we assume that growth in earnings
feed into non-staff costs, which include payments to commissioned provides. In other words,
increases in labour costs for commissioned providers will be largely mirrored by larger
payments to those providers. The projection of non-staff costs is based on a weighted average
of earnings growth (70%) and inflation (30%), as measured by the smoothed GDP deflator
series.

Figure 3.7 presents an estimate of the earnings distribution for full-time social care workers in
Wales using data from the Annual Survey of Hours and Earnings (ASHE). Approximately a third
of the full-time social care workforce earned less than the Real Living Wage in 2020, though this
estimate is higher when looking at the sub-group of residential care workers and including part-
time employees in the calculation (Siôn and Trickey 2020, 23-24).

Figure 3.7
Distribution of hourly earnings for care workers in Wales, 2020

                                         Source: WFA analysis of ONS (2020) Annual Survey of Hours and Earnings.

Several political parties have made commitments to increase the salaries of care worker during
the next Senedd term. 14 To reflect this, our higher cost scenario assumes that the Real Living
Wage is introduced in 2021−22, with approximately a third of the workforce benefitting from
this policy, and that earnings then grow in line with the annual proportional increase to the
National Living Wage. Based on our own analysis of the ASHE data, we estimate that the cost
of implementing this policy would amount to £20 million in the first year and similar amounts

14   See, for example, https://www.bbc.co.uk/news/uk-wales-politics-56428352

Wales Fiscal Analysis │ Local government & the Welsh budget                                                  22
in each subsequent year. 15 Shortly prior to the publication of this report, more detailed
modelling by LE Wales using surveys of local authorities found that implementing the real living
wage for carers would cost approximately £19 million in the first year (Devnani et al. 2020, 121).
In our central scenario, we assume that earnings for non-NLW workers grow by 1.0% in 2021−22
and rise in line with average earnings thereafter. Our lower cost scenario assumes that wages
are frozen in 2021−22 and grow at half the pace of average earnings over the remainder of the
forecast period.
On central projections, total costs grow by 5.5% a year on average between 2021−22 and
2025−26 – broadly comparable to the average growth in spending between 2017−18 and
2019−20 (5.7%). Our lower and higher scenarios imply growth of 3.7% and 7.1% a year,
respectively. On higher estimates, local authority gross expenditure on social services could
exceed £3.5 billion by 2025−26 (Figure 3.8).
A breakdown of the projected spending pressures is provided in Figure 3.9. Children and
families’ services continue to be the largest driver of spending pressures, accounting for over
40% of the growth in spending over the forecast period.
However, unlike schools, demand for social services is much more difficult to predict. Any
changes to the way people access care post-COVID could have a significant impact on the
trajectory of spending pressures. These cost projections should therefore be interpreted
alongside the demand assumptions outlined in Figure 3.1. Nevertheless, the range of estimates
presented here strongly suggest that social services will continue to be the largest driver of local
authority spending pressures over the next five years.
Figure 3.8
Gross expenditure on social services, with projections of spending pressures to 2025−26
Source: WFA analysis. See Annex A for full methodology.
15This assumes that increased employee costs for commissioned providers are fully mirrored by increased
payments to those commissioned providers.
Wales Fiscal Analysis │ Local government & the Welsh budget 23Figure 3.9
Components of social services spending pressures from 2019−20
£ million
Scenario Pressures 2019−20 2020−21 2021−22 2022−23 2023−24 2024−25 2025−26
S1 Older adults 0 35 56 90 127 165 203
(lower) Younger adults 0 31 49 78 110 143 177
Family / children 0 59 86 124 166 209 254
Total 0 125 190 293 403 517 635
S2 Older adults 0 44 79 128 179 234 293
(central) Younger adults 0 39 68 111 155 204 255
Family / children 0 59 105 166 230 301 377
Total 0 142 252 404 564 738 926
S3 Older adults 0 54 132 188 247 311 380
(higher) Younger adults 0 47 115 164 215 271 331
Family / children 0 59 151 228 311 403 505
Total 0 160 398 580 773 986 1,216
3.3. Other local government services
When combined, spending on schools and social services account for over 70% of local authority
gross revenue expenditure on services. The rest is spent on the provision other local authority-
provided services (including transport, non-HRA council fund housing, non-school education
expenditure, environmental and regulatory services, planning, libraries, and other cultural
venues). Spending on several of these service areas has been scaled back significantly over the
past decade. We assume that the current level of service provision is maintained going
forwards.
In our model, changes in demand for these services is measured by headline estimates of
population growth. In other words, we assume that each resident is equally likely to access
these local government services. Slow population growth implies that demand grows by less
than 2% over the 6-year period between 2019−20 and 2025−26 (0.3% a year).
Wales Fiscal Analysis │ Local government & the Welsh budget 24We assume zero productivity growth in each of our scenarios. UK-wide estimates show that
productivity growth for government services has only averaged 0.14% over the last 5 years. 16
Given the scale of spending cuts to local government services over the last decade, it is
reasonable to assume that any capacity to make further operational savings without impacting
service provision is likely to be limited. Our assumptions about earnings mirror those made in
previous sections.
Figure 3.10 disaggregates the spending pressures by staff and non-staff costs. On our central
projection, non-schools, non-social services spending must grow by 2.0% in 2021−22, and
average 3.2% in subsequent years to ensure pressures are fully met. This is faster than the
growth in school spending pressures but slower than the growth in pressures for social services.
Figure 3.10
Components of spending pressures for local government services (excl. schools & social
services) from 2019−20
£ million
Scenario Pressures 2019−20 2020−21 2021−22 2022−23 2023−24 2024−25 2025−26
S1 Staff costs 0 30 42 68 95 122 149
(lower) Non-staff costs 0 35 56 88 120 151 183
Total 0 65 98 155 214 273 333
S2 Staff costs 0 30 47 78 111 146 183
(central) Non-staff costs 0 35 60 95 131 168 207
Total 0 65 106 173 241 314 389
S3 Staff costs 0 30 53 86 118 154 191
(higher) Non-staff costs 0 35 64 100 136 173 212
Total 0 65 118 186 254 327 403
Source: WFA analysis. See Annex A for full methodology.
16
Estimates based on ONS (2021) Labour productivity time series:
https://www.ons.gov.uk/employmentandlabourmarket/peopleinwork/labourproductivity/datasets/labourproductiv
ity
Wales Fiscal Analysis │ Local government & the Welsh budget 25In the context of spending cuts over the past decade, these scenarios all represent a complete
reversal of the historic trajectory (Figure 3.11). But even assuming that the pressures quantified
in our higher cost projection are met, spending on these local government services remains
below pre-austerity levels in 2025−26, and lower still having adjusted for inflation and
population growth.
Figure 3.11
Gross expenditure on local government services (excl. schools & social services), with
projections of spending pressures to 2025−26
Source: WFA analysis. See Annex A for full methodology.
3.4. Ongoing COVID-19 expenditure and income losses
So far, we have made no assumptions about additional costs and income losses incurred as a
result of COVID-19. Throughout 2020−21 and the first six months of 2021−22, local authorities
will be compensated for most of these additional costs through the Single Hardship Fund. But
there is considerable uncertainty about the scale of these pressures beyond September 2021.
There are several grounds for thinking that the impact of COVID-19 on local government
finance will extend beyond the expiration date for the Single Hardship Fund. Demand for
personal protective equipment is likely to continue for the near future, and larger payments to
commissioned residential care providers may be required to ‘shore up the sector’ in the wake
of reduced occupancy rates. 17 Enhanced infection control measures and a reluctance to resume
pre-COVID behaviours could mean that income from council-owned leisure and culture venues
are slower to recover. Commercial parking income may be permanently scarred, particularly if
the increase in homeworking and online retail patterns continue. However, unlike England,
local authorities in Wales are less reliant on income from commercial property investments –
therefore falling commercial rents are unlikely to make much of a dent in their income
17 According to data obtained by BBC Wales Live, in parts of Wales the number of care home residents has dropped
by 20% since February 2020: https://www.bbc.co.uk/news/uk-wales-56323779
Wales Fiscal Analysis │ Local government & the Welsh budget 26streams. 18 In practice, local authorities could opt to increase fees to offset any reduced income,
but this may not be possible for all services. 19
When modelling the continued effect of COVID-19 on local government finance, we consider
the extent to which income from commercial activities might recover its pre-pandemic level,
and the additional expenditure that will be necessary in future years as a proportion of the
amount claimed through the Single Hardship Fund in 2020−21. According to data provided by
the Welsh Local Government Association, £311 million has been paid from the Single Hardship
Fund to compensate local authorities for additional expenditure in 2020−21, and a further £190
million to offset income losses. These figures are correct as of March 21st, and we assume that
they broadly match the totals at the end of the financial year.
The assumptions made about COVID-19 expenditure and income losses in each scenario are
restated in Figure 3.12 below:
Figure 3.12
Summary of assumptions made in each scenario about COVID-19 expenditure and income
losses
S1 Expenditure
Lower cost & • No COVID-19 costs beyond September 2021
demand pressures Income
• Local authority income recovers its pre-pandemic level by September 2021 (when the Single
Hardship Fund is withdrawn)
S2 Expenditure
Central cost & • 10% of COVID-19 costs continue beyond September 2021, reducing to zero by 2025−26
demand pressures Income
• Local authority income recovers 95% of its pre-pandemic level by September 2021, and fully
recovers by 2025−26
S3 Expenditure
Higher cost & • 20% of COVID-19 costs continue beyond September 2021, reducing to 10% by 2025−26
demand pressures Income
• Local authority income recovers 90% its pre-pandemic level by September 2021, increasing
to 95% of its pre-pandemic levels by 2025−26
As set out in Figure 3.13, unfunded COVID-19 cost pressures total £50 million during the second
half of 2021−22, £77 million in 2022−23 and return to zero by 2025−26. In our higher cost
scenario, COVID-19 cost pressures peak at £183 million in 2022−23, reducing to £114 million at
the forecast horizon. On these assumptions, the effects of income losses are likely to dominate.
These projections should be interpreted with caution and in conjunction with the list of
18 See (Ogden, Phillips, and Spiliotis 2020, 38-39), for a discussion of how COVID-19 might impact commerical
property income for English local authorities.
19 For many services, local authorities are either prohibited from charging more than the cost of provision, or there
are nationally prescribed eligibility and charge levels in place and little or no local discretion on these levels.
Wales Fiscal Analysis │ Local government & the Welsh budget 27assumptions as there remains considerable uncertainty about the extent to which costs will
continue and income remains subdued from September 2021 onwards.
Figure 3.13
Components of unfunded COVID-19 pressures from 2019−20 †
£ million
Scenario Pressures 2019−20 2020−21 2021−22 2022−23 2023−24 2024−25 2025−26
S1 Expenditure 0 0 0 0 0 0 0
(lower) Income losses 0 0 0 0 0 0 0
Total 0 0 0 0 0 0 0
S2 Expenditure 0 0 16 23 16 8 0
(central) Income losses 0 0 34 54 37 19 0
Total 0 0 50 77 53 27 0
S3 Expenditure 0 0 31 54 47 39 31
(higher) Income losses 0 0 70 128 114 99 83
Total 0 0 102 183 161 138 114
† Assumes that pressures up to September 2021 are fully funded.
3.5. Summary of spending pressures
Having identified the spending pressures for each service area, we can now project the
cumulative spending pressures for local authorities over the next five years.
On central projections, meeting the cost pressures entails increasing gross expenditure on
services by an average of 3.4% a year between 2020−21 and 2025−26 (2.5% and 4.4% in our
lower and higher cost scenario, respectively). As outlined in Figure 3.14, social services are the
main driver of spending pressures. Schools face relatively smaller pressures due to a declining
school-age population and a better outlook for productivity compared to other local
government services.
Wales Fiscal Analysis │ Local government & the Welsh budget 28You can also read