1Q 2022 Key Business and Operational Updates - 20 April 2022 - Keppel REIT
←
→
Page content transcription
If your browser does not render page correctly, please read the page content below
1Q 2022
Key Business and
Operational Updates
20 April 2022
Outline
                                                                                                                                                                                                   Constituent of:
        ▪ 1Q 2022 Key Highlights                                                                                                                                                  3

        ▪ Financial & Portfolio Highlights                                                                                                                                        4                   FTSE ST Large &
                                                                                                                                                                                                       Mid Cap Index

        ▪ Market Review                                                                                                                                                          14

        ▪ Additional Information                                                                                                                                                 19                FTSE EPRA Nareit Global
                                                                                                                                                                                                      Developed Index
IMPORTANT NOTICE: The past performance of Keppel REIT is not necessarily indicative of its future performance. Certain statements made in this presentation may not be based on
historical information or facts and may be “forward-looking” statements due to a number of risks, uncertainties and assumptions. Representative examples of these factors include
(without limitation) general industry and economic conditions, interest rate trends, cost of capital and capital availability, competition from similar developments or shifts in expected
levels of property rental income, changes in operating expenses, including employee wages, benefits and training, property expenses and governmental and public policy changes, and
the continued availability of financing in the amounts and terms necessary to support future business.
                                                                                                                                                                                                          GPR 250
Prospective investors and unitholders of Keppel REIT (“Unitholders”) are cautioned not to place undue reliance on these forward-looking statements, which are based on the current                      Index Series
view of Keppel REIT Management Limited, as manager of Keppel REIT (the “Manager”) on future events. No representation or warranty, express or implied, is made as to, and no reliance
should be placed on, the fairness, accuracy, completeness or correctness of the information, or opinions contained in this presentation. None of the Manager, the trustee of Keppel REIT
or any of their respective advisors, representatives or agents shall have any responsibility or liability whatsoever (for negligence or otherwise) for any loss howsoever arising from any
use of this presentation or its contents or otherwise arising in connection with this presentation. The information set out herein may be subject to updating, completion, revision,
verification and amendment and such information may change materially. The value of units in Keppel REIT (“Units”) and the income derived from them may fall as well as rise. Units
are not obligations of, deposits in, or guaranteed by, the Manager or any of its affiliates. An investment in Units is subject to investment risks, including the possible loss of the principal
amount invested.
                                                                                                                                                                                                      MSCI Singapore
Investors have no right to request the Manager to redeem their Units while the Units are listed. It is intended that Unitholders may only deal in their Units through trading on Singapore            Small Cap Index
Exchange Securities Trading Limited (“SGX-ST”). Listing of the Units on SGX-ST does not guarantee a liquid market for the Units.

                                                                                                                                                                                                                       2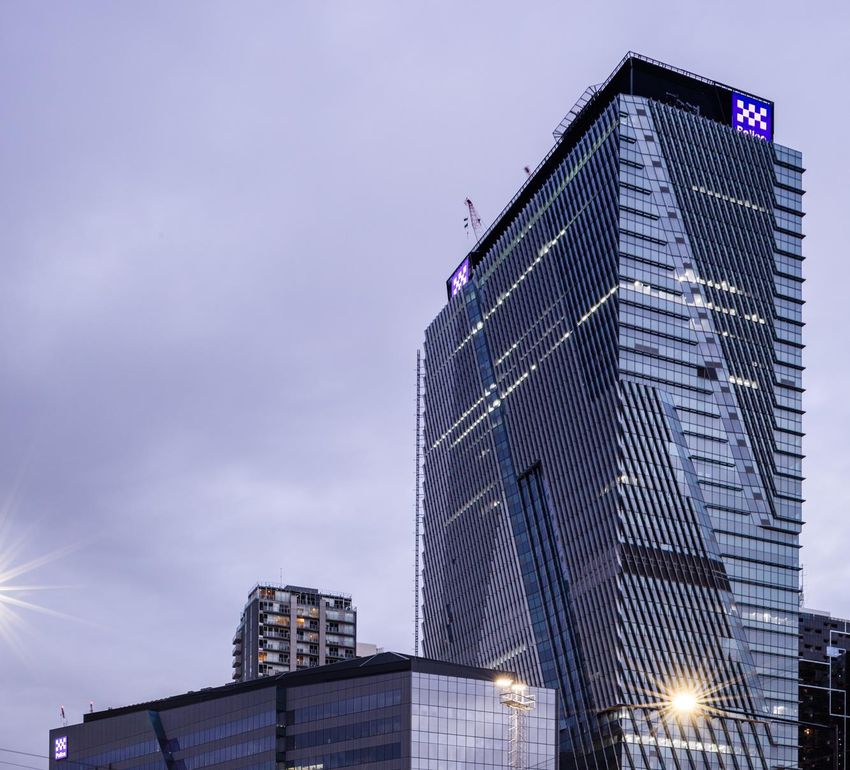
1Q 2022 Key Highlights

                                                                                                                                    Pan-Asian Portfolio with
                                                                                                                                      Income Resilience
 $53.8m                                                        95.1%                                                                     Anchored in key business districts of
 1Q 2022 distributable income                                  Portfolio committed occupancy
                                                                                                                                         Singapore, Australia and South Korea
 from operations(1)                                            as at 31 Mar 2022
 Up 4.3% y-o-y
                                                                                                                                                                                Singapore,
                                                                                                                                                                                  78.3%
 38.7%                                                         6.1 years
 Aggregate leverage
                                                               Long portfolio weighted average lease
                                                               expiry (WALE) as at 31 Mar 2022
                                                                                                                                                            $8.9b
 as at 31 Mar 2022                                             Top 10 tenants’ WALE was 10.7 years                                                      Grade A                       Australia,
                                                                                                                                                  commercial portfolio                 18.2%

 1.81% p.a.                                                    Certified Carbon                                                                    as at 31 Mar 2022

 All-in interest rate
 for 1Q 2022
                                                               Neutral                                                                                                            South Korea,
                                                               By Climate Active for Victoria Police                                                                                 3.5%
                                                               Centre in April 2022

                 (1)    Keppel REIT adopts half-yearly distributions and any distribution of capital gains for 1H 2022 will be disclosed at the 1H 2022 results announcement.          3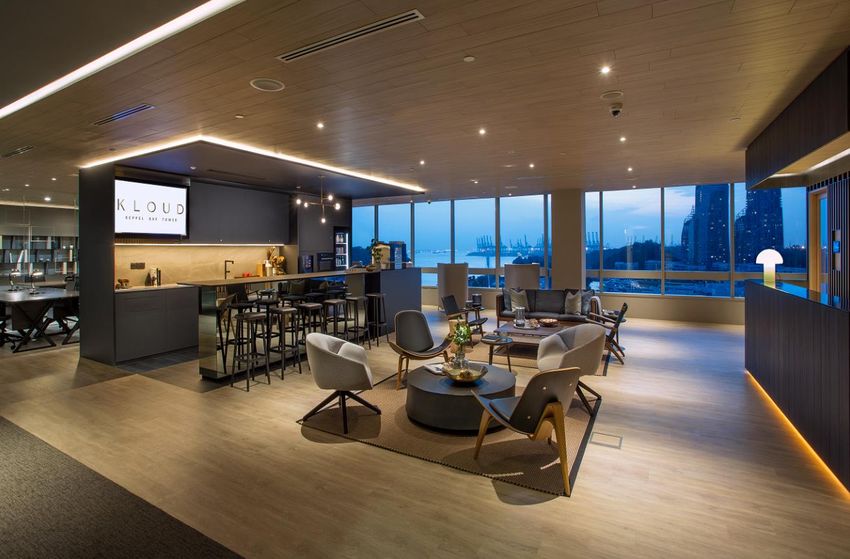
Financial &
Portfolio
Highlights

Pinnacle Office Park,
Sydney

                        4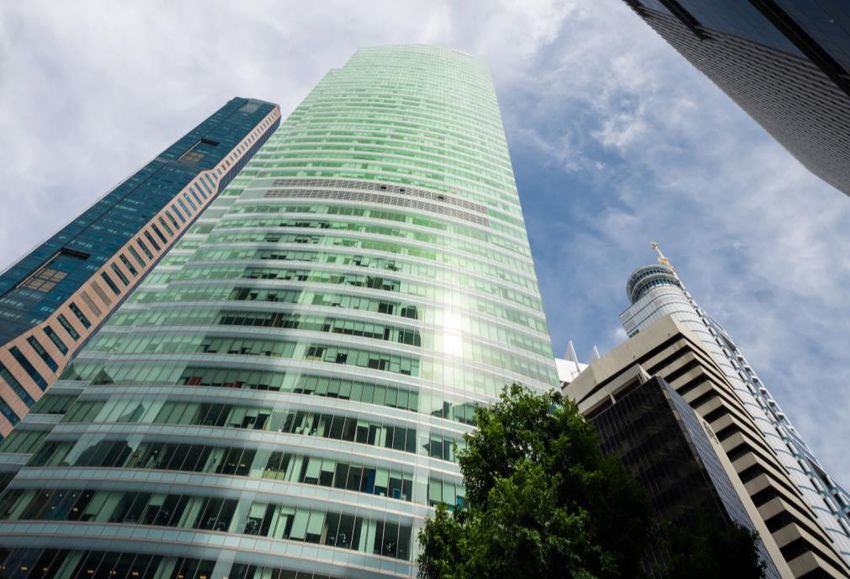
Higher Distributable Income from Operations
▪ Distributable income of $53.8 million, a 4.3% year-on-year growth due mainly to the acquisition of Keppel
  Bay Tower in May 2021
▪ The increase was partially offset by the impact of the divestment of 275 George Street in July 2021

   Distributable Income                                                                                                                       1Q 2022                 1Q 2021                    +/(-)
  from Operations ($m)
                                                 Property Income(1)                                                                            $54.5m                  $51.1m                  +6.7%
                +4.3%
                                                 Net Property Income (NPI)                                                                     $44.2m                 $40.7m                  +8.6%
                                                  Less: Attributable to Non-controlling Interests                                              ($4.2m)                ($4.3m)                 (2.3%)
                                                 NPI Attributable to Unitholders                                                               $40.0m                 $36.4m                  +9.9%
       51.6                53.8
                                                 Share of Results of Associates(2)                                                             $23.0m                  $24.9m                 (7.6%)

                                                 Share of Results of Joint Ventures(3)                                                           $5.8m                   $7.7m              (24.7%)
  1Q 2021                1Q 2022
                                                 Distributable Income from Operations                                                          $53.8m                  $51.6m                  +4.3%

 (1)    Property income relates to income from directly-held properties including Ocean Financial Centre, 50% interest in 8 Exhibition Street office building and 100% interest in the three adjacent
        retail units, 50% interest in Victoria Police Centre, Pinnacle Office Park, T Tower, Keppel Bay Tower after it was acquired on 18 May 2021 and 50% interest in 275 George Street before it
        was divested on 30 Jul 2021.
 (2)    Share of results of associates relates to Keppel REIT’s one-third interests in One Raffles Quay and Marina Bay Financial Centre.
 (3)    Share of results of joint ventures relates to Keppel REIT’s 50% interests in 8 Chifley Square and David Malcolm Justice Centre.                                                                  5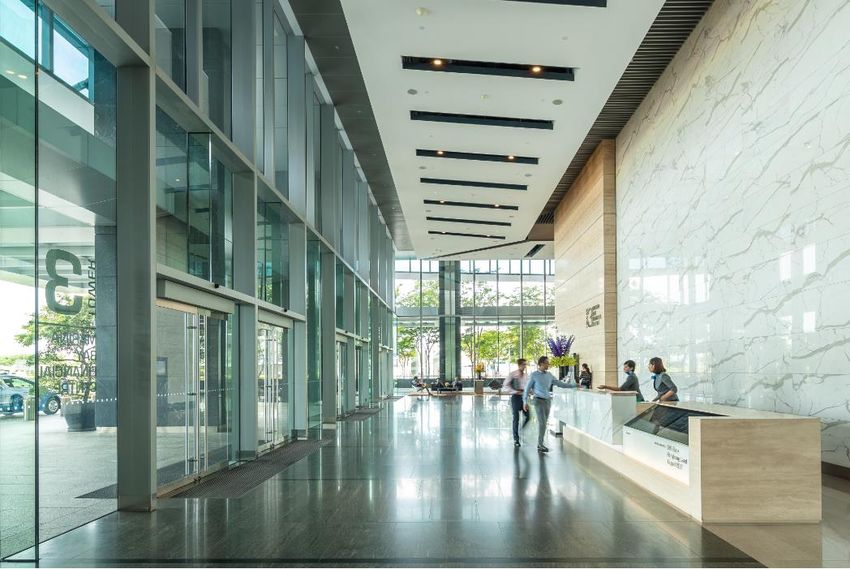
Prudent Capital Management                                                                                                                 As at 31 Mar 2022

                                                                                                            Adjusted NAV per Unit(2)                                       $1.29

 ▪ All-in interest rate reduced year-on-year to 1.81%                                                       Interest Coverage Ratio(3)                                      3.8x
   p.a. from 2.01% p.a.                                                                                     All-in Interest Rate                                        1.81% p.a.
 ▪ Total borrowings on fixed rates increased from                                                           Aggregate Leverage                                             38.7%
   63% to 71% during the quarter, to mitigate interest
                                                                                                            Weighted Average Term to Maturity                            3.1 years
   rate volatility
                                                                                                            Borrowings on Fixed Rates                                       71%
                                          (1)
 ▪ Approximately 48% of Keppel REIT’s total
                                                                                                                                                                     + 50 bps =
   borrowings are green loans                                                                               Sensitivity to Interest Rates    (4)
                                                                                                                                                              ~0.14 cents in DPU p.a.
                                                                                                                                                              or ~2.4%(5) in DPU p.a.
 ▪ On 11 April 2022, $146.5 million of the 1.90%
   convertible bonds due 2024 were redeemed. The                                                           Debt Maturity Profile (As at 31 Mar 2022)
   redemption was funded through loan facilities at                                                                                  23%
                                                                                                                                                   22%
   comparable interest rates, maturing mainly in                                                                            18%      $53m
                                                                                                                                     $75m
   2026 and 2027
                                                                                                                                                                           12%        11%
(1)   This includes Keppel REIT’s share of external borrowings accounted for at the level of associates.                                           $775m       8%
(2)   Excluded the distributable income for the period 1 Jan 2022 to 31 Mar 2022 to be paid in Aug 2022.
                                                                                                                6%          $641m   $685m                                            $150m
(3)   Computed as trailing 12 months EBITDA (excluding effects of any fair value changes of derivatives                                                                  $400m
      and investment properties, and foreign exchange translation), over trailing 12 months interest           $147m                                         $268m                   $245m
      expense, borrowing-related fees and distributions on hybrid securities.                                   $58m
(4)   Refers to changes to SOR/SORA/BBSW for applicable loans on floating rates.                                2022        2023     2024          2025       2026        2027        2028
(5)   Computed based on DPU of 5.82 cents for FY 2021.                                                         Bank loans                             $200m 5-year convertible bonds at 1.9%
                                                                                                                                                      (Issued in Apr 2019)
                                                                                                               $75m 7-year MTN at 3.275%              $150m 7-year MTN at 2.07%         6
                                                                                                               (Issued in Apr 2017)                   (Issued in Sep 2021)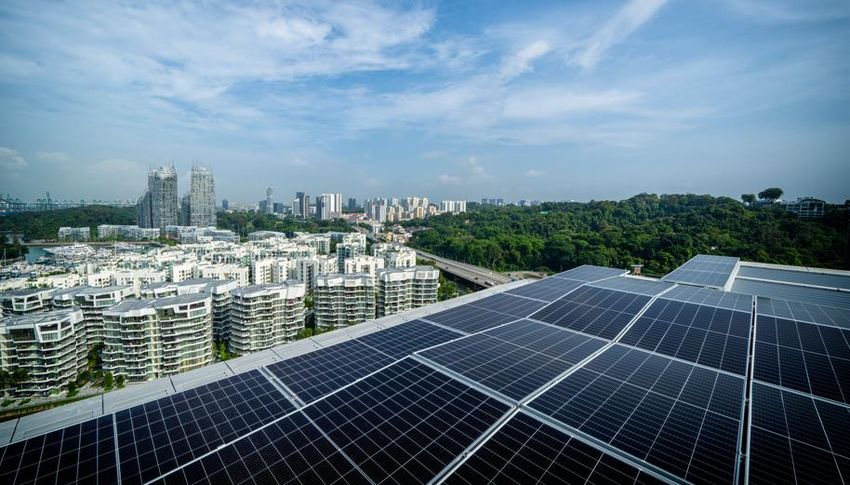
Diversified Pan-Asian Portfolio of Prime Commercial Assets
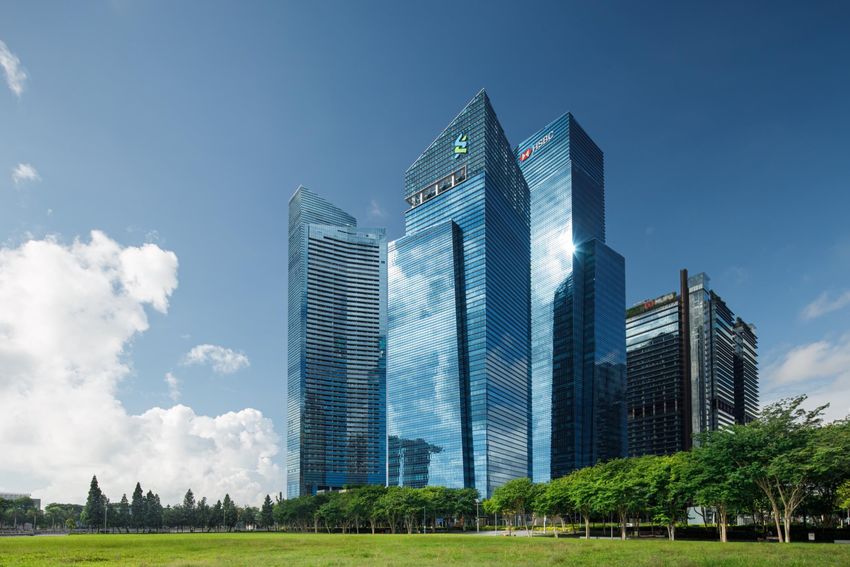
$8.9b portfolio of prime quality assets anchored across different markets enhance
income stability and long-term growth opportunities As at 31 Mar 2022:
T Tower, Seoul
8 Chifley Square,
99.4% Interest
Occupancy: 100% 95.1%
South Korea
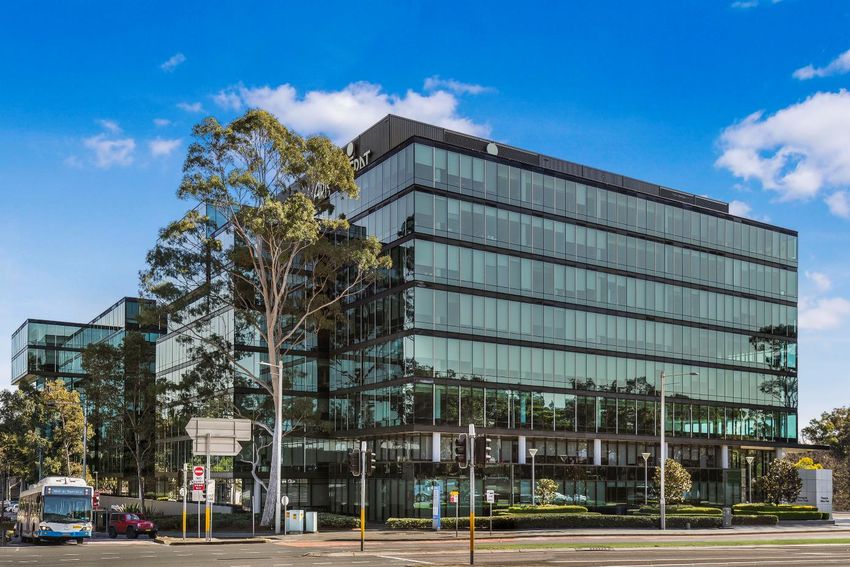
Pinnacle Office Park, Sydney Portfolio committed occupancy
Sydney 50% Interest
3.5%
100% Interest Occupancy: 68.6% Ocean Financial
Occupancy: 90.6% Centre
79.9% Interest
Occupancy: 94.2%
10.7 years
Blue & William,
Sydney Top 10 tenants’ WALE
100% Interest
(Under Development) Singapore Marina Bay
Financial Centre
8 Exhibition Street,
Melbourne
50% Interest
Australia
18.2% 78.3% 33.3% Interest
Occupancy: 95.9%
6.1 years
Portfolio WALE
Occupancy: 94.6% ▪ Singapore portfolio: 2.9 years
One Raffles Quay
33.3% Interest ▪ Australia portfolio: 13.3 years
Occupancy: 95.8% ▪ South Korea portfolio: 2.0 years
Victoria Police Centre, David Malcolm
Justice Centre, Keppel Bay
Melbourne
50% Interest Perth Tower
Occupancy: 100% 50% Interest 100% Interest
Occupancy: 100% Occupancy: 96.4%
Note: Information as of 31 Mar 2022. 7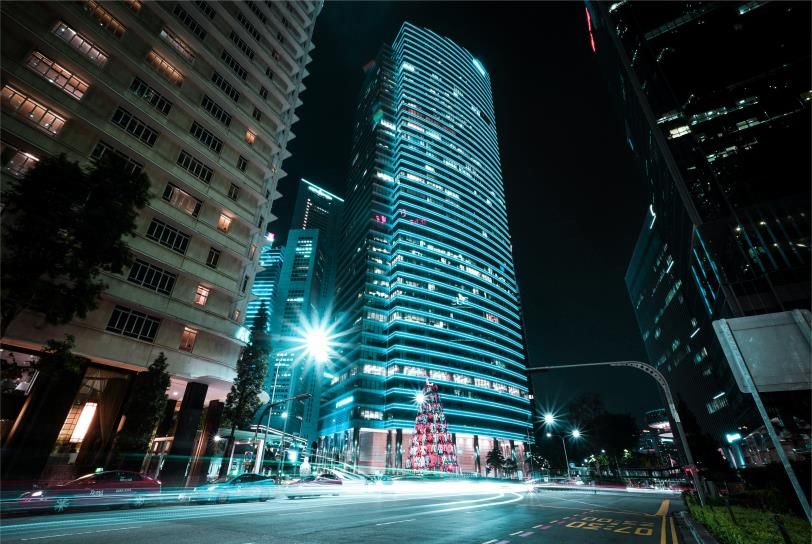
Robust 1Q 2022 Portfolio Performance
                                                                  Leases Committed                        Leases Committed
        Total Leases Committed                                     by Geography(1)                            by Type(1)

         ~475,000 sf                                                                                  Renewal,
       (Attributable ~222,500 sf)                         Singapore,                                   80.7%
                                                            99.0%
            Retention Rate

                91%                                                             Australia,
                                                                                  1.0%                                       New,
                                                                                                                             19.3%

                                                                                                 New leasing demand and expansions from:

▪ Rental collection remained healthy at 99% in 1Q 2022                                   Real estate and property services                 43.4%
                                                                                         Manufacturing and distribution                    23.1%
▪ Tenant relief measures of ~$0.2m were granted in 1Q                                    Banking, insurance and financial services         13.0%
  2022, to some ancillary retail tenants                                                 Accounting and consultancy services                8.9%
                                                                                         Technology, media and telecommunications           6.3%
                                                                                         Legal                                              4.3%
                                                                                         Retail and F&B                                     1.0%
              (1) Based on committed attributable area.                                                                                     8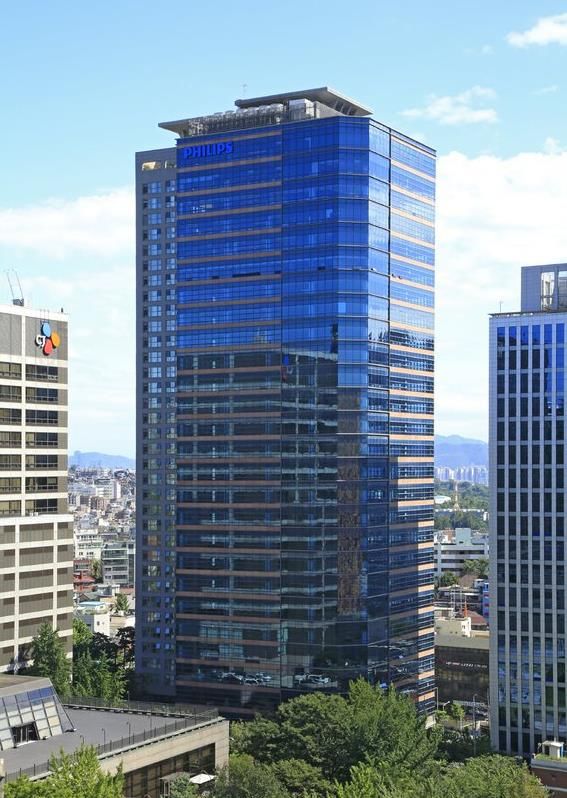
Well-spread Lease Expiry Profile
▪ Average signing rent for Singapore office leases(1) concluded in 1Q 2022 was $11.15 psf pm
▪ Average expiring rents of Singapore office leases(2)(psf pm): $10.10 in 2022, $10.84 in 2023 and $10.72 in 2024

 Lease Expiries and Rent Reviews(3)

   Expiring Leases
   Rent Review Leases

                                                                                          25.1%

                                                                        18.1%
                                    14.9%            14.1%
                 13.6%                                                                          13.1%
  9.3%

                         0.3%               0.3%             1.2%

    2022             2023              2024              2025              2026        2027 and beyond

                     (1) Weighted average for Ocean Financial Centre, Marina Bay Financial Centre and One Raffles Quay.
                     (2) Weighted average based on attributable NLA of office lease expiries and rent reviews in Ocean Financial Centre, Marina Bay Financial Centre and   9
                         One Raffles Quay.
                     (3) Based on committed attributable area.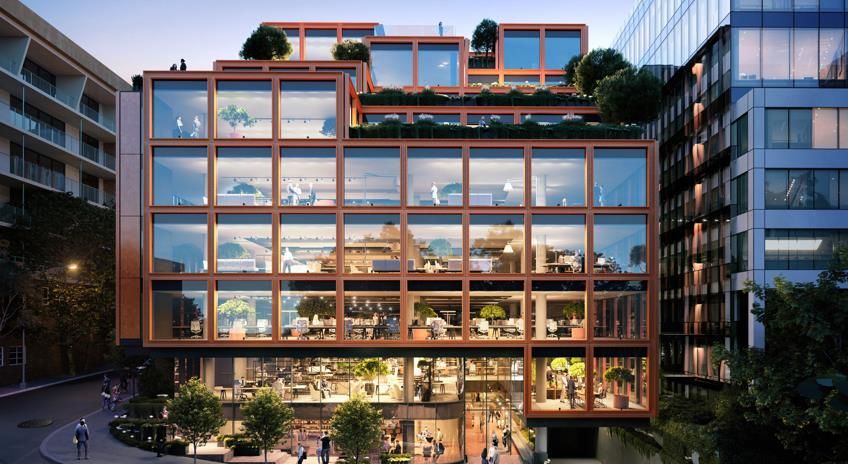
Established and Diversified Tenant Base
 ▪ Keppel REIT has a diversified tenant                                           ▪ Top 10 tenants take up 41.6% of NLA
   base of 383(1) tenants, many of which are                                        and contribute 36.8% of gross rent
   established blue-chip corporations
                                                                                                        Top 10 Tenants
  Tenant Business Sector                                       %
                                                                                    State of Victoria                                              10.2%
  Banking, insurance and financial services                  30.0%
                                                                                               DBS                           4.7%
  Government agency                                          15.2%
  Technology, media and telecommunications                   12.9%           Aristocrat Technologies                        4.4%
                                                                                     Government of
  Legal                                                       7.2%                           GOWA
                                                                                   Western Australia                    4.3%
                                                                                                                                    Victoria Police Centre
  Manufacturing and distribution                              6.8%                    Keppel Group                     4.0%         8 Exhibition Street
  Energy, natural resources, shipping and marine              6.7%                                                                  Marina Bay
  Real estate and property services                           6.4%              Standard Chartered                   3.5%           Financial Centre
                                                                                                                                    Pinnacle Office Park
  Accounting and consultancy services                         5.3%                   Ernst & Young                   3.3%
                                                                                                                                    David Malcolm
  Services                                                    4.0%                     BNP Paribas                   3.3%           Justice Centre

  Retail and food & beverage                                  2.6%                                                                  Keppel Bay Tower
                                                                                     Drew & Napier            2.0%
  Others                                                      2.9%                                                                  One Raffles Quay

                                                                                                             1.9%                   Ocean Financial Centre
  Total                                                      100%                    Deutsche Bank

                  Note: All data as at 31 Mar 2022 and based on portfolio committed NLA.
                  (1) Tenants with multiple leases were accounted as one tenant.                                                                             10
ESG Benchmarks
Sustainable Portfolio ▪ MSCI ESG – ‘A’ Rating
▪ ISS ESG Corporate Rating – Prime status
with ESG Excellence ▪ Global Real Estate Sustainability Benchmark (GRESB)
– Green Star status; ‘A’ rating for Public Disclosure
Supporting climate action and the transition ESG Indices
to a low-carbon future with Keppel REIT’s
▪ iEdge SG ESG Transparency Index and ESG Leaders Index
portfolio including Keppel Bay Tower and
Blue & William ▪ iEdge-UOB APAC Yield Focus Green REIT Index
▪ Morningstar Singapore REIT Yield Focus Index
▪ Solactive CarbonCare Asia Pacific Green REIT Index
Green Credentials and Green Financing
▪ 9 out of 11 Keppel REIT’s properties are green certified. T Tower is targeting
green certification in 2022 while Blue & William is under development
▪ All Singapore office assets have maintained BCA Green Mark Platinum
▪ 5 Stars and above in the NABERS Energy rating for majority of the
operational Australian assets
▪ Fully powered by renewable energy: Keppel Bay Tower, 8 Exhibition Street
and Victoria Police Centre
▪ Carbon neutral: 8 Exhibition Street and Victoria Police Centre (certified in
Artist’s April 2022)
Impression
▪ Approximately 48% of Keppel REIT’s total borrowings are green loans
11ESG Targets
Environmental Stewardship Responsible Business People and Community
▪ Halve Scope 1 and 2 emissions by 2030 ▪ Uphold high standards of corporate ▪ Provide a safe and healthy workplace
from 2019 levels governance and risk management ▪ Invest in developing and training its people
▪ Reduce energy and water usage ▪ Attain green certification for all ▪ Uplift communities wherever it operates
▪ Increase renewable energy usage properties by 2023
▪ Maintain approximately 30% of female
▪ Increase waste recycling rate ▪ Increase sustainability-focused directors on the Board
funding to 50% by 2025
Photo Credit: PUB
In support of PUB’s “City Turns Blue” initiative, Ocean Financial Sustainability credentials and potential for enhancement are Safety and wellbeing are key considerations
Centre was lit blue to celebrate World Water Day 2022 taken into consideration in investment decisions in building a safe and healthy workplace
12Meeting Diverse Tenant Needs
Robust portfolio of Grade A office properties that caters to tenants’ diverse business needs
Quality Workplaces with Fitted/Flexible
Strong ESG Focus Solutions
Grade A office buildings that are well managed with Providing greater tenant flexibility
sustainable and technologically-advanced features with fully fitted out spaces
and/or flexible space operators
in Keppel REIT’s portfolio
Hub-and-Spoke
Business Model
Offering alternatives to tenants
seeking cost-effective solutions
or dual locations for business
continuity purposes
13Market
Review
Marina Bay Financial Centre,
Singapore
14Singapore Office Market
▪ Average core CBD Grade A office rents increased to $10.95 psf pm in 1Q 2022 and average occupancy in
core CBD increased to 93.8%
Grade A Rent and Core CBD Occupancy Demand and Supply
2.1 1.9 1.7
1.3
95.8% 94.8% 95.8% 0.8 0.8 0.9 0.8
$15 93.8% 93.8% 93.3% 93.8% 100% 0.4 0.7 0.5 0.6
0.3 0.2
$11.55 2016 2017 2018 2019 2020 2021 2022 2023 2024
$12 $10.80 $10.80 $10.95 80%
$10.40 -0.8
$9.10 $9.40
$9 60% Net Supply(1) Net Demand (1) Forecast Supply (2)
$6 40% Key Upcoming Supply in CBD(2) sf
Guoco Midtown 709,100
$3 20% 2022
Hub Synergy Point Redevelopment 131,200
2023 IOI Central Boulevard Towers 1,258,000
$0 0%
Dec 2016 Dec 2017 Dec 2018 Dec 2019 Dec 2020 Dec 2021 Mar 2022 333 North Bridge Road 40,000
2024
Keppel Towers Redevelopment 526,100
Average Grade A Rent ($ psf pm)
Core CBD Average Occupancy (%)
(1) Based on URA data as at 4Q 2021, on historical net demand and supply of office space in
Source: CBRE, 1Q 2022. Downtown Core and Rest of Central Area. Supply is calculated as net change of stock over the
year and may include office stock removed from market due to demolitions or change of use.
(2) Based on CBRE data on CBD Core and CBD Fringe.
15Australia Office Market
94.9% 96.0% 95.2%
91.3% 87.5% 88.6% 88.4% 100% 90.8% 92.1% 90.4% 89.9% 100%
75.5% 79.9% 82.7%
1,200 1,032 1,045 1200
964 80% 80%
Sydney CBD 900 799
930 885 891
60%
North Sydney 900 729 60%
641 676 688 651 662
580
600 40% 600 40%
Prime Grade occupancy
300 20% Prime Grade occupancy300 20%
decreased to 88.4% 0 0% increased to 82.7% 0 0%
4Q16 4Q17 4Q18 4Q19 4Q20 4Q21 1Q22 4Q16 4Q17 4Q18 4Q19 4Q20 4Q21 1Q22
Prime Gross Effective Rent (AUD psm/year) Prime Gross Effective Rent (AUD psm/year)
Prime Grade Occupancy (%) Prime Grade Occupancy (%)
94.0% 97.0% 98.2%
94.3% 93.7% 93.6% 94.7% 92.1% 86.2% 100%
89.6% 84.7% 84.7%
88.8% 88.3% 100% 1,200
80%
Macquarie Park
1,200
80% Melbourne CBD 900 60%
900 60% 573
600 503 538 546 516 519
448 40%
600 40%
Prime Grade occupancy
300
321 344 367 391 378 379 379 Prime Grade occupancy
300 20%
20%
decreased to 88.3% 0 0%
maintained at 84.7% 0 0%
4Q16 4Q17 4Q18 4Q19 4Q20 4Q21 1Q22
4Q16 4Q17 4Q18 4Q19 4Q20 4Q21 1Q22
Prime Gross Effective Rent (AUD psm/year) Prime Gross Effective Rent (AUD psm/year)
Prime Grade Occupancy (%) Prime Grade Occupancy (%)
84.0% 86.5% 84.3% 86.0% 84.6% 100%
77.7% 81.4%
1,200
80%
Perth CBD 900 60%
600 431 435 447 453 444 447 448 40%
Prime Grade occupancy
300 20%
decreased to 84.6% 0 0%
4Q16 4Q17 4Q18 4Q19 4Q20 4Q21 1Q22
Prime Gross Effective Rent (AUD psm/year)
Prime Grade Occupancy (%)
Source: JLL Research, 1Q 2022. 16Seoul Office Market
▪ CBD Grade A occupancy increased to 91.2% in 1Q 2022
CBD Grade A Rent and Occupancy
200,000 91.2% 100%
90.7% 89.2%
85.0% 86.6% 86.7%
82.7%
160,000 80%
120,000 60%
97,572 98,926 101,276
95,169 91,845 92,325 91,656
80,000 40%
40,000 20%
0 0%
4Q16 4Q17 4Q18 4Q19 4Q20 4Q21 1Q22
CBD Grade A Net Effective Rent (KRW per py pm) CBD Grade A Occupancy (%)
Source: JLL Research, 1Q 2022. 17Committed to Delivering Stable Income & Sustainable Returns
Portfolio Optimisation
• Portfolio optimisation to improve yield, anchored by prime CBD assets in
Singapore Portfolio
• Hold quality assets across different markets for improved income stability Optimisation
and to provide more long-term growth opportunities
Asset Performance Asset
Performance
• Drive individual asset performance with proactive leasing and
cost management strategies
• Implement initiatives to future proof assets and enhance sustainability
Capital
Capital Efficiency Efficiency
• Optimise capital structure to reduce borrowing costs and improve returns
• Manage debt maturities and hedging profiles to reduce risk
18Additional
Information
Keppel Bay Tower,
Singapore
19Portfolio Information: Singapore
As at Marina Bay
Ocean Financial Centre One Raffles Quay Keppel Bay Tower
31 Mar 2022 Financial Centre(4)
Attributable NLA 698,312 sf 1,022,508 sf 441,102 sf 386,223 sf
Ownership 79.9% 33.3% 33.3% 100.0%
BNP Paribas, DBS Bank, Deutsche Bank, Keppel Group,
Principal
Drew & Napier, Standard Chartered Bank, Ernst & Young, BMW Asia,
tenants(1)
The Executive Centre HSBC TikTok Pacific Refreshments
99 years expiring
99 years expiring 99 years expiring 99 years expiring
Tenure 10 Oct 2104(5) and
13 Dec 2110 12 Jun 2100 30 Sep 2096
7 Mar 2106(6)
Purchase price S$1,426.8m(5)
S$1,838.6m(3) S$941.5m S$657.2m
(on acquisition) S$1,248.0m(6)
S$1,683.3m(5)
Valuation(2) S$2,066.2m S$1,250.0m S$674.7m
S$1,265.3m(6)
Capitalisation 3.45%(7); 3.63%(6);
3.50% 3.45% 3.55%
rates 4.25%(8)
1) On committed gross rent basis.
2) Valuation as at 31 Dec 2021 based on Keppel REIT’s interest in the respective properties.
3) Based on Keppel REIT’s 79.9% of the historical purchase price.
4) Comprises Marina Bay Financial Centre (MBFC) Towers 1, 2 and 3 and Marina Bay Link Mall (MBLM).
5) Refers to MBFC Towers 1 and 2 and MBLM.
6) Refers to MBFC Tower 3. 20
7) Refers to MBFC Towers 1 and 2.
8) Refers to MBLM.Portfolio Information: Australia & South Korea
Blue & William(3),
As at 8 Exhibition Victoria Police David Malcolm
8 Chifley Square, Pinnacle Office Sydney T Tower,
31 Mar 2022 Street(4), Centre, Justice Centre,
Sydney Park, Sydney (Under Seoul
Melbourne Melbourne Perth
Development)
Attributable
104,055 sf 375,640 sf 152,666 sf 244,490 sf 364,180 sf 167,784 sf 226,949 sf
NLA
Ownership 50.0% 100.0% 100.0% 50.0% 50.0% 50.0% 99.4%
Corrs Chambers Aristocrat Ernst & Young, Minister for Hankook
Westgarth, Technologies, Pending Amazon, Minister for Works -
Principal Corporation,
QBE Insurance, Konica Minolta, Practical Minister for Finance - State Government of
tenants(1) Philips Korea, SK
Berkshire Coles Completion Finance - State of Victoria Western
Hathaway Supermarkets of Victoria Australia Communications
99 years
99 years expiring
Tenure Freehold Freehold Freehold Freehold expiring Freehold
5 Apr 2105
30 Aug 2114
Purchase price A$165.0m A$306.0m A$327.7m A$168.8m A$347.8m A$165.0m KRW252.6b
(on acquisition) S$197.8m S$289.9m S$322.2m S$201.3m(4) S$350.1m S$208.1m S$292.0m
A$234.5m A$310.0m A$166.8m(3) A$294.4m A$405.0m A$237.5m KRW272.0b
Valuation(2)
S$228.5m S$302.1m S$162.5m S$286.9m(4) S$394.7m S$231.4m S$313.1m
Capitalisation
4.63% 5.13% 4.50% 5.00%(5) 4.38% 5.38% 3.80%
rates
1) On committed gross rent basis.
2) Valuation as at 31 Dec 2021 based on Keppel REIT’s interest in the respective properties and the exchange rates of A$1 = S$0.9745 and KRW 1,000 = S$1.151.
3) Under development and based on “as-is” valuation as at 31 Dec 2021. 21
4) Keppel REIT owns a 50% interest in the 8 Exhibition Street office building and a 100% interest in the three adjacent retail units.
5) Refers to Keppel REIT’s 50% interest in the office building and 100% interest in the three adjacent retail units.Thank You
For more information, please visit:
www.keppelreit.com
Connect with us on:
Victoria Police Centre,
Melbourne
22You can also read