1H22 Results 23 February 2022 - AFR
←
→
Page content transcription
If your browser does not render page correctly, please read the page content below
1H22 Results
23 February 2022

                   M_Park, Macquarie, NSW
We acknowledge the Traditional
Custodians of the land on which we
meet, work and live. We pay our
respects to First Nation Elders past,
present and emerging and the care
they have given this country.
Stockland is committed to supporting
organisations and individual Aboriginal
and Torres Strait Islander people

Artwork created by Maurice Mickelo

                                          2
Agenda

Group update            Tarun Gupta
                        Managing Director & CEO

Financial results and   Alison Harrop
                        CFO
capital management

Commercial              Louise Mason
                        CEO, Commercial Property
Property

Communities             Andrew Whitson
                        CEO, Communities

Summary and             Tarun Gupta
                        Managing Director & CEO
Outlook

                                                                         3
                                                   Coopers Paddock, NW
4
Artist impression, Affinity Place, North Sydney, NSW       4
Group update
Tarun Gupta

                                                5
               Artist impression, Whiteman Edge, WA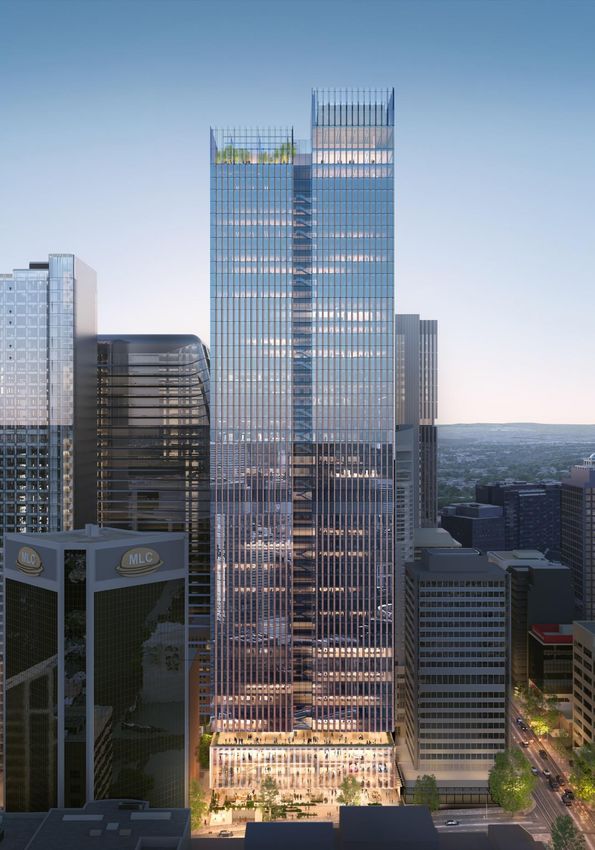
Executing our strategy

                                FY22 Guidance Range                  Divestment of Retirement
                                Tightened                            Living business broadly in
                                To 35.1-35.6 cents                   line with book value
                                                                     Dynamically reshaping our
                                                                     business

                                Land Lease Communities               M_Park
                                Capital Partnership with             Capital Partnership with
Halcyon Greens, QLD             Mitsubishi Estate Asia               Ivanhoé Cambridge
                                Established partnership with high-   Established partnership with leading
                                quality institutional partner        global real estate investor

        We believe there is a   Accretion in
                                FY23
                                                                     ~$2.5bn
                                                                     Pro-forma liquidity
         better way to live     Contracted FFO from post-balance
                                date transactions forecast to be
                                                                     Materially strengthened post
                                                                     transactions vs $1.3bn in 1H22
                                accretive to FY23                                                           6
Key transactions
Partnerships with high-quality, globally recognised
institutional capital to drive future earnings growth
Stockland Residential Rental Partnership1
with Mitsubishi Estate Asia
• Accelerates returns from secured land bank,
creating ongoing development margins and high
quality recurring income Transactions accelerate strategy whilst strengthening
Artist impression, Pickleball at Halcyon Greens, QLD
• Provides significant opportunity to scale platform the balance sheet and enhancing FY23 FFO
toward market leading position
• The transactions are forecast to be accretive, while
M_Park Capital Partnership1 reducing gearing by ~7% on a pro-forma basis,
with Ivanhoé Cambridge ahead of capital redeployment
• Leveraging asset creation strengths to provide
high quality recurring rental and management • These transactions refocus our business, leveraging
income
asset creation strengths to drive earnings growth
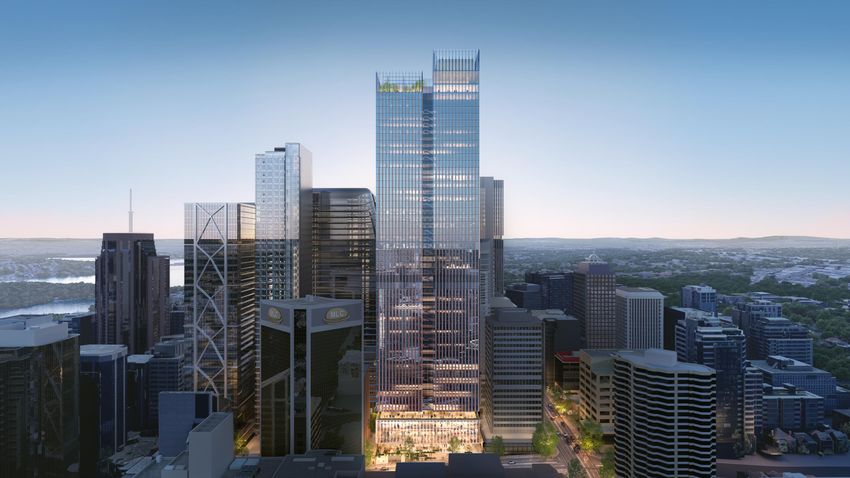
Artist impression, M_Park, Macquarie Park, NSW
• Next-gen, modern workplaces focused on
collaboration, innovation and sustainability
• Progressive activation of the existing development
pipeline will see gearing within the 20-30% target
Retirement Living divestment broadly range by FY23+
in line with book value1
• Delivered on strategy to reduce allocation to
Retirement Living
• Dynamically reshapes the portfolio and provides
Newport, QLD
capital for implementation of strategic growth
priorities
1. Post 31 December 2021 balance date. Transactions exchanged, with completion conditional on FIRB approval. 7
2. Affinity Village (WA) to be sold down via a separate disposal process and other items outside the transaction perimeter .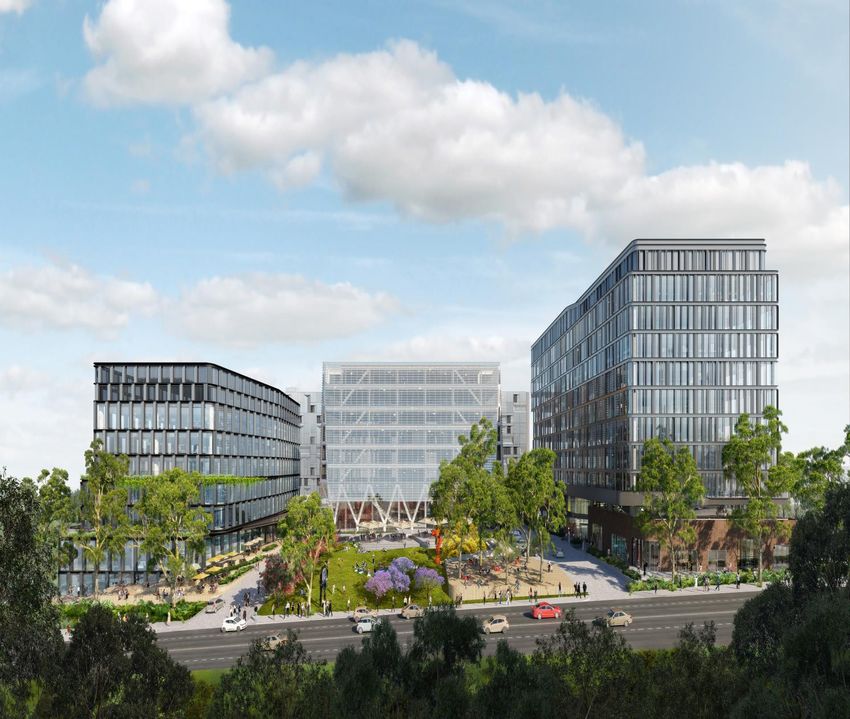
Group strategic priorities
Executing our strategic priorities and generating sustainable long-term growth

     Reshape portfolio                                          Accelerate pipeline                                                  Scale partnerships                                                          Sustainable growth
• Extended Residential leadership                        • ~$37bn2 development pipeline across                                • High quality capital partnerships                                            • Delivering on our purpose “We believe
                                                           Commercial Property and Communities                                  established to scale platform, improve                                         there is a better way to live”
   • Contracts on hand of 6,436 up 30%
                                                         • ~$1.6bn3 of Logistics & Workplace                                    returns and drive earnings growth
     vs FY21                                                                                                                                                                                                 • Achieving high quality recurring
                                                           pipeline underway                                                       • Stockland Residential Rental                                              income business with sustainable
   • Strong embedded margins across
                                                             • Lodged 5 DAs representing $370m3                                      Partnership5 with Mitsubishi Estate                                       growth
     well-located landbank
                                                                                                                                     Asia
                                                             • Logistics development increased to                                                                                                            • Implementing ROIC discipline, with
• Halcyon acquisition performing ahead
                                                               ~$400m p.a. from ~$150m p.a.4                                       • M_Park Capital Partnership5 with                                          Target Recurring ROIC of 6-9% and
  of expectations
                                                                                                                                     Ivanhoé Cambridge over Stage 1 of                                         Development ROIC of 14-18%6
• Land Lease Communities platform and                    • Strategic acquisitions enhancing                                          the $2bn M_Park precinct
                                                           Communities pipeline:                                                                                                                             • Delivering customer excellence
  capabilities attracting high quality
                                                                                                                                   • Long-term partnership to deliver a                                        through enterprise-wide capabilities in
  capital partner                                            • Residential landbank extending to                                     mixed use precinct with Western                                           digital innovation and ESG
• Divestment of Retirement Living                              ~82,000 lots                                                          Sydney University5
  Business broadly in line with book value                   • Land Lease Communities total                                   • Unlocking development margins and
• Executed on   ~$310m1   of non-core asset                    portfolio growing to ~9,000 home                                 recurring management fees
  disposals                                                    sites
                                                                                                                              • Further accelerating development
                                                         • Optimising landbank through                                          pipeline while maintaining a strong
                                                           masterplanning                                                       balance sheet

                            1.   Includes disposal of Bundaberg, QLD, Townsville Nathan Street, QLD, and asset held for sale Cairns, QLD.
                            2.   Total development pipeline, includes projects in early planning stages, projects with planning approval and projects under construction.
                            3.   Forecast end value on completion.
                            4.   Forecast end value over a 5-year average in comparison to historical 5-year average.
                            5.   Post 31 December 2021 balance date. Transactions exchanged, with completion conditional on FIRB approval.
                            6.   Indicative return on invested capital target. ROIC calculations: Recurring return includes all Recurring income plus revaluation gains; Recurring capital includes net funds employed in wholly-owned investment properties,   8
                                 ownership stakes in investment and develop-to-own partnerships, and develop-to-own inventories. Development return comprises Development income; Development capital includes net funds employed in build-to-sell
                                 inventories.
Our performance – 1H22 result
Tightened guidance range; material skew to 2H22
1H22 Highlights
Tightened guidance range to 35.1-35.6 cents
FFO1 FFO1 per security
Material skew to 2H22 as previously disclosed
$350m 14.7 cents Continued Masterplanned Communities sales and pricing momentum driving
margin expansion and 30% increase in contracts on hand vs June 2021
(9.3)% on 1H21 (9.3)% on 1H21
Halcyon acquisition and Land Lease Communities performing ahead of
NTA per security Distribution per security expectations – 212 net sales and ~12% price growth; incremental synergies
and value from integration
$4.23 12.0 cents NTA up 6.3% post solid revaluation gains from our high-quality portfolio,
82% payout ratio including $543m of revaluations in Commercial Property
6.3%2 on 30 June 2021
97.5% 4 rent collection rates across Commercial Property
Statutory profit Gearing
Robust balance sheet with gearing at 23.3%, reduced by ~7% on a pro-forma
$850m 23.3% basis allowing for post-balance date transactions
150.7% on $339m3 in 1H21 Up from 21.4% at 30 June 2021 Significant pro-forma liquidity of ~$2.5bn, materially strengthened post RL
divestment increasing capacity to invest in higher growth strategic initiatives
Post-balance date transactions create additional high-quality earnings
streams, an enhanced focus on core businesses, and a strengthened balance
sheet position
1. Funds from operations (FFO) is determined with reference to the PCA guidelines.
2. Compared with 30 June 2021 NTA per security of $3.98.
3. Reflects restated accounts and impact of the change in accounting treatment per IFRIC on SaaS costs. 9
4. Rent collection rates across the Commercial Property portfolio up to 31 January 2022 on December year-to-date billings. Includes all provisioned COVID-19 abatements.
Note: All relevant Group financials include Retirement Living, which is classified as a discontinued operation.
One of Australia’s ten strongest brands1
Driven by excellence in our People, ESG and innovation

    Artist impression, Stockland Head Office, Piccadilly, Sydney, NSW                      Artist impression, Stockland Net Zero Home, Orion Braybrook, VIC                           Artist impression, Stockland Newport, NSW

 People are our most valuable asset                                                       ESG leadership as a value creator                                             Customer-centric innovation
 • Reset of leadership team complete and key business                                     Progress towards net zero 2028                                                        Top 10 Australian Strongest Brand 2022
   leaders appointed                                                                                                                                                            2022 Brand Finance Australia 100 ranking
                                                                                          • ~2.2MW of rooftop solar PV to be installed in FY22,
 • Motivated workforce, with employee engagement at                                         increasing total Commercial Property electricity                                    PEXA Property X Innovate Awards 2021
   >80%, above the Australian National Norm                                                 generated on site to 32%                                                            Better Together Award, Industry Leadership
                                                                                          • These new solar installations will deliver a 5%
 • Leading ASX 100 company in terms of Executive                                            reduction in Scope 2 carbon emissions                                               PCA Innovation & Excellence Award 2021
   Team Gender diversity                                                                                                                                                        Project Innovation BindiMaps Navigation

 • Continued support and commitment to employee                                           Global ESG leadership                                                                 UDIA QLD Awards for Excellence 2021
   diversity and flexibility at Stockland                                                                                                                                       Masterplanned Community Award, Aura

                                                                                                                                                                                UDIA WA Awards for Excellence 2021
                                                                                                                                                                                Best Affordable Development, Garden
                                                                                                                                                                                House, Sienna Wood

                                 1.   10th strongest brand in Australia, 2022 Brand Finance Australia 100 ranking. Improvement of +32 places in comparison with 2021.                                                             10
Financial results and
capital management
Alison Harrop
11QLD
Artist impression, Halcyon Lakeside,Capital position
Robust balance sheet with available liquidity, materially strengthened post transactions
Gearing Investment grade Available liquidity Fixed Hedge Ratio
73%2
credit ratings (cash and undrawn facilities)
23.3% A-/A3 ~$1.3bn
At the low end of target
Stable outlook Materially strengthened to
range of 20-30%
S&P / Moody’s ~$2.5bn on a proforma basis
(post-transactions1)
• Significant headroom in financial
Weighted average Weighted average cost Weighted average debt metrics under debt covenants
cost of debt of debt maturity
• Continued broad access to global
3.6% 3.5% 5.2 years capital markets
For 1H22 Expected for FY22
12
1. Post 31 December 2021 balance date. Transactions exchanged, with completion conditional on FIRB approval.
2. 12-month rolling average.Solid operating cashflows
1H22 operating cashflow reflects material skew to 2H22
Operating Cashflow1 Operating Cashflow before
Focused cashflow management
land acquisitions1
Settled $172m of non-core divestments, primarily Town Centre
$172m $440m disposals of ~$164m
Setting up for future growth with $268m in land acquisitions and
$475m2 in 1H21 $579m2 in 1H21 $332m in acquisition of Halcyon business
1H22 Operating Cashflow impacted by skew to 2H for Residential
settlements and step-up in land acquisition payments
Cash movements between FY21 and 1H22 driven by investments for future growth
1,800
1,600
Funding and liquidity
1,400 (317)
440 172 (235)
1,200 Capital discipline reflected through staged capital release &
1,000
(299) redeployment:
$m
800 (268)
Upcoming capital release from non-core retail and contracted
600 1,162
(332) RL asset disposals
400 (46)
200
277 Staged redeployment into existing development pipeline,
- including M_Park, NSW
30-Jun-21 Operating Distributions Sale of Net proceeds CP, LLC and Land Halcyon Other 31-Dec-21
opening cash cashflow
balance before land
investments from RL
borrowings acquisitions
acquisitions³ acquisition closing cash
balance
Maintained gearing at lower end of target range at 23.3%
acquisitions and
development Gearing impact of ~7% post execution of announced transactions
1. Cashflows include residential cash receipts of $669m and residential costs of $781m, comprising current year stage costs,
future stage infrastructure costs, and SG&A and other costs. Future stage infrastructure costs represent ~60% of costs. 13
2. Reflects reclassification and the impact of the IFRIC agenda decision on SaaS costs.
3. Includes Residential and Logistics projects.Funds from operations
Solid FFO with 2H22 skew as per guidance
• Skew to 2H22 driven by timing of Communities 1H22 1H21 Change Increased trading profits and comparable FFO growth
$m
settlements, contracted Retirement Living village of +3.7%4. New leases generated average positive
disposal profits due in 2H22, and retail Logistics 87 55 58.2% spread of +5.1%
abatements over 1H22
Workplace1 56 56 - Non-core asset disposals and increased COVID-19-
related expenses vs prior period. +2.0%5 comparable
• Strong operating profit margins in MPC due to Town Centres 153 185 (17.3)% FFO growth ex COVID-19 impacts
price growth and settlement mix, offsetting supply
chain and construction cost increases Commercial Property net Normalisation of cost base post-COVID-19, and
(18) (10) 80.0%
overheads investments in technology
• Increased Logistics FFO reflecting trading profits Commercial Property 278 286 (2.8)%
on settlement of Gregory Hills, NSW and rental
growth Residential Communities 122 136 (10.3)% Reflects material skew to 2H22
Land Lease Communities 5 - -
• COVID-19 impact of ~$28m in 1H22 (abatements
1H21 reflects DMF recognition from disposal of four
net of small ECL provision release) vs net $8m in Retirement Living 17 36 (52.8)%
non-core Retirement Living villages
1H21
Unallocated corporate
(35) (28) 25.0%
overheads2
• Higher overheads reflect investment in Reflects lower average borrowings, improved
technology, normalisation of cost base post- Net interest expense (37) (44) (15.9)% weighted average cost of debt and increase in
COVID-19 and increased insurance premiums capitalised interest with higher production levels
Total 350 386 (9.3)%
FFO per security (cents) 14.7 16.2 (9.3)%
Distribution per security (cents) 12.0 11.3 6.2%
Solid revaluation gains across our high quality
Statutory profit 850 3393 150.7% portfolio
1. Reflects reclassification of six assets into Workplace from Logistics. 4. Excludes COVID-19 abatements.
2. Reflects the impact of the change in accounting treatment per IFRIC on SaaS costs. 5. Excludes COVID-19 abatements and ECL. 14
3. Reflects restated accounts and impact of the change in accounting treatment per IFRIC on SaaS costs. Note: All relevant Group financials include Retirement Living, which is classified as a discontinued operation.Commercial
Property
Louise Mason
Oakleigh Industrial Estate, VIC 15Commercial Property
Solid operating metrics reflect quality and resilience of portfolio
• Solid underlying FFO result and cash position, reflecting:
• Positive comparable FFO growth (pre abatements and ECL) of 2.3%
$10.5bn
• Logistics trading profits from settlement of Gregory Hills, NSW and 5.1% average rental growth on new
leases
• Offset by mandated COVID-19 abatements and non-core Retail disposals Asset value2
+6.6% increase on FY21
• Strong rent collection rates of 97.5%1 across the portfolio despite COVID-19 disruption Including
$543m Net valuation increase
FFO
comparable
Key metrics Asset value2 FFO growth3 Occupancy WALE4
Town Centres $5,613m $153m 2.0%5 99.1%7 5.4 yrs
$278m
Workplace8 $2,060m $56m 1.9%6 90.6% 4.8 yrs Funds From Operations
Logistics $2,870m $87m9 3.7%6 99.9% 3.6 yrs
Sub-total
Commercial Property net overheads
$10,543m
-
$296m
$(18)m
2.3%5
-
-
-
-
-
97.5%
Rent collection1
Total $10,543m $278m - - -
1. Rent collection rates across the Commercial Property portfolio up to 31 January 2022 on December year-to-date billings. Includes all provisioned COVID-19 abatements.
2. Excludes WIP and sundry properties.
3. Includes comparable assets; excluding acquisitions, divestments and assets under development.
4. Weighted average lease expiry.
5. Excludes COVID-19 abatements and ECL.
6. Excludes COVID-19 abatements.
7. Occupancy reflects stable assets for the period. This calculation is based on signed leases at 31 December 2021. 16
8. Reflects reclassification of six assets into Workplace from Logistics.
9. Includes $28m trading profit from settlement of Gregory Hills, NSW.Commercial Property – Key priorities
Leveraging our multi-sector capability to create and reshape portfolio
Accelerate Reposition Focus Maximise
Logistics & Workplace Town Centre portfolio Retail Essentials value of our asset base
• Established M_Park Capital • Executed on ~$310m3 of non-core • Increased investor appetite for • Optimising landbank through
Partnership1 asset disposals high quality, essentials-based retail masterplanning
• 5 Logistics DAs lodged, • Well-positioned essentials-based • Explore capital partnership at • Mixed use and densification
representing ~$370m2 in end value portfolio appropriate time opportunities
across ~150,000 sqm GLA
• Performance driven by active
• Bolstered pipeline with future remixing and rebalancing strategy
redevelopment potential at over time
Padstow
• Piccadilly and Affinity Place
development projects continue to
progress through the authority
approvals process
~$370m2 in Logistics DAs ~$310m3 of non-core Optimise Essentials retail Exploring masterplanning
lodged disposals portfolio opportunities
1. Post 31 December 2021 balance date. Transactions exchanged, with completion conditional on FIRB approval. 17
2. Representing forecast end value on completion.
3. Includes disposal of Bundaberg, QLD, Townsville Nathan Street, QLD, and asset held for sale Cairns, QLD.Commercial Property
Valuations underpinned by quality assets
Stockland Nowra, Yennora Distribution Piccadilly, NSW
NSW Centre, NSW
Net valuation increase of
$543m 1
5.5% increase on June 2021 book value
With 88%2 of assets independently
revalued at 31 December 2021 Town Centres Logistics Workplace
1H223 $252m, +4.6% $262m, +10.6% $29m, +1.5%
Cap rates Compressed by 20bps to 5.9% Compressed by 40bps to 4.2% Compressed by 14bps to 5.4%
Drivers • Uplift driven by essentials-based • Uplift driven predominantly by cap rate • Movements reflect a combination of
portfolio mix compression cap rate firming, moderate income
growth and completed lease deals
• Easing COVID-19 restrictions driving • Transactions continue to reflect
improved retail investment sentiment, ongoing investor appetite • Recognition of uplift on completion of
though uncertainty remains
upgrade works at Optus Centre, NSW
• Increased confidence in the sector,
particularly in essentials-based retail
• Substantial increase in retail transaction
activity driving cap rate compression
1. Excludes sundry properties and stapling adjustment.
2. By value.
18
3. Represents net valuation change for 6 months to 31 December 2021.Town Centres
Resilient sales from essentials-based mix
Total MAT growth of 0.6%1, underpinned by resilient essentials-based
Resilient sales, above pre-COVID-19 levels. Improvements aligned with easing
portfolio
trade restrictions
Improvement in performance aligned to COVID-19 recovery cycles Comparable monthly growth4, 2021 vs 2019
6.0% 4.6% 5.3% 8.6% 8.1% Trading restrictions in place 8.3%
5.7%
MAT impacted by extensive trade restrictions in NSW and VIC over 1Q22 (0.2%) (1.3%)
7.2% 6.1% 6.6% 7.7%
3.1% 4.4%
3.7%
Impact was offset by strong performance in QLD and WA, with total MAT (6.2%) (5.1%) (17.4%) (17.0%)
growth in these states of 5.3% and Specialties MAT growth of 10.8% (9.0%)
Performance driven by active remixing and management over time, with: (21.3%)
~75% MAT skewed toward essentials-based categories (38.5%) (38.7%)
Jan-21 Feb-21 Mar-21 Apr-21 May-21 Jun-21 Jul-21 Aug-21 Sep-21 Oct-21 Nov-21 Dec-21
Essentials-based MAT growth of 4.2% vs pre COVID-19 volumes2 Total Specialities
Strong leasing outcomes coming to fruition with significant new store
openings
Significant repositioning of portfolio, with ~$310m3 of non-core assets
disposals over 1H22 +0.6% +0.4% +2.9%
Total Portfolio1 Comparable Comparable
Annual MAT Centres4 Annual Centres4 Specialty
growth MAT growth Annual MAT
growth
1. Sales data includes all Stockland managed retail assets, including joint venture assets.
2. Annual MAT growth comparison -12 months to February 2020.
3. Includes disposal of Bundaberg, QLD, Townsville Nathan Street, QLD, and asset held for sale Cairns, QLD.
19
4. Comparable basket of assets as per SCCA guidelines, which excludes assets which have been redeveloped within the past 24 months.Town Centres
Well positioned portfolio
Comparable FFO growth of +2.0%1, highlighting portfolio resilience despite trade
restrictions 1H22 1H21
Occupancy4 99.1% 98.7%
Despite the ongoing COVID-19 environment, tenant confidence is recovering:
WALE5,6 5.4 yrs 5.5 yrs
• 313 deals and ~52,000 sqm2 leased
Specialty retail leasing activity7
• +1.2% leasing spreads across new leases and renewals Tenant retention8 64% 71%
• High rent collection and occupancy at 96.5%3 and 99.1%4 respectively Total lease deals2 313 322
Specialty occupancy cost ratio9 15.9% 16.0%
Proven capability to pro-actively manage the changing retail environment
Average rental growth on lease deals10 1.2% (7.8)%
Renewals: number, area 179 / 26,538 sqm 177 / 25,931 sqm
rental growth10 0.6% (7.6)%
New leases: number, area 100 / 13,159 sqm 82 / 10,494 sqm
+2.0% 96.5%3 +1.2%
Comparable Rent Average leasing rental growth10 2.4% (8.4)%
FFO growth1 collection spreads incentives: months11 11 14.2
1. Includes comparable assets; excluding acquisitions, divestments and assets under development. Excludes 6. Assumes all leases terminate at earlier of expiry / option date.
COVID-19 abatements and ECL. 7. Metrics relate to stable assets unless otherwise stated.
2. Includes leasing across stable and stabilising assets and project leasing. 8. Adjusted for operational centre remixes and reconfiguration as well as retailers subject to administration.
3. Rent collection rates across the Commercial Property portfolio up to 31 January 2022 on December year-to- 9. Occupancy cost reflects stable assets, adjusted to reflect tenants trading more than 24 months, and for
date billings. Includes all provisioned COVID-19 abatements. COVID-19 abatements agreed to date for the period. 20
4. Occupancy across the stable portfolio based on signed leases and agreements at 31 December 2021. 10. Rental growth on stable portfolio on an annualised basis.
5. By area. 11. Represents the contributions made towards the retailers’ fit outs, expressed in equivalent months of net rent.Logistics
Strong performance from high quality portfolio
• Comparable FFO growth of 3.7%1, driven by 5.1% average rent growth on new
leases
1H22 1H21
• 1H22 FFO2 includes trading projects achieving margins of ~28% as investment
demand remains elevated for quality assets FFO $87m2 $55m
• More than 300,000 sqm leased3 over 1H22 Asset value7 $2,870m $2,122m
• High rent collection rates of 99.6%4 and occupancy of 99.9%5,6
Leased area 142,586 sqm 179,889 sqm
• Leasing enquiry remains elevated, underpinned by growing investment in supply
chain improvements
Leases under HOA6 158,742 sqm 71,954 sqm
Average rental growth on new
4.1%8 (2.0)%
leases and renewals
~$2.9bn Over 99.6%4
Asset Value7 300,000 sqm Portfolio occupancy5,6 99.9% 95.6%
Rent collection
Leased/HOA3
Portfolio WALE5,6 3.6 yrs 3.5 yrs
1. Includes comparable assets; excluding acquisitions, divestments and assets under development. Excludes COVID-19 5. By income.
abatements. 6. At 31 December 2021.
2. Includes $28m in trading profit from settlement of Gregory Hills, NSW. 7. Excludes WIP and sundry properties.
3. Reflects executed leases & leases under HOA as at 31 December 2021. 8. Excluding a single deal at Yennora Distribution Centre, NSW, rebased to market rent. 21
4. Rent collection rates across the Commercial Property portfolio up to 31 January 2022 on December year-to-date
billings. Includes all provisioned COVID-19 abatements.Logistics
Accelerating the pipeline
Masterplanning Progressed Planning Active Developments
$1.3bn1 $1.1bn1 $0.8bn1
Future opportunities
Kemps Creek 2, NSW
Detailed planning
▪ Kemps Creek 1, NSW
Underway
▪ Ingleburn, NSW – stage 3
Total ~$400m
~$3.2bn1
▪
▪ Kemps Creek 3, NSW ▪ Willawong Distribution ▪ Leppington Business Park, NSW Average development
▪ Padstow, NSW Centre, QLD – stages 4 - 5 – stages 1-2 p.a. doubled from
▪ Melbourne Business Park, VIC ▪ Willawong Joint Venture ▪ Silica Street Industrial Park, development ~$150m p.a.3
– future stages Project, QLD Carole Park, QLD – stage 2
pipeline
▪ Altona Industrial Estate, VIC ▪ Willawong Distribution Centre,
▪ Melbourne Business Park, VIC QLD – stage 3
– stage 2 ▪ Yatala, 77 Darlington Drive, QLD
▪ Yatala Distribution Centre, QLD –
Target
stage 3
▪ Cranbourne West, VIC2
▪ Leakes Road, Truganina, VIC2
50%
5 DAs lodged ▪ Melbourne Business Park, VIC –
representing Lot 45
▪ Melbourne Business Park, VIC –
$370m1 stage 1 Activation of existing pipeline within
3 years
end value across
150,000 sqm GLA
1. Forecast end value on completion.
2. Under conditional contracts; and part of the joint venture arrangements with a fund managed by JP Morgan Asset Management.
22
3. Forecast 5-year average in comparison to historical 5-year average.Workplace
Strong platform for future growth
• Comparable FFO growth of 1.9%1 despite disrupted work patterns, with high rent collection rates
of 98.9%2 and strong occupancy of 90.6%3,4
• 20,253 sqm leased5 as businesses make decisions on future workspace needs
• WALE of 4.8 years across the Workplace portfolio
1H22 1H21 10 $5.9bn
Development
FFO $56m $56m Assets8
pipeline9
Asset value6 $2,060m $1,895m
Leases executed
Leases under HOA3,7
11,321 sqm
8,932 sqm
5,484 sqm
1,777 sqm
98.9% $2.1bn
Rent collection2 Portfolio value6
Average rental growth on new leases and renewals 1.0% 8.3%
Portfolio occupancy3,4 90.6% 95.2%
Portfolio WALE3,4 4.8 yrs 4.7 yrs
1. Includes comparable assets; excluding acquisitions, divestments 4. By income.
and assets under development. Excludes COVID-19 abatements. 5. Reflects executed leases & under HOA.
2. Rent collection rates across the Commercial Property portfolio up 6. Excludes WIP and sundry properties.
to 31 January 2022 on December year-to-date billings. Includes all 7. Represents 100% interest.
provisioned COVID-19 abatements. 8. Reflects reclassification of six assets into Workplace from Logistics.
Artist impression, Affinity Place, North Sydney, NSW 23
3. At 31 December 2021. 9. Forecast end value on completion.Workplace
Growing the new generation portfolio
Artist impression, Affinity Place, North Sydney, NSW
Artist impression, Piccadilly, Sydney, NSW Artist impression, M_Park, Macquarie Park, NSW
Artist impression Piccadilly, NSW
Creating next-gen Workplaces Scaling Capital Partnerships Exploring Opportunities
• Curated, modern workplaces focused on • Leveraging our attractive pipeline and capabilities to • Structural shifts create potential to originate,
innovation and aligned to our scale capital partnerships reposition and redevelop assets across the
sustainability values landbank and future acquisitions
• Established M_Park Capital Partnership1 with
• Well-located geographically, and well-placed Ivanhoé Cambridge over stage 1, with potential to • Leveraging our capabilities to capital partner
within the development cycle to capitalise on accelerate stage 2 across core, opportunistic and mixed use plays
structural shifts to develop and reposition future workplaces
• Progressing conversion of new developments:
• Leveraging our development and community
• Piccadilly, Sydney CBD
creation strengths to provide a clear point
of difference • Affinity Place, North Sydney
1. Post 31 December 2021 balance date. Transactions exchanged, with completion conditional on FIRB approval.
24Communities
Andrew Whitson
Newport, NSW 25Communities – key priorities
Leveraging our position as Australia’s leading community creator
Extend Grow Scale Optimise returns
Residential leadership Land Lease Communities Apartments business via a capital solution
• Strength of demand for Stockland • Halcyon acquisition performing • Well-placed for recovery of for Retirement Living
MPC resulting in net sales of 3,815 ahead of expectations apartment market
• Retirement Living divestment
in 1H22
• Scaling at pace with total portfolio • Positioning Rosebery, NSW and broadly in line with book value2
• 6,436 contracts-on-hand reflects growing to ~9,000 home sites Brunswick, VIC for launch at
• Delivered on strategy to reduce
30% increase on FY21, with ~14% appropriate time
• Execution of capital partnership allocation to Retirement Living
higher average pricing
with Mitsubishi Estate Asia2 • Continuing to investigate build-to-
• Releases capital for redeployment
• On track to meet target FFO despite accelerating development and rent opportunities
into higher growth opportunities
settlement deferrals into FY23 platform growth
• Operating profit margin of 18.2% • FY22 forecast to outperform
despite cost pressures despite supply disruptions and cost
pressures
Industry leadership: Execution of strategic Divestment of Retirement
Broadening
Market share1 3x that of partnership with Mitsubishi Living business broadly in
customer reach
closest competitor Estate Asia2 line with book value2
1. Rolling annual market share is based on net sales across all surveyed regions across major metro markets. Source: NLS Research4. 26
2. Post 31 December 2021 balance date. Transactions exchanged, with completion conditional on FIRB approval.Residential
On track to meet target FY22 FFO
• 2,329 settlements1 over 1H22, in line with expectations
• Material skew to 2H22 due to timing of settlements
• Operating profit margin of 18.2% positively impacted by higher proportion of NSW settlements.
FY22 operating profit margin guidance of over 18% 6,436 30%
Contracts on hand increase on FY21
• Contracts-on-hand up 30% on FY21 with ~14% higher average pricing
• FY22 settlement guidance reduced to ~6,000, driven by COVID-19 supply chain disruption and wet
weather delays in SEQ
$122m (10.3)%
• FFO expectations remain unchanged due to operating profit margin increase from price growth and 1H22 FFO Decrease on 1H21
mix
2,329
• Upward pressure on civil construction costs within contingency allowances; built-form cost increases
offset by price growth
Total lots settled in
3,815
Net sales
- 1H221
2,329 331
3,815
18.2%
-
6,436 6,767
4,950 Operating profit margin
30 June 2021 Net deposits Settlements 1 31 December 2021 January 2022 net deposits 31 January 2022
contracts on hand contracts on hand contracts on hand
1. Includes 672 settlements under joint venture/project development agreements (1H21: 826). 27Residential
Demand remains strong
• Strong net sales of 3,815 in 1H22, in line with elevated 1H21 volumes Net sales by quarter 2,036 1,974 1,947
during HomeBuilder stimulus 1,799
1,891 1,868
382 314 180
324 250
• Enquiries remain elevated, despite slower promotional activity to align 1,350 1,375
327
1,293 1,295
sales releases to production 1,149 1,121
580 630
697
550
215 571
164 181 311
963 680
846 273 198
• Growth in undersupply driven by strong demand 420 391 98
366
345
96 350
293 407 777
280 329 304 878 881
864 904
• Managing contracts-on-hand with increased deposits, prequalification 521 488 481
396 421
requirements and shorter timeframes to unconditional contracts 330 288
486 488
188 235 192 297 192 187
176 140 181 152 132 126
• Default rates of 1.6% remain below historical averages 1Q19 2Q19 3Q19 4Q19 1Q20 2Q20 3Q20 4Q20 1Q21 2Q21 3Q21 4Q21 1Q22 2Q22
• January 2022 sales of 331 lots impacted by no new releases in NSW
Monthly enquiries 15,208
14,437
12,289
4,371 11,567
10,983 11,220 10,879 11,343 11,340 4,191
10,486
9,607 9,681 2,718
9,128 2,372 2,282 3,086
7,691 3,729 4,277 3,503 3,129 7,768
2,433 3,024 2,867 5,256
4,794 4,034
5,752 4,754 1,981
2,824 4,687 4,050
3,356 3,287 3,324
3,252 1,695 3,488 3,042 3,365
2,521
2,028
1,872 4,717 4,597 4,841
3,585 3,322 3,836 3,743 3,621
2,768 3,355 2,998 2,928 2,765 2,727
2,323
1,866
675 516 319 543 457 504 613 711 684 448 561 735 984 810 539 696
Oct-20 Nov-20 Dec-20 Jan-21 Feb-21 Mar-21 Apr-21 May-21 Jun-21 Jul-21 Aug-21 Sep-21 Oct-21 Nov-21 Dec-21 Jan-22
WA VIC QLD NSW/ACT
28Residential
Strong embedded margins
• Landbank average age of ~9.5 years; well-located with skew to undersupplied Eastern seaboard markets
• Embedded margins driven by strong price growth in these locations over the last 5 years, significantly above through-cycle acquisition pricing assumptions
~82,000 lot landbank with average age of ~9.5 years Strong embedded margins driven by vacant land price growth
Sydney
280 Melbourne
Vacant land price index (Jun-11 Base)
13%
SEQ
29% Perth
240 Through-cycle price growth assumptions
Stockland
BV ~$3.5bn1 200
~87% skew to 160
36%
Eastern seaboard
120
22%
80 FY11
FY12
FY13
FY14
FY15
FY16
FY17
FY18
FY19
FY20
FY21
FY22
NSW/ACT QLD VIC WA
1. As at 31 December 2021.
29Residential Outlook
Positive 12 months with growth to moderate
• Current residential fundamentals remain strong 12-month outlook
State Price Volumes Market commentary
• Supply unable to satisfy buyer demand, due to limited land • Strong demand to continue in the near-term
availability and supply chain disruption
• Undersupply of available land and production constraints to
NSW place a ceiling on volumes
• Demand expected to remain elevated over the near-term
despite marginal tightening in credit and upward pressure on • Price and volumes to moderate over the medium term from
fixed rates an elevated base
• Significant pent-up demand and relative affordability to
• Over the medium-term market conditions are expected to Sydney to support price in the near term
normalise, in line with rising interest rates VIC • Volumes expected to moderate from current historical highs
• Expectations for price growth to moderate over the medium
• Increased net overseas migration following international
term
border reopenings to drive volume growth over time
• Continued strong interstate migration and relative
• Supply change disruption to drive cost increases above affordability advantages over Sydney and Melbourne to
long-run averages over the next 12 months drive demand
QLD • Undersupply of available land to constrain volumes with
price growth to continue
• Expectations for price growth to moderate over the medium
term
• Increased interstate migration following state border
reopening to drive volume growth
WA • Pricing supported by continued established market strength
which is currently reflected in the tightest rental market
nationally
30
Elara, NSWLand Lease Communities
Rapid growth in the business, financial performance ahead of Halcyon acquisition expectations
Building a market leading Land Lease Communities platform
• Halcyon acquisition performing ahead of expectations
• Net sales of 212 and price growth of ~12%
• Leveraging Halcyon platform to drive synergies and value creation
212 ~12% 220-240
Net sales Price growth Target FY22
over 1H22 over 1H22 settlements
• Target FY22 home sites settlements of 220-2401, impacted by SEQ wet
weather delays and COVID-19 supply chain disruption
• Future year margins to increase due to price growth, increasing scale and
management fees, tempered by upward cost pressures
Net sales by month
1H22 result reflects part-period contribution of Halcyon
• 1H22 recurring income of ~$4m, with operating margins of 68% in line
with forecasts
76
• 98 settlements in 1H22, with material skew to 2H22
41
34
26
20 10
5
July 2021 August 2021 September 2021 October 2021 November 2021 December 2021
Pre acquisition Post acquisition
1. Over 80% skew to Halcyon ‘under development’ units. Halcyon acquisition settlement on 17 August 2021. 31Land Lease Communities
Scaling market footprint and leadership at pace
• Total portfolio increased from 7,800 home sites to ~9,000 home sites
• Total development sites increased to 7,400 home sites, including ~300 home sites from the recent acquisitions of St Germain, VIC and a further ~900 home sites identified
within our WA landbank
• Expansion in development pipeline driving ramp up in total settlement volumes post FY25
Total Portfolio increase to ~9,000 home sites Incremental acquisitions and pipeline launches1 driving ramp up in settlement volumes
Community Remaining home sites 2H22 FY23 FY24 FY25 FY26 FY27+
Stockland Halcyon Combined
In development Halcyon Greens, QLD 150
Halcyon Rise, QLD 270
Total Portfolio 5,200 3,800 9,000 B by Halcyon, QLD 250
Halcyon Burpengary, QLD 370
Stockland Nirimba, QLD 230
Total Established 20 1,600 1,620 Stockland Berwick, VIC 170
Subtotal in development 1,440
In planning FY23 -
launch dates
Total Development 5,180 2,200 7,380 FY24 2,860
FY25 1,320
FY26+ 1,760
In development 400 1,040 1,440 Subtotal in planning 5,940
Total pipeline 7,380
In planning Projected Target settlement ~600 home sites p.a. FY24
4,780 1,160 5,940
growth volumes Significant ramp up post FY25+
1. Incremental development home sites identified within WA landbank. 32
Note: Portfolio figures have been rounded.Land Lease Communities
Capital partnership with Mitsubishi Estate Asia (MEA) facilitating growth and improving returns
• Stockland Residential Rental Partnership1 to focus on the development and Australia’s foremost Land Lease Communities Partnership
ownership of Land Lease Communities:
• Stockland and (MEA) at 50.1% and 49.9% interests respectively; targeting SRRP seed
50-60% leverage over time
~2,000
portfolio
• Seed portfolio of ~$500m, comprising six Land Lease Communities in
production estimated to yield ~2,000 home sites on completion
Stockland Total Portfolio
~9,000
• SRRP will have exclusive rights to Stockland pipeline for a five year period, development
Stockland
with a gross realisation of approximately $4bn2 pipeline home sites ~5,900 ~1,100 established home
home sites sites
• Stockland and MEA will explore opportunities to further grow the portfolio via
the acquisition of additional home sites that meet the partnership’s return
requirements
• Partnership in line with our strategic priority to grow the platform to a market
leading position and:
• Accelerate realisation of embedded development margin within
Stockland’s extensive landbank
• Drive high-quality recurring management fees and rental income streams
~$500m ~2,000 ~$4bn
SRRP
Seed Home sites in
Development
portfolio seed portfolio
Pipeline2
1. Target completion in late FY22, subject to Foreign Investment Review Board (FIRB) approval.
2. Stockland’s land lease development pipeline is forecast to generate gross development realisations of approximately $5bn. Of this approximately $4bn is expected to commence construction during the SRRP’s five-year 33
initial investment period.Retirement Living
Sales rebound in line with easing restrictions
• 1H22 sales of 4151 reflected a significant rebound in 2Q22 in line with easing of restrictions, with
November sales reflecting the highest monthly result on record
$17m
• Strength in conditions reflected in established settlements increasing by 13.5% on 1H21
• Result demonstrates the shift in customer preferences towards safety and wellbeing provided by
village living 1H22 FFO
• 1H22 FFO of $17m impacted by reduced development settlements and lower non-core village
disposal profits than 1H21
• FY22 FFO to reflect an increase on FY21 with material village disposal profits due in 2H22 2
328 13.5%
Established units
On 1H21
settled
Net sales by quarter
270
259
250
176
233
14.3%
225
215 68 37
206
195 60
62
49
62
156 Established
72 148 47 On FY21
28
contracts on hand
21
222
190 202
157 163 171
143 148
127 128
1Q20 2Q20 3Q20 4Q20 1Q21 2Q21 3Q21 4Q21 1Q22 2Q22
Established Development
1. Established sales of 350 and development sales of 65. 34
2. Profit relating to the disposal in 1H21 of four Retirement Living Villages in Victoria (Bundoora, Cameron Close, Latrobe, and Long Island).Retirement Living
Sale of Retirement Living business broadly in line with book value
• Delivers on strategy to reduce capital allocation to the Retirement Living business Jun-21 carrying value to bridge to transaction sale price
• Simplifies and focuses our Communities business as Australia’s leading residential
creator (16)
-
(21) (2)
• Releases capital for redeployment into higher growth strategic priorities - -
(12)
-
• Transaction price ~$987m1 reflects investor demand for quality product and
platform, in an asset class with demographic tailwinds
• Stockland will provide a Transitional Services Agreement (TSA)2 for several months
post settlement to facilitate an effective transfer of ownership
• Target settlement in late FY223
1,057
1,018
1,006
987
Delivered
Optimising
~$987m
on Purchase price
returns ~1.9% below book
strategy value
30-Jun-21 Retained Working Net IP & 31-Dec-21 Retained 31-Dec-21 Purchase Price
assets capital inventory Affinity (WA) Pro-forma net
movements assets
1. Affinity Village (WA) to be sold down via a separate disposal process and other items outside the transaction perimeter. 35
2. Provision of administrative support, including finance and technology, at prevailing market rates.
3. Subject to Foreign Investment Review Board (FIRB) approval.Summary and
Outlook
Tarun Gupta
36
Artists impression, Kalina, QLDGood progress Sector capital allocation1 Target 1H22
towards strategic Workplace and Logistics
Residential (for sale and ownership)
30-50%
20-35%
35%
19%
targets Town Centres 20-30% 39%
Alternate 0-5% 7%
Capital allocation by activity1 Target 1H22
Recurring2 70-80% 81%
Key points:
Development2 20-30% 19%
• Dynamically reshaping the portfolio
through strategic transactions and
Income mix1 Target 1H22 redeployment into identified
opportunities
Recurring3 60% 65%
• Accelerating pipeline and unlocking
Development3 40% 35%
large opportunity set available to
Stockland across existing assets and
Returns on invested capital1 Target new origination
Recurring 6-9% • Scale and deepen capital partnerships
using recent transactions as a platform
Development 14-18%
• Continue building enterprise-wide
capabilities in delivery, innovation,
Capital structure1 Target 1H22 technology & ESG
Gearing (% Debt / TTA) 20-30% 23.3%
Look-through gearing4Summary and outlook
Outlook: Good visibility and well positioned for FY22
• Positive residential market conditions with continued elevated demand levels
• Strong embedded margins driven by price growth across well-located landbank
• Solid Retail performance from resilient core portfolio
• Acceleration in Logistics and Workplace development
Tightened Guidance range for FY22
• FFO per security guidance range tightened to 35.1-35.6 cents
• Distribution per security within our target payout ratio of 75% to 85% of FFO
• Current market conditions remain uncertain. All forward looking statements,
including FY22 earnings guidance, remain subject to no material deterioration
in current market conditions and the continued easing of COVID-19
restrictions, and are underpinned by the following business assumptions:
• Residential settlements approximately 6,000 lots
• Residential operating profit margin above 18%
• Land Lease Communities delivering 220-240 home site settlements in
FY22
• Rent collection trends continue at current levels
Artist impression, Vision by Halcyon, QLD 38Stockland Corporation Limited
ACN 000 181 733
Stockland Trust Management Limited
ACN 001 900 741; AFSL 241190
As responsible entity for Stockland Trust
ARSN 092 897 348
LEVEL 25
133 Castlereagh Street
SYDNEY NSW 2000
Important Notice
This Presentation and its accompanying Annexures (“Presentation”) has been prepared and issued by Stockland Corporation Limited (A.C.N 000
181 733) and Stockland Trust Management Limited (ACN 001 900 741; AFSL 241190) as Responsible Entity for Stockland Trust (ARSN 092 897
348) (“Stockland”). Whilst every effort is made to provide accurate and complete information, Stockland does not warrant or represent that the
information included in this Presentation is free from errors or omissions or that is suitable for your intended use.
This Presentations and its accompanying Annexures contains forward-looking statements, including statements regarding future earnings and
distributions that are based on information and assumptions available to us as of the date of this Presentation. Actual results, performance or
achievements could be significantly different from those expressed in, or implied by these forward looking statements. These forward-looking
statements are not guarantees or predictions of future performance, and involve known and unknown risks, uncertainties and other factors, many
of which are beyond our control, and which may cause actual results to differ materially from those expressed in the statements contained in this
Presentation.
Current market conditions remain uncertain and challenging as governments and communities enter a new phase in the response to COVID-19.
All forward looking statements, including FY22 earnings guidance, remain subject to no material deterioration in current market conditions and
the continued easing of COVID-19 restrictions.
The information provided in this Presentation may not be suitable for your specific needs and should not be relied upon by you in substitution of
you obtaining independent advice. To the maximum extent permitted by law, Stockland and its respective directors, officers, employees and
agents accepts no responsibility for any loss, damage, cost or expense (whether direct or indirect) incurred by you as a result of any error,
omission or misrepresentation in this Presentation. All information in this Presentation is subject to change without notice. This presentation does
not constitute an offer or an invitation to acquire Stockland stapled securities or any other financial products in any jurisdictions, and is not a
prospectus, product disclosure statements or other offering document under Australian law or any other law. It is for information purposes only.
This announcement is authorised for release to the market by Ms Katherine Grace, Stockland’s Company Secretary.
39You can also read