19 Business Models for Urban Food Waste Prevention, Redistribution, Recovery and Recycling
←
→
Page content transcription
If your browser does not render page correctly, please read the page content below
RESOURCE RECOVERY & REUSE SERIES 19                                ISSN 2478-0529

     Business Models for Urban Food Waste Prevention,
19   Redistribution, Recovery and Recycling
     Dehaja Senanayake, Maren Reitemeier, Felix Thiel and Pay Drechsel
About the Resource Recovery & Reuse Series
Resource Recovery and Reuse (RRR) is a subprogram of the CGIAR Research
Program on Water, Land and Ecosystems (WLE) dedicated to applied research on
the safe recovery of water, nutrients and energy from domestic and agro-industrial
waste streams. This subprogram aims to create impact through different lines of
action research, including (i) developing and testing scalable RRR business models,
(ii) assessing and mitigating risks from RRR for public health and the environment,
(iii) supporting public and private entities with innovative approaches for the safe
reuse of wastewater and organic waste and (iv) improving rural-urban linkages and
resource allocations while minimizing the negative urban footprint on the peri-urban
environment. This subprogram works closely with the World Health Organization
(WHO), Food and Agriculture Organization of the United Nations (FAO), United
Nations Environment Programme (UNEP), United Nations University (UNU) and many
national and international partners across the globe. The RRR series of documents
presents summaries and reviews of the subprogram’s research and resulting
application guidelines, targeting development experts and others in the research for
development continuum.
RESOURCE RECOVERY & REUSE SERIES 19

Business Models for Urban Food Waste
Prevention, Redistribution, Recovery and
Recycling
Dehaja Senanayake, Maren Reitemeier, Felix Thiel and Pay Drechsel
The authors Senanayake, D.; Reitemeier, M.; Thiel, F.; Drechsel, P.
2021. Business models for urban food waste prevention,
Dehaja Senanayake is currently studying for a master’s redistribution, recovery and recycling. Colombo, Sri Lanka:
degree in Agricultural, Food and Environmental Policy International Water Management Institute (IWMI). CGIAR
Analysis (AFEPA) under the Erasmus Mundus program Research Program on Water, Land and Ecosystems
and holds an MA in economics and environmental studies. (WLE). 85p. (Resource Recovery and Reuse Series 19).
Dehaja joined IWMI for an internship between August 2018 doi: https://doi.org/10.5337/2021.208
and June 2019.
/ resource recovery / resource management / reuse / food
Maren Reitemeier holds a BSc in Environmental wastes / business models / waste management / urban
Engineering, a master’s degree in bioeconomy and worked wastes / waste reduction / redistribution / recycling / food
from September 2018 till August 2020 on an academic consumption / food losses / waste collection / food supply
internship position at IWMI in Colombo, Sri Lanka. chains / stakeholders / entrepreneurs / public-private
partnerships / markets / incentives / energy recovery /
Felix Thiel has a master’s degree in agriculture and food nutrients / Sustainable Development Goals / Goal 12
sciences and was working at IWMI on resource recovery Responsible production and consumption / environmental
and reuse as an international consultant. impact / food preservation / composting / feeds / regulations
/ policies / awareness raising / consumer participation /
Pay Drechsel is a Principal Researcher co-leading the costs /
CGIAR Research Program on Water, Land and Ecosystems
(WLE) research theme on sustaining rural-urban linkages. ISSN 2478-0510 (Print)
Pay works on the safe recovery of resources from domestic ISSN 2478-0529 (Online)
waste streams for agriculture and related business models. ISBN 978-92-9090-915-6
Copyright © 2021, CGIAR Research Program on Water, Land
and Ecosystems (WLE), International Water Management
Acknowledgements
Institute (IWMI).
This research was carried out as
part of the CGIAR Research Fair use: Unless otherwise noted, you are free to copy,
Program on Water, Land and duplicate or reproduce, and distribute, display, or transmit
Ecosystems (WLE) and any part of this paper or portions thereof without permission,
supported by contributors to the and to make translations, adaptations or other derivative
CGIAR Trust Fund (https://www. works under the following conditions:
cgiar.org/funders/).
ATTRIBUTION. The work must be referenced according
to international citation standards, while attribution
should in no way suggest endorsement by WLE, IWMI
or the author(s).
NONCOMMERCIAL. This work may not be used for
commercial purposes.
SHARE ALIKE. If this work is altered, transformed or
built upon, the resulting work must be distributed only
under the same or similar license to this one.
Photographs without source: Maren Reitemeier
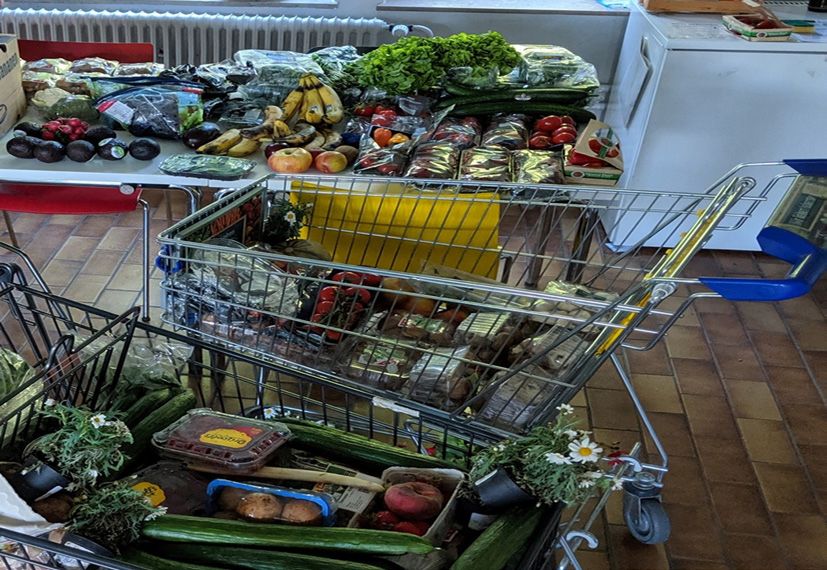
Cover photo: Pay Drechsel (Keells supermarket, Sri Lanka)
Series editor (science): Pay Drechsel, IWMI
English editor: Robin Leslie
Designer: W. D. A. S. Manike
Disclaimer
The opinions expressed in this paper and any possible errors
are the responsibility of the authors. They do not reflect the
position of the CGIAR Research Program on Water, Land
and Ecosystems (WLE) or of the institutions and individuals
who were involved in the preparation of the report.
ii
CONTENTS
List of Figures		                                                       iv
List of Tables		                                                        iv
List of Business Model Canvases                                          v
Acronyms and Abbreviations                                              vi
Summary			                                                             vii
1 Objective and Scope of the Study                                       1
2 Food Waste and its Global Implications                                 2
3 Business Models for Food Waste Management                              3
4 Models for Food Waste Reduction                                        9
   4.1 Measurement                                                       9
		 4.1.1 Model I: Tracking and Analytical Software for Managing Food     9
		 4.1.2 Model II: Measuring and Analyzing Food Waste                  13
   4.2 Redistribution                                                  16
		 4.2.1 Model III: Community Fridge                                   17
		 4.2.2 Model IV: Connection Platform                                 20
		 4.2.3 Model V: Logistics Services                                   23
		 4.2.4 Food Redistribution during the Covid-19 Pandemic              26
   4.3 Resell			                                                       27
		 4.3.1 Model VI: Box Subscriptions                                   28
		 4.3.2 Model VII: Online Secondary Market                            31
		 4.3.3 Model VIII: Store Secondary Market                            34
   4.4 Value Addition                                                  37
		 4.4.1 Model IX: Restaurants Serving Rescued Food                    37
		 4.4.2 Model X: Food Upcycling and Preservation                      41
   4.5 Waste Collection                                                44
		 4.5.1 Model XI: Responsible Waste Collection                        44
   4.6 Recovery of Nutrients and Other Resources                       48
		 4.6.1 Model XII: Mushroom Cultivation                               48
		 4.6.2 Model XIII: Rearing Insects                                   51
		 4.6.3 Model XIV: Swine Feed                                         55
		 4.6.4 Model XV: Nonfood Products                                    58
   4.7 Recycling                                                       61
		 4.7.1 Model XVI: On-site Compost or Energy Recovery                 61
		 4.7.2 Model XVII: Social Community Composting                       65
		 4.7.3 Model XVIII: Off-site Compost and Energy Recovery             68
5 Application Potential to the Global South                            71
  5.1 A Closer Look at the Food Sector Giants                          71
  5.2 Requirements for Adaptation to the Global South                  74

                                                                         iii
LIST OF FIGURES
Figure 1: Food waste businesses per defined category of intervention area                         1
Figure 2: Classification of food wastage into food loss and food waste                            2
Figure 3: SWOT analysis framework                                                                 4
Figure 4: Food recovery hierarchy                                                                 4
Figure 5: Identified examples of business cases of Model I                                       12
Figure 6: Identified examples of business cases of Model II                                      15
Figure 7: Community fridge in a German university                                                19
Figure 8: Identified examples of business cases of Model III                                     19
Figure 9: Identified examples of business cases of Model IV                                      22
Figure 10: Identified examples of business cases of Model V                                      25
Figure 11: Identified examples of business cases of Model VI                                     30
Figure 12: Identified examples of business cases of Model VII                                    33
Figure 13: Identified examples of business cases of Model VIII                                   36
Figure 14: Identified examples of business cases of Model IX                                     40
Figure 15: Identified examples of business cases of Model X                                      43
Figure 16: Identified examples of business cases of Model XI                                     47
Figure 17: Gro-Set for mushroom cultivation at home, sold by Beyond Coffee                       49
Figure 18: Identified examples of business cases of Model XII                                    51
Figure 19: Identified examples of business cases of Model XIII                                   54
Figure 20: Piglets fed on food waste on a farm in peri-urban Sri Lanka                           57
Figure 21: Identified examples of business cases of Model XIV                                    57
Figure 22: Identified examples of business cases of Model XV                                     60
Figure 23: Identified examples of business cases of Model XVI                                    64
Figure 24: Identified examples of business cases of Model XVII                                   67
Figure 25: Identified examples of business cases of Model XVIII                                  70
Figure 26: National and regional governments measuring food loss and/or food waste               71
Figure 27: Map of the distribution of studied cases categorized by the food recovery hierarchy   75

LIST OF TABLES
Table 1: Business model canvas                                                                    5
Table 2: Suitable organization types for the business models presented                            6
Table 3: Legal instruments and incentives to reduce, reuse or recycle food waste                  8
Table 4: SWOT analysis of the tracking and analytical software for managing food model           10
Table 5: SWOT analysis of the measuring and analyzing food waste model                           13
Table 6: SWOT analysis of the community fridge model                                             17
Table 7: SWOT analysis of the connection platform model                                          20
Table 8: SWOT analysis of the logistics services model                                           23
Table 9: SWOT analysis of the box subscriptions model                                            28
Table 10: SWOT analysis of the online secondary market model                                     31
Table 11: SWOT analysis of the store secondary market model                                      34
Table 12: SWOT analysis of the restaurants serving rescued food model                            38
Table 13: SWOT analysis of the food upcycling and preservation model                             41
Table 14: SWOT analysis of the responsible waste collection model                                45
Table 15: SWOT analysis of the mushroom cultivation model                                        49
Table 16: SWOT analysis of the rearing insects model                                             52
Table 17: SWOT analysis of the swine feed model                                                  55
Table 18: SWOT analysis of the nonfood products model                                            58

iv
Table 19: SWOT analysis of the on-site compost or energy recovery model                            62
Table 20: SWOT analysis of the social community composting model                                   65
Table 21: SWOT analysis of the off-site compost and energy recovery model                          68
Table 22: Prospective private sector-driven food waste management initiatives from international
          experiences (non-exhaustive)                                                             72
Table 23. Heatmap of the requirements of models in their transferability to the Global South       76

LIST OF BUSINESS MODEL CANVASES
Business model canvas 1: Tracking and analytical software for managing food                        11
Business model canvas 2: Measuring and analyzing food waste                                        14
Business model canvas 3: Community fridge                                                          18
Business model canvas 4: Connection platform                                                       21
Business model canvas 5: Logistics services                                                        24
Business model canvas 6: Box subscriptions                                                         29
Business model canvas 7: Online secondary market                                                   32
Business model canvas 8: Store secondary market                                                    35
Business model canvas 9: Restaurants serving rescued food                                          39
Business model canvas 10: Food upcycling and preservation                                          42
Business model canvas 11: Responsible waste collection                                             46
Business model canvas 12: Mushroom cultivation                                                     50
Business model canvas 13: Rearing insects                                                          53
Business model canvas 14: Swine feed                                                               56
Business model canvas 15: Nonfood products                                                         59
Business model canvas 16: On-site compost or energy recovery                                       63
Business model canvas 17: Social community composting                                              66
Business model canvas 18: Off-site compost and energy recovery                                     69

                                                                                                    v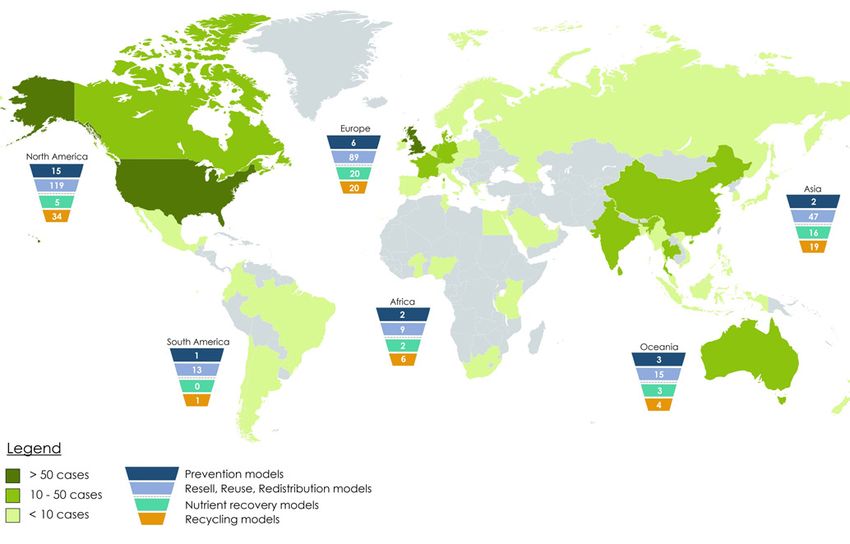
ACRONYMS AND ABBREVIATIONS
ABBREVIATION   DEFINITION

AD             Anaerobic Digestion
B2C            Business-to-Consumer
CSR            Corporate Social Responsibility
FAO            Food and Agriculture Organization of the United Nations
FLW            Food Loss and Waste
HDI            Hasiru Dala Innovations
ICT            Information and communications technology
MaGIC          Malaysian Global Innovation & Creativity Centre
MSW            Municipal Solid Waste
MT             Metric Tons
n.d.           No date
NPO            Nonprofit organization
PPP            Public-Private Partnership
R&D            Research and Development
SDG            Sustainable Development Goal
SWOT           Strengths, Weaknesses, Opportunities, and Threats
UK             United Kingdom
UN             United Nations
US             United States of America
WRAP           Waste & Resources Action Programme

vi
SUMMARY
The number of people living in cities is expected to reach   Systems for monitoring and management of excess food
68% of the global population by 2050. Food security for      and food waste were most prevalent in prevention
growing populations is an increasing concern. Currently      organizations. For redistribution, creating connections
one-third, or 1.3 billion metric tons of food is lost or     among stakeholders through platforms to form a secondary
wasted along the food value chain, which results in not      market and providing logistical services to move excess food
only loss of calories and nutrition available for human      to charities were the most prominent. Common recovery
consumption, but also valuable inputs required for its       methods include transforming excess food and food waste
production and distribution.                                 into both food and non-food products. For example, utilizing
                                                             food suitable for human consumption in cafés, soup kitchens
Target 12.3 of the United Nations Sustainable                or preserved products, and waste converted into non-food
Development Goals (SDGs) is to ‘halve per capita             products such as bio-plastics. If none of these options is
global food waste at the retail and consumer levels          available, recycling pathways such as processing for animal
and reduce food losses along production and supply           feed, compost or energy recovery are available.
chains, including post-harvest losses, by 2030’. This
is relevant for both low-middle and high-income              These models could be supported by policies and
countries, where food loss and waste occurs at all           regulations which are often missing at the national
points along the supply chain, from postharvest              and local levels. There has been some success by
production to consumption. The effects of reductions         governments        in    creating    supportive   enabling
in food loss and waste can be seen socially,                 environments for the activities of businesses to grow and
environmentally and financially.                             succeed, such as standardizing the production of animal
                                                             feed in Japan and tax deductions for donations, enabling
Over 400 businesses were analyzed for this study to          redistribution efforts in the United States.
understand the types of entities working to reduce
food waste. Subsequently, 18 business models were            Ultimately, the success of these initiatives requires
developed to provide greater insight into proven             education and training for staff as well as consumers,
models utilizing excess food or waste as part of their       and raising awareness among policy-makers of the need
operations, and where this occurs along the supply           to include the reduction of food loss and waste on the
chain. The categorization followed the Food Waste            national agenda. An enabling environment can increase
Recovery (and Mitigation) Hierarchy and is presented         the possibilities for the prevention, redistribution, recovery
using business model canvas flows.                           and recycling of excess food and food waste.

                                                                                                                         vii
BUSINESS MODELS FOR URBAN FOOD WASTE PREVENTION, REDISTRIBUTION, RECOVERY AND RECYCLING

1. OBJECTIVE AND SCOPE OF THE STUDY
This report aims to capture existing and emerging food       articles and previous lists compiled by organizations
waste reduction strategies and initiatives with a focus on   such as Food Tank (https://foodtank.com) and
identifying innovative business models as references for     ReFED (https://refed.com). The businesses were
good practice to inspire entrepreneurs to reduce food        then categorized based on their objectives and the
loss and waste in their current operations.                  strategies they used to achieve them. The approach
                                                             was limited to those businesses with websites in
Eighteen different business models were identified,          English so the database is not comprehensive, but
analyzed from over 400 businesses that are working           rather an indicative snapshot of the business models
with the overall aim of reducing food waste. The             found globally at the time.
business models focus on urban food waste reduction,
from processing to consumption. The businesses were          Figure 1 shows the breakdown of food businesses by
identified through an Internet-based search using            the categories developed for this report. The overlapping
keywords such as ‘food waste reduction business’,            activities of many businesses made a clear categorization
‘food upcycling’ and ‘food recycling’. A database was        difficult in some cases. Therefore, the selected approach
created using journal articles, reports, newspaper           presents one option where others are possible.

                                                                  Measurement

                                                                  Redistribution

                                                                  Resell

                                                                  Value addition

                                                                  Waste collection

                                                                  Recovery of nutrients and other resources

                                                                  Recycling

FIGURE 1. FOOD WASTE BUSINESSES PER DEFINED CATEGORY OF INTERVENTION AREA.

The maps in this report show the locations where these       web presence. In this sense, the maps should only be
business cases were found. As the food waste sector is       seen as an indication if, for example, particular models
very dynamic, there will be many more cases which our        are also common in the Global South or predominantly
search did not capture, in particular cases with limited     in the Global North.

                                                                                                                     1
RESOURCE RECOVERY & REUSE SERIES 19
2. FOOD WASTE AND ITS GLOBAL IMPLICATIONS
Currently, 55% of the world’s population lives in urban for their populations. Furthermore, for low-middle income
areas. By 2050, the number of people living in cities is countries there are public health and safety issues
projected to grow by 2.5 billion, reaching 68% of the stemming from inadequate waste management. Landfill
global population (United Nations 2019). Ensuring food slides have killed over 30 people in Colombo, Sri Lanka,
security for growing populations is already a concern. The and 100 in Addis Ababa, Ethiopia; these are reminders
current food production system has been identified as that the current linear system of resource use is not only
a major contributor to global challenges in this context. unsustainable and damaging for ecosystems, but a public
Multiple inputs, such as land, water, fossil fuels and human health hazard and danger to the public. Organic waste
labor, are required for the production, transportation and constitutes a significant portion of any municipal solid waste
processing of food before consumption. Along the value (MSW) stream and can reach over 50% in low-middle income
chain, approximately 1.3 billion metric tons (MT) of food countries (Hoornweg and Bhada-Tata 2012). Currently,
remain unconsumed annually (FAO 2011) worth USD 1 less than 2% of available nutrients is recovered from cities
trillion (FAO 2015). This implies the loss of not only valuable (Ellen MacArthur Foundation 2019). Thus, the availability of
and necessary calories and nutrients, which if properly large amounts of unused resources demonstrates a huge
utilized could feed the estimated 1 billion malnourished potential for waste recovery and recycling.
people living today (Naylor 2011), but concomitantly the
waste of resources used in global food cultivation, i.e. The abundance of food waste, not only at the end, but
freshwater (24%), cropland (23%) and fertilizer (23%) along all points in the current supply chain provides
(Kummu et al. 2012). opportunities for resource recovery and reuse. In high-
income countries, advanced levels of loss occur during
Target 12.3 of the United Nations Sustainable Development consumption, whereas in low-middle income countries,
Goals (SDGs) is to ‘halve per capita global food waste at the levels of waste are higher in postharvest activities
the retail and consumer levels and reduce food losses and distribution (Rezaei and Lui 2017). By identifying
along production and supply chains, including post- the reasons for waste at each stage of the supply
harvest losses, by 2030’. As food loss and waste reduction chain, targeted solutions can be identified to address
is described as a ‘triple win’ situation (Flanagan et al. 2019), the particular cause of waste. This report focuses on
this target is extremely relevant for both low-middle and food waste, defined as food wastage that occurs at the
high-income countries, where reducing food loss and levels of distribution and retail, restaurants and catering,
waste along the supply chain can have immediate and and domestic consumption. Figure 2 displays selected
significant impacts environmentally, socially and financially challenges resulting in food waste.
Food Wastage
Food Loss Food Waste
Agricultural Restaurants
Distribution Domestic
production Processing and
and retail consumption
and harvest catering
Produce does not Over-preparation
meet specifications Large portion sizes
Over-ordering, Concerns about possible
overstocking risks
Produce passes Consumer does not like the
expiry date without food
being sold Food forgotten/left to spoil
FIGURE 2. CLASSIFICATION OF FOOD WASTAGE INTO FOOD LOSS AND FOOD WASTE.
2BUSINESS MODELS FOR URBAN FOOD WASTE PREVENTION, REDISTRIBUTION, RECOVERY AND RECYCLING
References
Ellen MacArthur Foundation. 2019. Cities and circular economy for food. Available at
https://www.ellenmacarthurfoundation.org/assets/downloads/Cities-and-Circular-Economy-for-Food_
280119.pdf
FAO (Food and Agriculture Organization of the United Nations). 2011. Global food losses and food waste: Extent,
causes and prevention. Rome: FAO. Available at http://www.fao.org/3/a-i2697e.pdf
FAO. 2015. Global initiative on food loss and waste reduction. Rome: FAO. Available at http://www.fao.org/3/a-i4068e.
pdf
Flanagan, K.; Robertson, K.; Hanson, C. 2019. Reducing food loss and waste: Setting a global action agenda.
Washington, DC: World Resources Institute. Available at https://www.wri.org/publication/reducing-food-loss-
and-waste-setting-global-action-agenda
Hoornweg, D.; Bhada-Tata. P. 2012. What a waste: A global review of solid waste management. Urban Development
Series Knowledge Papers No. 15. Washington, DC: World Bank. Available at http://documents1.worldbank.
org/curated/en/302341468126264791/pdf/68135-REVISED-What-a-Waste-2012-Final-updated.pdf
Kummu, M.; de Moel, H.; Porkka, M.; Siebert, S.; Varis, O.; Ward, P.J. 2012. Lost food, wasted resources:
Global food supply chain losses and their impacts on freshwater, cropland, and fertiliser use.
Science of the Total Environment 438: 477-489. https://doi.org/10.1016/j.scitotenv.2012.08.092
Naylor, R. 2011. Expanding the boundaries of agricultural development. Food Security 3: 233.
https://doi.org/10.1007/s12571-011-0123-6
Rezaei, M.; Lui, B. 2017. Food loss and waste in the food supply chain. Feature articles. Nutfruit 71(2): 26-27.
Available at http://www.fao.org/3/a-bt300e.pdf
United Nations. 2019. World urbanization prospects: The 2018 revision. ST/ESA/SER.A/420. New York: United Nations,
Department of Economic and Social Affairs, Population Division. Available at https://population.un.org/wup/
Publications/Files/WUP2018-Report.pdf
3. BUSINESS MODELS FOR FOOD WASTE
MANAGEMENT
In this report, the term ‘business’ does not limit the by generating revenue. Dedicated to solving human
scope of models to profit-maximizing companies; rather, problems, they reinvest generated revenue in their own
it also encompasses not-for-profit organizations and operational affairs to sustain themselves and donate
social businesses. The latter are particularly relevant in additional profit to other good causes (Yunus 2010). This
the field of food waste reduction. These businesses are reduces or removes the need for fundraising compared
directed by socially orientated goals which they achieve to traditional charitable organizations.
For-profit organization Business: Aims to maximize profit for growth and distribute income among
shareholders, leaders or members.
Nonprofit organization (NPO) Nongovernmental organization, charity: Aims to solve social problems with
the support of funds and tax exemption benefits.
Social business Aims to solve social problems, while generating profit to be financially self-
sustaining and reinvesting profits back into the mission.
3RESOURCE RECOVERY & REUSE SERIES 19
The business models are presented using the framework The business models in this report will be categorized
of the business model canvas, which enables analysis of following the Food Recovery Hierarchy (Figure 4).
the requirements of an entrepreneur or business to achieve This hierarchy ranks possible uses for food waste by their
its value proposition. While used for specific business benefits for the environment, society and the economy.
organizations, it has been used here as a framework for The primary goal of these efforts should be to reduce the
the general requirements for businesses and possible generation of excess food and food waste in all operations
revenues and costs. Therefore, the business models of the value chain. The most preferable approach is
generated from an analysis of global models currently the redistribution of edible excess food for human
in operation, provide basic guidelines and inspiration for consumption and thereafter recovering excess food
interested stakeholders. and waste as value-added.
The business canvas and rankings are guided by the work of The organization type of business models could also
Osterwalder and Pigneur (2010). Also included are social and encompass the public sector, either in partnerships with
environmental costs and benefits to evaluate any resulting the private sector (public-private partnership [PPP]) or as
externalities (see Table 1) as presented, for example, by public sector companies themselves. While this report
Otoo and Drechsel (2018). The basic structure of the canvas does not cover in detail the business models as part of
has been altered to display a flow to assist the reader in these organization types, Table 2 illustrates which models
illustrating the connections between each section. A brief are most common in which type(s).
Strengths, Weaknesses, Opportunities and Threats (SWOT)
analysis (Figure 3) has been added to each model.
Mos
Prevention
t pre
Food waste reduction at source
ferre
d
Resell, Reuse, Redistribution
of food for human consumption
Nutrient recovery
of food waste for animals and
industrial use
Lea
FIGURE 3. SWOT ANALYSIS FRAMEWORK.
Recycling
st p
through composting or
refe
anaerobic disgestion
red r
FIGURE 4. FOOD RECOVERY HIERARCHY.
SOURCE: MODIFIED FROM USEPA 2020.
4BUSINESS MODELS FOR URBAN FOOD WASTE PREVENTION, REDISTRIBUTION, RECOVERY AND RECYCLING
TABLE 1. BUSINESS MODEL CANVAS.
Key partners Key activities Value propositions Customer Customer
relationships segments
Who are the Which key activities What bundle of What type of For whom is
key partners? are required for: products and relationships have the business
- value services is offered to be established creating value?
Which key propositions? to each customer and maintained?
resources are - channels? segment? Which jobs do
acquired from - customer How are they they really want
which partners? relationships? What added value integrated with to get done?
- revenue is being delivered the rest of the
Which key activities streams? to the customer? business model? Who are the
do partners most important
perform? Which one of customers?
the customers’
Key resources problems is solved? Channels
Which key Which customer Through which
resources are need is satisfied? channels do
required for: your customer
- value What is unique segments wants
propositions? about the offer to be reached?
- channels? (compared to the
- customer competition)? How are you
relationships? integrating them
- revenue with customer
streams? routines?
Cost structure Revenue streams
What are the most important costs inherent in the For what value are the customers willing to pay?
business model?
For what do they currently pay?
Which key elements drive the costs?
How are they currently paying?
How much does each cost item contribute to
overall costs? How much does each revenue stream contribute to
overall revenues?
Social and environmental costs Social and environmental benefits
What are the potential environmental risks of the What potential benefits could the business model
business? bring to the environment?
What are the potential health risks for workers and Can the business model improve/reduce health
the wider society? hazards?
Does it provide jobs?
5RESOURCE RECOVERY & REUSE SERIES 19
TABLE 2. SUITABLE ORGANIZATION TYPES FOR THE BUSINESS MODELS PRESENTED.
Public Private PPP NPO Models
3, 5, 11, 18 2, 3, 4, 5, 6, 5, 11, 13, 14, 3, 4, 5, 17 I. Tracking and analytical software for managing
food
7, 8, 9, 10, 16, 18 II. Measuring and analyzing food waste
11, 12, 13, III. Community fridge
14, 15, 16, IV. Connection platform
18 V. Logistics services
VI. Box subscriptions
VII. Online secondary market
VIII. Store secondary market
IX. Restaurants serving rescued food
X. Food upcycling and preservation
XI. Responsible waste collection
XII. Mushroom cultivation
XIII. Rearing insects
XIV. Swine feed
XV. Nonfood products
XVI. On-site compost or energy recovery
XVII. Social community composting
XVIII. Off-site compost and energy recovery
6BUSINESS MODELS FOR URBAN FOOD WASTE PREVENTION, REDISTRIBUTION, RECOVERY AND RECYCLING
Businesses can only flourish with an enabling regulatory
and financial environment, supported by awareness FAO: DO GOOD SAVE FOOD!
creation on the challenge they address.
The Food and Agriculture Organization of the United
Nations (FAO) and the International Food Waste
The most common methods to create awareness are
Coalition joined forces in developing the ‘Do Good
campaigns and voluntary agreements. For example, the
Save Food’ series of teaching guides targeted at
campaign “Love Food, Hate Waste” run by the charity
children of four different age groups.
Waste and Resources Action Programme (WRAP), in the
United Kingdom (UK), encouraged lower waste levels by These guides seek to promote awareness of the
offering solutions for leftovers and increasing the shelf- economic, social and environmental consequences
life of produce. The Intermarché supermarket campaign of wasting food, advantages of preventing food
in France used posters of ugly fruits and vegetables to waste, actions that children can take to reduce food
promote the sales of unattractive produce. Both were waste, and good habits that they can develop and
successful in reducing levels of waste at the household introduce to their friends, families and communities
and retail levels. Such campaigns not only increase to reduce food waste.
consumer understanding and change behavior, but
Source: https://internationalfoodwastecoalition.org/do-good-
also enable dialogue and the greater acceptance of
save-food/
products and services created from food waste. Voluntary
agreements are directed at businesses that sign up
to nonbinding, voluntary commitments to reduce their
current levels of food waste. When legislation is not includes loans, green low-interest loans, crowdfunding
feasible or employed, both campaigns and voluntary and venture capital. In 2018, in the US, start-ups
agreements can create change by engaging stakeholders reducing food waste raised over USD 125 million
via these frameworks. (ReFED 2018) from venture capital, where initiatives
focused on recycling or prevention technologies such
Where possible, policies at local and national levels can as connection platforms. Public capital encompasses
create an environment that supports efforts to reduce food grants or subsidies from governments and local
wastage levels. For entrepreneurs or businesses investing authorities. These funds are most often available
in equipment, infrastructure or research, these policies are in countries with targets for reducing food loss and
a commitment from governments which can give greater waste. This financing tends to be for recycling solutions
confidence in undertaking the investments necessary. In to meet targets for waste management or landfill
making these commitments, it is possible for a dedicated reduction, to subsidize the cost of biogas or compost
state or national government to achieve targets by plants, and increasingly, for redistribution purposes.
improving or enabling more desirable behavior. Table 3 Philanthropic funding largely supports redistribution
gives an overview of legal instruments that have been programs to transport food to charities or foodbanks;
enacted globally to reduce food waste. The incentives however, there are growing levels of funding directed at
range between creating possibilities for encouraging preventative measures such as the Bill & Melinda Gates
waste reduction through tax deductions and subsidies Foundation providing a grant of USD 100,000 to Apeel
or fines and bans to discourage waste completely. In the Sciences Inc. for their development of an edible peel
US, tax deductions for donations encourage businesses to increase the shelf-life of fruits and vegetables (www.
to donate waste whereas in France supermarkets are apeel.com/science).
banned from disposing of waste in landfills. These
approaches target different stakeholders and sources of Other support for food waste reduction start-ups comes
waste in the supply chain. from accelerator programs, designed to support start-ups
by refining their business plans, networking, scaling, and
Business models across the supply chain utilize a in some cases, providing access to low-interest loans or
plethora of financing mechanisms to achieve their equity investments. Numerous accelerators accept food
goals. The wide scope of the food waste issue requires waste reduction start-ups and some, such as Maersk and
a combination of private, public and philanthropic ReFED, have a specific program for food waste reduction
funding to achieve scaled solutions. Private financing businesses (Gunders 2018; ReFED 2018).
7RESOURCE RECOVERY & REUSE SERIES 19
TABLE 3. LEGAL INSTRUMENTS AND INCENTIVES TO REDUCE, REUSE OR RECYCLE FOOD WASTE.
Policy Explanation
Tax incentives Businesses can access tax deductions or tax credits for food
donated to charities or food banks. These are financial incentives for
businesses to divert excess food for human consumption.
Subsidies or grants for research Subsidies for research and development (R&D) and large infrastructure
and infrastructure projects by local authorities to support initiatives.
Landfill taxes Taxes on landfills for organic waste raise the price of landfill disposal,
making it a less attractive disposal option.
Landfill bans Banning organic waste from disposal in landfills. Alternative methods
of disposal are required for all food waste such as edible surplus to
redistribution to charities and inedible waste to compost or anaerobic
digestion. Fines for noncompliance.
Liability protection Protecting donors in the donation of excess edible food from the risk
of legal and criminal liability if measures are taken to ensure the safe
transfer of the donation. Fear of liability issues is a commonly cited
reason for not donating food.
Targets and measuring Measuring waste levels and setting targets for reduction allow for
more accurate management and aim for initiative implementation.
Data for waste levels enable better modelling to facilitate optimal
strategy decisions (Pearce and Berkenkamp 2017).
Food waste as swine feed Enabling the safe use of food waste as animal feed reduces reliance
on alternative feeds such as soybean. This can reduce costs for
farmers and the environmental impact of feed.
Simplified redistribution framework Recommendations and clear guidelines that describe how to donate
excess food to donors and recipients. Advice on how to safely
transport the food and organize logistics.
Pay-as-you-throw pricing for waste Waste is priced per unit such as volume or weight. The more waste
produced, the higher the cost of disposal.
References
Gunders, D. 2018. First class of food waste fighters graduate from Maersk accelerator. Forbes, July 9, 2018. Retrieved
16 April, 2019, from https://www.forbes.com/sites/danagunders/2018/07/09/maersk-graduates-first-food-waste-
fighters-from-accelerator/#3780ed58ba56.
Osterwalder, A.; Pigneur, Y. 2010. Business model generation: A handbook for visionaries, game changers, and
challengers. Hoboken, New Jersey: Wiley.
Otoo, M.; Drechsel, P. 2018. Resource recovery from waste: Business models for energy, nutrient and water reuse in
low-and middle-income countries. UK: Routledge.
Pearce, A.; Berkenkamp, J. 2017. Assessing corporate performance on food waste reduction: A strategic guide for
investors. Available at https://www.nrdc.org/sites/default/files/corporate-performance-food-waste-reduction-
ib.pdf
ReFED. 2018. 2018 U.S. food waste investment report: trends in private, public, and philanthropic capital including a
special report on foundation funding. Available at https://www.refed.com/downloads/ReFED-2018-US-Food-
Waste-Investment-Report.pdf
USEPA (United States Environmental Protection Agency). 2020. Sustainable management of food. Retrieved 25
January, 2021, from https://www.epa.gov/sustainable-management-food
Yunus, M. 2010. Building social business. The new kind of capitalism that serves humanity’s most pressing needs. New
York: Public Affairs.
8BUSINESS MODELS FOR URBAN FOOD WASTE PREVENTION, REDISTRIBUTION, RECOVERY AND RECYCLING
4. MODELS FOR FOOD WASTE REDUCTION
4.1 Measurement This model can be utilized in the hospitality sector for
The most preferred method for reducing excess food and both inventories as well as wasted food. Systems track
waste is prevention. Successfully addressing the issue the type of food wasted and reasons for the waste. This
involves the prioritization of mitigation measures. One of information provides insights on a microscale to adjust
these is to measure the levels of loss and waste, recalling current practices on a dish-by-dish basis if desired. For
‘what gets measured, gets managed’; implementing steps households, applications (apps) track grocery purchases,
to measure waste levels reveals the nature of the type and provide nudges for products nearing expiry and recipe
amount of waste for informing more accurate decision- ideas for using these products. Additional practices that
making. “Data provides insight into: why losses occur in consumers can include to prevent food waste are planning
operations; which areas provide the biggest opportunity shopping in advance and becoming more familiar with the
for improvement; and how to continuously make progress difference between ‘use by’ and ‘best-before’ on labels
towards goals” (Spoiler Alert 2017). Food businesses can (Abeliotis et al. 2014; ICF 2018).
develop inventories and waste-tracking systems specifically
to meet these needs. As the first step to reducing food loss and waste,
understanding where waste occurs in the business is
This section describes one business model, ‘Surplus and necessary to incorporate new strategies into workflows,
Waste Tracking and Analytical Software’, which is applied forecast sales and ultimately offer discounts to sell
to multiple stakeholders. For wholesalers and retailers, more of the goods. In particular, there is a short time
better tracking of stocks and products nearing expiry limit for the shelf-life of perishable products and this
allows more accurate forecasting from analyzing trends model offers cost savings to stakeholders through the
and applying discounts on excess food to reduce losses. reduction of waste.
4.1.1 Model I: Tracking and Analytical Software for Managing Food
Brief Software that records inventory to ensure efficiency in ordering and reductions
in wasted produce (Business Model Canvas 1)
Waste stream Expired food products
Value-added product Automated date and location tracking to optimize discounting and product
movement
Key stakeholders Processors, retailers, consumers
Geography Urban, peri-urban (see also Figure 5)
Profit objective For-profit
Organization type Private
The Business Model The primary goal of this model is to provide support
for businesses in reducing their levels of food waste by
Expiry date checking and product rotating are time- providing smart solutions. By facilitating easy tracking
consuming activities for employees of large-scale retail of inventory and waste, the software enables the
entities and therefore cost-intensive. The expiry of effective use of data for discounts or offers to prevent
processed food items while on shelf display has negative products becoming waste. This software is used by
impacts on the food business owing to customer both for-profit and nonprofit businesses, whereas the
complaints and lost revenue from unsold stock, plus creators of the software tend to be private, for-profit
eventual costs from the disposal of such items. businesses. The businesses creating the software
9RESOURCE RECOVERY & REUSE SERIES 19
require many inputs including skilled labor such as as they enter the facility and where they are placed
software engineering, finance and marketing expertise. in-store to record their expiry date and location in the
A high level of research and development is also required warehouse or store. The system then sends alerts or
to launch such a system, where various entities have notifications to managers about products nearing
partnered with existing businesses such as supermarkets expiry. The system can estimate discounts, based on
to test and redevelop the program so that it satisfies the previous sales. This can determine which products will
needs of the partner (Table 4). actually sell if discounted and how large the discount
should be. These early notifications enable preventive
The inventory and tracking system is most often procedures. In addition to discounts, the system can
utilized by large retailers and food distributors. After determine if the produce should be donated or sold to
the installation process, all products can be scanned third parties to ensure the consumption of the product.
TABLE 4. SWOT ANALYSIS OF THE TRACKING AND ANALYTICAL SOFTWARE FOR MANAGING FOOD MODEL.
HELPFUL HARMFUL
• Strong client relationships • High adaptability required for every client
INTERNAL
• Marketing • High cost of product
• Employee engagement
• Effective training (digital literacy)
• Previous client satisfaction and waste • Capacity to implement change
EXTERNAL
reduction • Competition
• Greater awareness of the food waste issue • Poor internet connectivity
• Taxes and subsidies supporting food waste
reduction
10BUSINESS MODELS FOR URBAN FOOD WASTE PREVENTION, REDISTRIBUTION, RECOVERY AND RECYCLING
Provider of Food
Inventory Management Revenue
Key partners Software
Implementation fee
Investors Annual licensing fee
Value Proposition
Food stock and expiry
dates monitoring
Key resources
Notification and alert Customer segments
Capital system Manufacturers
Office space Warehouse operators
Hardware Data reporting
Retailers
Skilled labor
Key Activity 1
Software development Distribution channels
Costs
Fairs
Rent News
Salaries Key Activity 2 Social media
Website
R&D Platform Awareness creation
maintenance on the need for food Testimonials
waste prevention
Marketing and sales
Customer relations
Key Activity 3
Installation assistance Dedicated personal
assistance during
installation
Automated self-service in
Key Activity 4
operations thereafter
Connection to donation
or recycling partners
Social costs and benefits Environmental costs and benefits
+ Facilitation of donation operations + Reduced waste in landfills
+ Job creation
- Resource requirements for hardware
+ Cost savings for food businesses and
consumers
BUSINESS MODEL CANVAS 1: TRACKING AND ANALYTICAL SOFTWARE FOR MANAGING FOOD.
11RESOURCE RECOVERY & REUSE SERIES 19
Case Example relationship management and providing software is
what makes the impact of Spoiler Alert so effective,
Spoiler Alert, United States and the impact is growing.
Spoiler Alert is a business focused on data and
connectivity. It was founded in 2015 and currently Spoiler Alert’s vision is to build a company that
employs thirteen people, seven of them being software maximizes profitability, sustainability and efficiency
engineers who are supported by the nation’s leading food, across global supply chains. The company
agriculture and supply chain investors. acknowledges that its success with clients has more
far-reaching implications than its own financial and
Spoiler Alert started as an online marketplace and operational improvements – “contributing to a more
quickly perceived a strong demand for food waste sustainable world by tackling some of the greatest
but lack of providers. After recognizing this mismatch environmental and social challenges of our time”. In
in November 2016, Spoiler Alert introduced the achieving this the company builds technology that
enterprise’s software model. It is designed to work empowers the world to minimize food waste.
as a complement to existing inventory management
software of food distribution businesses so that Model Variation: Apps to Manage
they are able to gain a clearer insight through the Groceries for Consumers
aggregated data into their food recovery, donation
and waste reduction efforts. In addition to the data These are apps through which consumers record their
dashboard, businesses have access to their networks purchases to keep track of what is in their cupboards
consisting of more than 200 foodbanks and 200 at home to prevent purchasing duplicate items and to
discount retailers and even more organic recycling receive notifications about expiration dates. The apps
partners on the platform. Thus, they facilitate the reduce food waste by allowing users to ‘see’ if they already
donation process to organizations, discounted sales to have a product while at the supermarket. The user updates
other companies or transportation to organic-recycling the app to reflect the addition or consumption of any
initiatives. Interested parties can communicate via the product. Value-added features include a shopping list
Spoiler Alert network in real time. The Spoiler Alert within the app and multi-user capabilities or recipes to
software sends out notifications to promote moving use items that are nearing their expiry date. App examples
of products close to expiry. The combination of are 222 Million Tonnes, Eatby, and Prep & Pantry.
FIGURE 5. IDENTIFIED EXAMPLES OF BUSINESS CASES OF MODEL I.
12BUSINESS MODELS FOR URBAN FOOD WASTE PREVENTION, REDISTRIBUTION, RECOVERY AND RECYCLING
4.1.2 Model II: Measuring and Analyzing Food Waste
Brief Software that tracks the quantity and reason for wasted produce, providing insights and
reports for better decision-making (Business Model Canvas 2)
Waste stream Prepared meals
Value-added product Smart scale connected to a software system to analyze waste
Key stakeholders Restaurants, hotels, canteens
Geography Urban, peri-urban (see also Figure 6)
Profit objective For-profit
Organization type Private
The Business Model from the bin and software providers as to whether this
Excess food in the hospitality sector is generated from food could have been recovered for an alternative use,
either buffets or events where less meals are consumed such as transformation into another meal, donation or
as forecasted. Often this food is discarded as it takes receiving benefit from value-added processing.
a significant amount of time and resources to find
alternative ways of handling it. This is a source of From the collected data, trends and reports are
monetary loss to the food business. generated to inform chefs and decision-makers
how to adjust their own operations based on where
The software system consists of a digital scale, connected the highest levels of waste occur. For example, a
to a touchscreen monitor to record not only the weight but particular dish that is consistently overproduced or
also the reason for the wastage. In addition, an ‘intelligent under consumed in order to more accurately forecast
camera’ is installed above the bin, where the discarded demand and prepare food accordingly. Identified
food is captured. This not only enables accurate impact cases have confirmed that awareness of discarded
calculations such as calories, cost and resources wasted quantities has led to a reduction of waste already.
by the technology, but also provides recommendations Table 5 shows a SWOT analysis of the model.
TABLE 5. SWOT ANALYSIS OF THE MEASURING AND ANALYZING FOOD WASTE MODEL.
HELPFUL HARMFUL
• Strong client relationships • High adaptability required for every client
INTERNAL
• Marketing • High cost of product
• Employee engagement
• Effective training (software use)
• Previous client satisfaction and waste • Capacity to implement change
EXTERNAL
reduction • Competition
• Greater awareness of the food waste issue • Different cultural practices of food
• Taxes and subsidies supporting food waste handling
waste reduction
13RESOURCE RECOVERY & REUSE SERIES 19
Provider of Food
Key partners
Inventory Management Revenue
Software Implementation fee
Investors Annual licensing fee
Value Proposition
Food stock and expiry
dates monitoring
Key resources
Notification and alert Customer segments
Capital system Hoteliers
Office space Restaurant & canteen
Hardware Data reporting
operators
Skilled labor
Key Activity 1
Software development Distribution channels
Costs
Fairs
Rent News
Salaries Key Activity 2 Social media
Awareness creation Website
R&D Platform
maintenance on the need for food Testimonials
waste prevention
Marketing and sales
Customer relations
Key Activity 3 Dedicated personal
Installation assistance assistance during
installation
Automated self-service in
operations thereafter
Social costs and benefits Environmental costs and benefits
+ Facilitation of donation operations + Reduced waste in landfills
+ Job creation
- Resource requirements for hardware
+ Cost savings for food businesses and
consumers
BUSINESS MODEL CANVAS 2. MEASURING AND ANALYZING FOOD WASTE.
14BUSINESS MODELS FOR URBAN FOOD WASTE PREVENTION, REDISTRIBUTION, RECOVERY AND RECYCLING
Case Examples talking points for weekly meetings with the kitchen staff
(www.leanpath.com). In the case of the University of
Leanpath (United Kingdom, United States, Spain and Illinois, 63% of its food waste was reduced after working
Australia) with Leanpath.
Leanpath was founded in 2004 and has expanded
its impact scale since then to more than 20 countries Winnow (United Kingdom)
around the world, working with thousands of commercial Founded in 2013, Winnow is currently operating from
kitchens. Leanpath invented a food waste tracking five global offices and is installed or contracted in more
technology with a ‘complete food waste prevention platform’. than 1,000 institutions in about 40 countries (Figure 5).
Using a large database of food waste images and artificial It is a leading food management solution for contract
intelligence, the waste classification is fast and accurate. catering, hotels and casinos, quick service restaurants,
supermarkets and cruise ships. It connects commercial
The Leanpath website offers free resources and webinars kitchens all over the world to the cloud, allowing them
as well as several case studies from large multinational to record and analyze exactly what food items are
clients such as Google and IKEA. Leanpath brings discarded. Its technology helps to identify and prevent
together hardware (scales, cameras, tablets and displays) avoidable waste, where most food thrown away has value
with its software that enables managers to track all food and could be reused to make something else. The system
waste events in their kitchens. The analytical program takes photos of wasted food as it is thrown away and,
allows clients to analyze the drivers of their food waste using the images, the machine learns over time the type
with a high degree of granularity. An integrated dashboard of food in the bin for automatic data collection (www.
provides summaries, participation and trend reports and winnowsolutions.com)
FIGURE 6. IDENTIFIED EXAMPLES OF BUSINESS CASES OF MODEL II.
15RESOURCE RECOVERY & REUSE SERIES 19
References
Abeliotis, K.; Lasaridi, K.; Chroni, C. 2014. Attitudes and behaviour of Greek households regarding food waste
prevention. Waste Management and Research 32(3): 237-240. https://doi.org/10.1177/0734242X14521681
EatBy App. n.d. Retrieved March 10, 2020 from http://www.eatbyapp.com/
ICF (Inner City Fund). 2018. Market study on date marking and other information provided on food labels and food
waste prevention: Final report. Luxembourg: European Commission. Available at
https://circulareconomy.europa.eu/platform/sites/default/files/market_study_on_date_marking.pdf
Prep & Pantry. n.d. Home. Retrieved March 10, 2020 from http://prepandpantry.com/
Spoiler Alert. 2017. A strategic guide for using data to drive food loss and waste reductions. Retrieved April 1, 2021
from https://info.spoileralert.com/download-strategic-guide-using-data-to-reduce-food-loss-and-waste
222 million tons. Retrieved March 10, 2020 from https://222milliontons.com/app/
4.2 Redistribution
Following the Food Recovery Hierarchy, if food waste Food waste reduction during Ramadan
cannot be prevented, the subsequent most preferable
strategy for food loss and waste reduction is through the Every year, during festive seasons such as
redistribution of excess food for human consumption, Ramadan, tonnes of food end up in the dustbin.
wherever the infrastructure is available to do so safely. Based on statistics by the Malaysian Solid Waste
Procedures, guidelines and regulations to do so differ and Public Cleansing Management Corporation
at country levels. The main challenge to overcome (SWCorp), about 4,000 MT of edible food are thrown
is the logistical gap between the food donor and the away in landfills every day during Ramadan, and
recipient. Due to the perishability of many foods, the numbers are increasing every year. This amount
methods of redistribution must be innovative to of food waste could feed 2.97 million people three
overcome the challenges associated with times daily. To help combat the issue, SWCorp has
transporting and storing available surplus to ensure initiated a food waste reduction program dubbed
it reaches the intended recipient safely. ‘Love Food Hate Waste’ at Ramadan bazaars in
Engaging people, transport and communications is every state. The program aims to study the amount
key for successful redistribution operations. of food surplus from Ramadan bazaars and save
the excess food in a food bank for channeling to
Around the world, new initiatives are forming, enabled by underprivileged students, for example.
communities as well as entrepreneurs, to create models
which overcome the barriers of redistribution. At the
community level, food sharing extracts, street markets
and community fridges are common worldwide in both tax deductions for donations in the US and France as
low- and middle-income countries. The increasing trend of well as landfill bans or taxes. These provide incentives
community fridges provides access to meals and donated for alternative uses and potential revenue streams for
produce for anybody, regardless of status or need. This entrepreneurs.
initiative overcomes logistical gaps in redistribution
by managing a central location for the collection and For-profit models are increasingly common for business-
distribution of excess food. to-business and business-to-consumer platform
connection models. On the other hand, business-to-
Volunteer organizations are integral to redistribution donation platforms are more often nonprofit. Each of
networks. With minimal inputs, many have achieved these models provides methods of moving excess food
huge milestones in delivering millions of meals to their between donors and recipients as well as buyers and
clients. These initiatives operate with little to no funding sellers. Each model in this section provides a solution
but achieve their work through partnerships and the that can be suited to the needs and resources available
hard work of local volunteers. While traditionally, and in a particular community. Creating solutions to overcome
largely still a nonprofit activity, for-profit models for logistical gaps enables access to food waste and
the redistribution of food are increasingly becoming therefore provides meals to various stakeholders in the
evident. These are enabled by sound policies such as local community.
16BUSINESS MODELS FOR URBAN FOOD WASTE PREVENTION, REDISTRIBUTION, RECOVERY AND RECYCLING
4.2.1 Model III: Community Fridge
Brief A fridge where excess food is placed by donors for recipients (Business Model Canvas 3)
Waste stream Donated food from retailers, restaurants, consumers
Value-added product Provides access to food for the community
Key stakeholders Retailers, restaurants, consumers
Geography Urban areas
Profit objective Nonprofit
Organization type NPO, public
The Business Model is vital. Their roles will vary but should address cleaning
and sorting, placing produce into the fridge, measuring
The model for community fridges is nonprofit and donation types and amounts, establishing funding sources,
socially driven to solve the issue of local hunger as well engaging with suppliers and consumers, and informing and
as to reduce food waste. Closing the logistical gap for coordinating with stakeholders. Additional responsibilities
redistribution between food donors and recipients is include any legal or safety requirements such as creating
achieved by installing a community fridge. Placed in an guidelines for donations, managing liability insurance or
easily accessible location, the fridge acts as a central point, registering as a food business. These will depend on the
for which the placing and taking of donations do not have country in which the fridge is located (Figure 8).
requirements based on time or distance between individual
stakeholders; rather they are able to donate and access Donors are typically food businesses (supermarkets,
the food at a time convenient to them (Figure 7). The only restaurants, market vendors, bakeries, etc.). The
requirements for the location of the fridge are accessibility acceptance of certain food types depends on the safety
and constant electricity supply (Table 6). Common regulations for the fridge; in some cases, the fridge only
locations are in community centers, religious buildings, accepts cooked food from registered businesses or
universities, outside restaurants or other community- requires home-cooked food to be labelled. In others,
managed spaces. As the model is nonprofit, a team of all food is accepted. However, common products not
volunteers manages the operation to keep it running. For the accepted are raw meat, fish, eggs or products past their
sustainability of the model, a team of dedicated volunteers ‘sell-by’ date.
TABLE 6. SWOT ANALYSIS OF THE COMMUNITY FRIDGE MODEL.
HELPFUL HARMFUL
• Strong relationships with partner • Reliance on donations
organizations • Mainly volunteer run
INTERNAL
• Low investment costs • Unreliable electricity supply
• Marketing or awareness-raising strategy
• Centrally located and easily accessible
• Clear guidelines for donations
• Volunteer training
• Previous client satisfaction and waste • Liability for donated food
reduction • Acceptance by the public to consume
EXTERNAL
• Strong community base food of unknown origin
• Various food businesses located close to • Too high demand resulting in tensions and
the fridge conflicts
• Awareness of the food waste issue
17You can also read