DEVELOPING NEW PATHWAYS FOR INFRASTRUCTURE DECISION MAKING IN THE CONTEXT OF INCLUSIVE GROWTH - June 2022
←
→
Page content transcription
If your browser does not render page correctly, please read the page content below

DEVELOPING NEW PATHWAYS FOR
INFRASTRUCTURE DECISION MAKING IN THE
CONTEXT OF INCLUSIVE GROWTH
June 2022

                                                           Contact
                              Emily Harris emily@darkmatterlabs.org
                              Mihai Chereji mihai@darkmatterlabs.org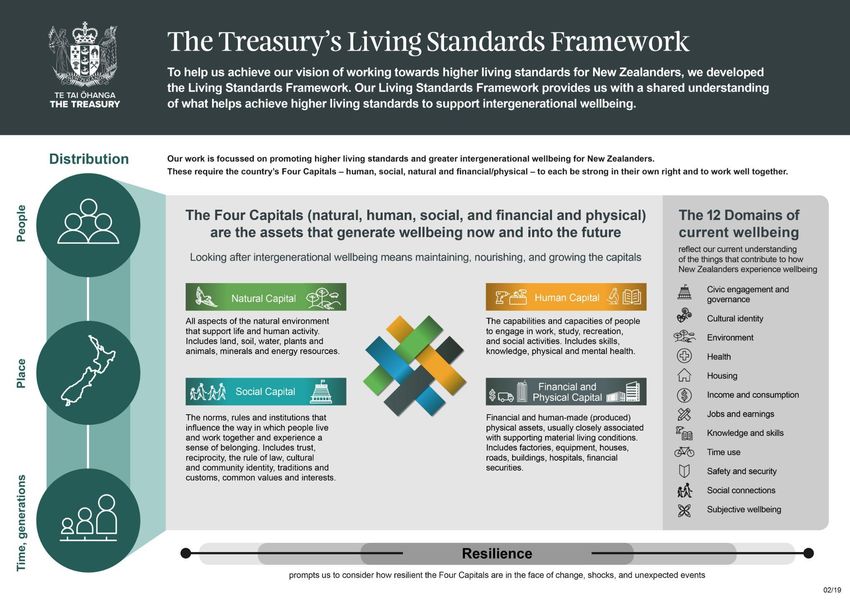
Table of contents
List of images                                                                                                                                 4

List of tables                                                                                                                                 5

Executive Summary                                                                                                                              6

1. Report context and the six critical questions to be addressed                                                                              11
           Report context                                                                                                                     11
           Study background and objectives                                                                                                    11
           The Dark Matter Labs approach                                                                                                      11
           Six critical questions to be addressed in this report (Q1-Q6)                                                                      12

2. Illustrating a wide boundary understanding of infrastructure                                                                               13
    2.1 Introduction                                                                                                                          13
    2.2 Q1: If we use the Scottish Government’s wider definition of infrastructure (i.e. including natural and social infrastructure investments),
    are there additional studies or evaluations that could contradict the Fraser of Allander Report?                                          14
        2.2.1 Notions of infrastructure that may be broader than the FoA Report                                                               14
            A broad overview of DML’s infrastructure taxonomy                                                                                 16
            Hard / physical (tangible) infrastructure                                                                                         17
            Core (intangible) infrastructure                                                                                                  18
                Total factor productivity (TFA)                                                                                               19
                Social capital, cohesion and trust                                                                                            21
            Social infrastructure (an emerging classification)                                                                                 22
                Mental Health                                                                                                                 23
                Education                                                                                                                     24
                Child care                                                                                                                    25
            Natural/Environmental Infrastructure                                                                                              26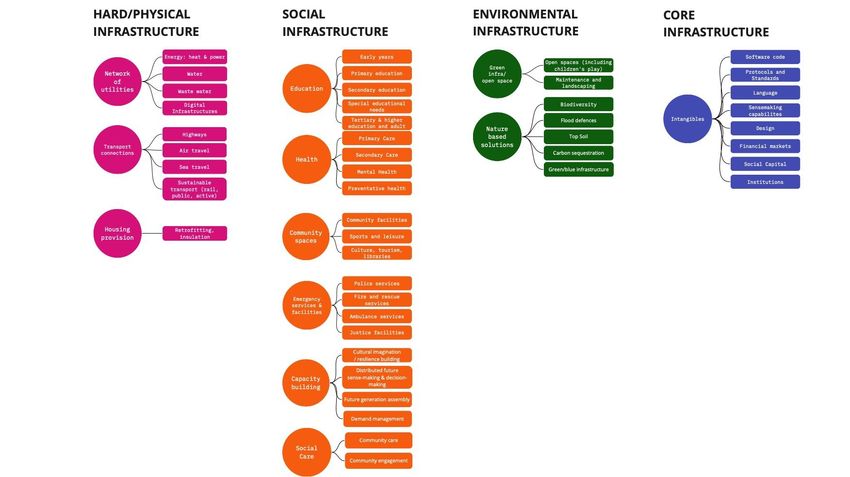
Health improvements                                                                                                         26
               Energy Efficiency                                                                                                            27
       2.2.2 Infrastructure investment versus maintenance                                                                                  27
   2.3 Q2: From an international perspective, what is the emerging evidence base for the positive and negative impacts of infrastructure on
   inclusive growth?                                                                                                                       28
       2.3.1 Placed-based examples                                                                                                         29
           China                                                                                                                           29
           South Africa                                                                                                                    30
       2.3.2. Broad context examples                                                                                                       30
           Preventative health spending                                                                                                    30
           Urban development                                                                                                               31
       2.3.3. Linking a wider understanding of infrastructure to metrics and indicators                                                    32

3. New perspectives for appraisal and evaluation                                                                                       33
    3.1 Introduction                                                                                                                   33
    3.2 Q3: How is the way that we understand and measure value in the economy changing? How is that being evidenced in inclusive growth
    frameworks internationally?                                                                                                        35
        3.2.1 Overview of national and international frameworks                                                                        36
            Australia’s National Development Index                                                                                     37
            New Zealand’s Living Standards Framework                                                                                   39
            The SEEA (System of Environmental Economic Accounting)                                                                     43
            International Integrated Reporting Framework                                                                               45
        3.2.2 Comparative analysis of six international wellbeing frameworks                                                           48
        3.2.3 Key learnings for Scotland that have specific relevance to infrastructure                                                 55
            A capital / wealth approach                                                                                                55
            Weighting measurements                                                                                                     58
            Public engagement                                                                                                          59
            Acknowledging complexity                                                                                                   59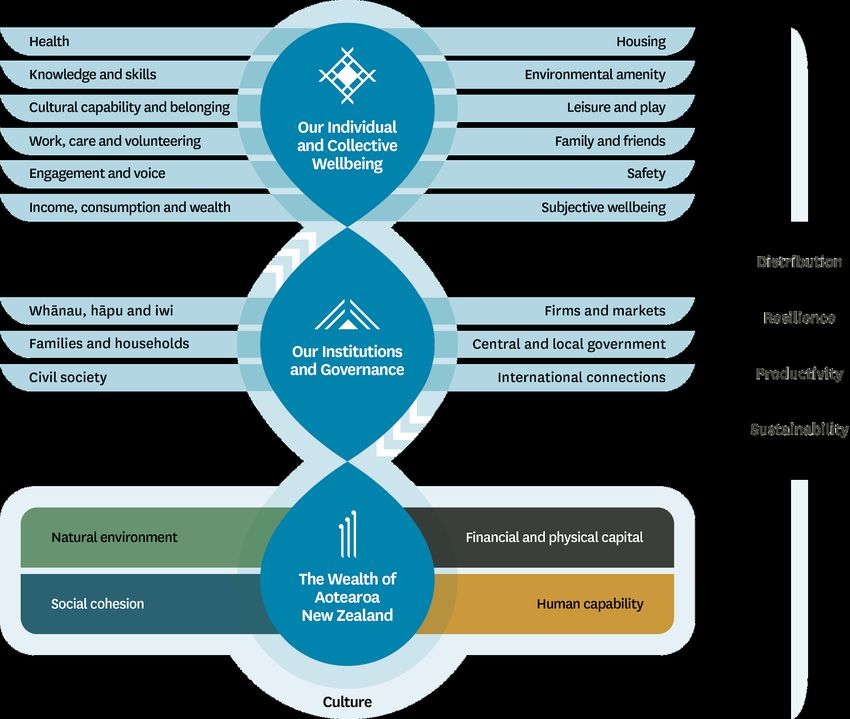
A systems thinking approach                                                                                                     60
           Framework accountability                                                                                                        60
           Setting forward facing targets                                                                                                  61
   3.3 Q4: What can Scotland learn from ‘best practice’ infrastructure appraisal frameworks in the UK and internationally?                 61
       3.3.1 Her Majesty's Treasury Green Book: UK best practice for business case appraisal                                               62
           Green Book 2020 changes                                                                                                         62
           Practical considerations for infrastructure appraisal in the context of inclusive growth                                        63
           Further research suggestions                                                                                                    64
       3.3.2 Table of international comparatives                                                                                           65
   3.4 Q5: How can we evaluate the systemic health of the economy (as opposed to individual sectors or policy areas)?                      69
       3.4.1. Healthy Green Growth Compass (Stoknes and Hawken 2021)                                                                       70
               Concept outline                                                                                                             70
               Metrics                                                                                                                     70
               Emerging evidence base                                                                                                      72
               Relevance for Scotland                                                                                                      72
       3.4.2. The SAGE Framework                                                                                                           72
               Concept outline                                                                                                             72
               Metrics                                                                                                                     73
               Evidence Base                                                                                                               74
               Relevance for Scotland                                                                                                      76
   3.5 Q6: How can we shift practitioner thinking to consider dynamic rather than utilitarian (allocative) prioritisation frameworks and
   emerging rather than static systems?                                                                                                    77
       3.5.1 Applying complexity theory to analytical decision making                                                                      77
       3.5.2 The relationship between complex systems and dynamic analytical frameworks                                                    79
       3.5.3 The reflexivity and fallibility of indicators                                                                                 80

4. Conclusions and further questions for the future                                                                                        81
          Working with a wider taxonomy of infrastructure                                                                                  83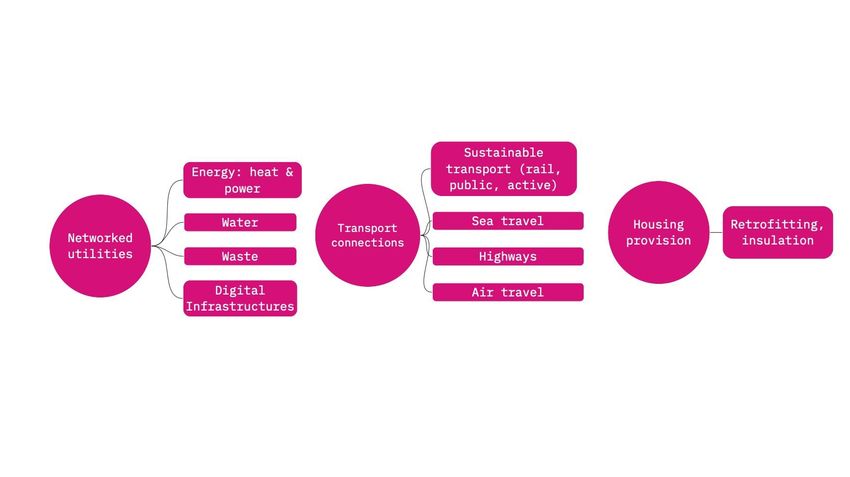
Breaking through the glass ceiling of knowledge mobilisation                                                             83
         Using complexity theory and systems thinking as a pathway to elicit behaviour change                                     83
         Implications for infrastructure prioritisation                                                                           84
         Questions for the next phase                                                                                             85

5. References                                                                                                                     86

    List of images
       Figure 1. Broad overview of infrastructure taxonomy
       Figure 2. Hard infrastructure taxonomy
       Figure 3. Intangible infrastructure taxonomy
       Figure 4. Social infrastructure taxonomy
       Figure 5. Environmental infrastructure emerging taxonomy
       Figure 6. ROAMEF Model Source: (gov.scot 2018)
       Figure 7. Relationships between evaluation and appraisal frameworks. Source: author elaboration
       Figure 8. Australia’s National Development Index Overview Source: (ANDI 2020)
       Figure 10. New Zealand’s Living Standards Framework
       Figure 11. Mainstreaming Opportunities for the SEEA Source: (SEEA 2019)
       Figure 12. The Integrated Reporting Framework (IIRC 2021)
       Figure 13. Relationship between Financial, Double and Dynamic Materialities Source: author elaboration
       Figure 14. Relationship between deep wellbeing indicators and surface level indicators Source: author elaboration
       Figure 15. Source: (Waterloo 2012)
       Figure 16. Illustration of World Bank Prioritisation Matrix Source: (Marcelo et al. 2016)
       Figure 17. Typologies of growth Source: (Stoknes and Hawken 2021, 117)
       Figure 19. Spiderweb diagram of SAGE metrics between 2010-2020 for Japan and United Kingdom Source: (Lima de Miranda and
       Snower 2021)
       Figure 19. Spiderweb diagram of SAGE metrics between 2010-2020 for Japan and United Kingdom Source: (Lima de Miranda and
       Snower 2021)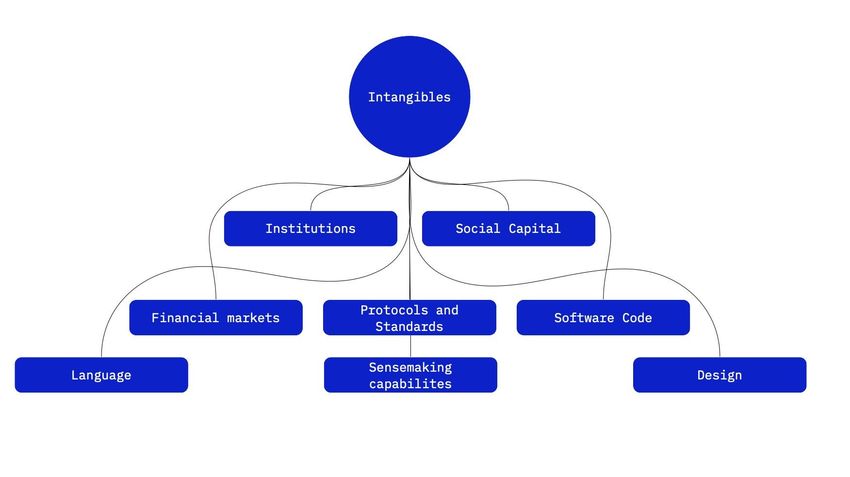
List of tables
  Table 1. New Zealand’s Living Standards Framework and example Dashboard
  Table 2. Comparison between the OECD Wellbeing Framework and New Zealand’s Wealth Indicators
  Table 3. Comparative analysis of three national wellbeing frameworks
  Table 4. Comparative analysis of three international wellbeing frameworks
  Table 5. International Comparison of assessment and prioritisation frameworks
  Table 6. Comparison between GDP/traditional economic frameworks and SAGE
  Table 7. SAGE Framework Metrics
  Table 8. Lima de Miranda and Snower country typology
  Table 9. Defining principles of Complexity Theory
  Table 10. Comparison of Allocative and Dynamic analytical frameworks
  Table 11. Summarisation of prompts, intentions and open questions

Executive Summary
       This report has been prepared as part of a collaborative project with EKOS Ltd (EKOS) on behalf of Scottish Futures Trust (SFT).
       The intention of the report is to help develop a more effective understanding of how infrastructure investment supports inclusive
       growth priorities. The longer-term goal is that the evidence presented will be built upon to inform a new infrastructure prioritisation
       framework and Scotland’s next Infrastructure Investment Plan (IIP).
       The specific framing of our contribution was to provide an international perspective to the research and to offer an element of
       provocation to the overall project.
       The report is structured around addressing the following six critical questions, split between two themes as follows:
       Illustrating a wide boundary understanding of infrastructure
               Q1: If we use the Scottish Government’s wider definition of infrastructure (i.e. including natural and social infrastructure
               investments), are there additional studies or evaluations that could contradict the Fraser of Allander (“FoA”) report1?
               Q2: From an international perspective what is the emerging evidence base for the positive and negative impacts of
               infrastructure on inclusive growth?
       New perspectives for appraisal and evaluation
               Q3: What can Scotland learn from ‘best practice’ infrastructure appraisal frameworks in the UK and internationally?
               Q4: How is the way that we understand and measure value in the economy changing and how is that being evidenced in
               inclusive growth frameworks internationally?
               Q5: How can we evaluate the systemic health of the economy (as opposed to individual sectors or policy areas)?
               Q6: How can we shift practitioner thinking to consider dynamic rather than utilitarian (allocative) prioritisation frameworks and
               emerging rather than static systems?

1
 The Fraser of Allander Report was commissioned by the Infrastructure Commission for Scotland in 2019 and its conclusions were a key driver in instigating
this current project.
Taking a wider view of infrastructure, the international research has highlighted many interesting relationships between infrastructure as an
enabling capability and positive societal outcomes. Some key examples are highlighted below:

       Social infrastructure: Institutional infrastructures (including judiciary and law enforcement services) and social capital (such as
       societal and institutional trust), have been found to be core enabling factors for antifragility and maintaining growth in the face of
       external shocks. For example, a study investigating the factors driving the adoption of COVID-19 test-and-trace apps found that trust
       in government was the most important factor, compared to public spending, professionalism of the civil service and levels of physical
       infrastructural capacity (Cingolani, 2022).
       Human (core) infrastructure: Breaking the feedback loop between poverty and mental illness is a crucial leverage point in achieving
       inclusive growth. For example, a study of 28 European countries found depression alone cost €118bn yearly, of which only 36%
       related to direct treatment costs, with the other 64% representing lost employment, reduced productivity, and increased insurance
       and benefit payments. (Funk, Drew, and Knapp, 2012, p. 173).
       Natural infrastructure: Studies investigating links between natural capital investments and health outcomes have found evidence for
       a diverse range of improvements. These include aspects such as cardiovascular health, cortisol levels (indicators of stress) and
       obstetric outcomes, together with positive impacts on mental health and pro-social behaviours (Suppakittpaisarn et al. 2017).
       Maintenance: Achieving a balance between infrastructure maintenance and capital investment has been found to reduce inequality
       levels whilst also increasing productivity outcomes (Gibson and Rioja, 2017). Furthermore, an interesting crossover consequence of
       investing in natural infrastructure is that nature-based solutions typically have lower maintenance costs, in addition to more obvious
       benefits such as maximising limited resources and reducing the ecological footprint.

Considering the unintended consequences of infrastructure investment
If we are working towards societal level prosperity then we must look at investments from a portfolio perspective, thus allowing diverse
spillover impacts to be considered and evaluated at all stages of the project cycle. A key challenge is that causality is non-linear and thus
when measuring outcomes in aggregate we must consider the distribution of positive and negative impacts across different communities and
timeframes. Some specific examples of unintended consequences drawn from our research are as follows:
        Preventative health: A report from the World Health Organisation on public health investment emphasised the integrated societal
        benefits of preventative spending, highlighting a fourfold return to the wider economy for every dollar invested. A wide range of
auxiliary benefits were examined with improvements being evidenced in areas such as violence reduction, road traffic accident rates
       and unemployment levels (WHO, 2020).
       Mental Health: There is strong evidence of links between social determinants (i.e. living conditions, improper heating, employment
       status, etc.) and health welfare. For example, studies have identified positive correlations between interventions in infrastructure
       areas such as housing provisions for the homeless and improved levels of mental illnesses, together with urban green spaces reducing
       depressive symptoms amongst pregnant women. (Alegría et al. 2018; Chrysopoulou, Anielski, and Weatherhead 2021).
       Childcare: Delivering early-stage childcare has been shown to have long-term effects both via future workplace opportunities and as a
       function of reducing failure demand. For example, a recent IFS (Institute for Fiscal Studies) publication found that the UK's Sure Start
       education initiative (designed to improve early-year care in children under the age of 4) also reduced hospitalisation rates amongst
       10-11 year old children by 30% (Rosie Stock Jones 2020).

Incorporating international best practice
A clear theme that emerged from the international analysis is that it is very difficult to separate the impact of infrastructure investment from
other policies. It is evident that the time and spatial horizons of decision making are becoming more fluid and consequently we need to
remain flexible and non-prescriptive in our use of frameworks and metrics. Several practical implications for Scotland are outlined below:
        Applying systems thinking: Acknowledging complexity (and thus taking a systems-based approach) is central to understanding and
        addressing evolving risks and opportunities. Trade-offs and emerging complexities are inevitable and it is unrealistic to expect that a
        single framework (or a specific set of metrics) will provide all the answers. For example, frameworks such as the Canadian Wellbeing
        Index (CIW), the International Integrated Reporting Framework (IIRF) and New Zealand’s Living Standards Framework (NZ LSF) are all
        centred on taking a systems approach. Conceptually these initiatives are focused on encouraging people to think with an integrated
        and systemic mindset, rather than relying on specific metrics or rules.
        A capital / wealth approach: This framing in relation to wellbeing outcomes is emerging as the gold standard in strong international
        wellbeing frameworks (NZ LSF, OECD, Australian National Development Index). In our view, linking an inclusive economy to a wealth
        economy by considering the underpinning Four Capitals is essential, because the capabilities enabled by infrastructure investment
        (and evidenced by the underlying wealth stocks) provide the means to achieve the target inclusive growth outcomes.
        Governance and accountability: Strong framework accountability and governance is critical to connect desired outcomes to the
        everyday realities of decision making. For example, a recent report published by the Scottish Leaders Forum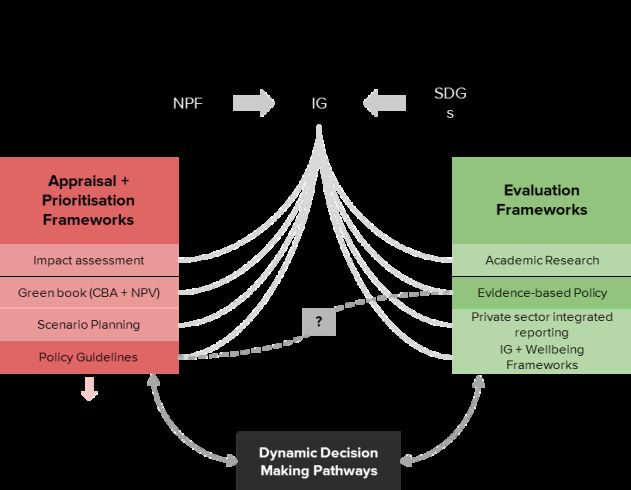
In the
       context of the rising complexities and challenges being faced, it seems imperative that any emerging infrastructure frameworks are
       given appropriate agency and resources to transcend governmental departments.
       Public engagement: Continuous engagement with the public has been found to be an essential factor in creating an enabling
       environment for progressive future policy. Strong examples include the interactive format of New Zealand’s Living Standards
       Dashboard and Canada's Wellbeing regional outreach programmes. It is noted that the IIP route map includes a public engagement
       workstream, as recommended by the Infrastructure Commission for Scotland.

Raising our gaze to achieve transformational effects
The concurrent national strategies of achieving net zero and inclusive growth clearly indicate that infrastructure appraisal techniques must
become more holistic and consider a portfolio of impacts. In the UK, the Treasury’s Green Book is considered the best-practice standard for
public sector investment appraisal. A review of the Green Book in 2020 concluded that ‘transformational effects are rare’ in relation to
investment and only occur when initiatives are ‘part of a coherent strategic portfolio designed to deliver such changes.’ (HM Treasury 2020a).
This was a theme that was echoed in our analysis of best-practice prioritisation frameworks, with some key examples being as follows:
        System level alternatives to GDP: In recent years there have been numerous criticisms of GDP as a measure of individual wellbeing
        but less has been voiced about its effectiveness as a measure of the economy’s systemic health. Examples include:
                The Healthy Green Growth Compass (Norway) looks at rates of change in ecological and social (particularly in relation to
                inequality) indicators as a function of GDP and aligns them with science-based targets (Stoknes and Hawken 2021). The
                Compass acknowledges the constant fluidity present in natural and social systems and its framing clearly indicates the
                direction of progress towards informed targets, rather than using fixed or comparative metrics.
                The SAGE Framework (Global) presents a policy route for recoupling economic and social prosperity and follows a dashboard
                approach to measurement. The framework consists of four indices (Agency, Solidarity, Environmental Stability & Material Gain)
                which are represented by a visual matrix designed to identify shifting societal behaviour and norms (De Miranda, K and Snow, D
                2020).
        Applying complexity theory to analytical decision making: Research drawing on complexity theory has shown that in complex
        environments there is a need to shift towards dynamic decision making frameworks (as opposed to traditional CBA analysis). The key
        difference between dynamic and allocative frameworks is that an allocative framework aims to make the optimal use of fixed
        resources at a single point in time, whereas a dynamic framework seeks to use resources to enact desired changes (Kattel et al. 2018).
In practical terms, this means rejecting the concept of optimality and prioritising adaptable policy choices which can be adjusted as the context evolves. Setting forward facing targets: Market-shaping (as opposed to market-fixing) policy frameworks require forward facing targets. A successful integrated infrastructure prioritisation framework will need to continuously connect evaluation measurements to evolving appraisal input metrics. If the selected evaluation metrics cannot be readily applied to appraisal targets then there is a danger that the process will remain reliant on traditional economic measures such as GVA (gross value added). 1. Encourage wide boundary thinking: By thinking about infrastructure investment as a pathway to creating enabling capabilities and societal resilience, we can transcend the restrictive limitations of ascribing specific asset classes to desired outcome indicators. 2. Consider the unintended consequences: If we are working towards societal wide prosperity then we must look at investments from a system-wide portfolio perspective, thus allowing positive and negative spillover impacts to be considered and evaluated at all stages of the project cycle. 3. Look upstream of the framework: Well designed frameworks can contribute to the design and implementation of meaningful future policy but are rendered powerless without associated behavioural changes. If we can shift the values behind the decision making, then the frameworks can be repositioned to act as conceptual aids rather than as prescriptive tools. 4. Contextualise the theory: The interconnected nature of the investment landscape can be overwhelming and thus to enable practitioners to enact practical change, the theories must be contextualised in both time and place (e.g. using the 4-Capitals model as a proxy for infrastructure investment). 5. Apply dynamic analysis: If we accept the fundamental uncertainty of working within emerging contexts then we can become liberated from the concept of optimality. By focusing on adaptable policy choices that can be adjusted as new uncertainties emerge, we can build resilience and reduce fragility. 6. Commit to a direction of travel: The non-linearity that defines socio-economic systems means that individual targets can often bring a false sense of security, or worse, can shift behaviours in unintended ways. If we can instead commit to a desired direction of travel for Scotland, then we can remain flexible in our evaluation and decision making pathways. 7. Acknowledge the reflexivity of targets and indicators: Indicators which are used as targets can become less meaningful over time because organisations and societies are complex adaptive systems, ever evolving and adapting to their new conditions and incentives.
Report context
This report has been prepared as part of a collaborative project with EKOS Ltd (EKOS) on behalf of Scottish Futures Trust (SFT). Dark Matter
Laboratories (DML) were specifically asked by SFT to contribute an international perspective to the research and to provide an element of
provocation to the overall project. The standalone outputs from the DML segment of the project are presented in this report, whilst the key
ideas, conclusions and recommendations that were drawn from it are included in the full EKOS report (EKOS 2022).

Study background and objectives
In 2021 the Scottish Government (SG) published its latest Infrastructure Investment Plan (IIP) (2021/2-2025/2026) which includes a route
map for improvements to the decision-making process for capital investment in Scotland (Scottish Government 2021a). This will inform the
development of the next IIP and related capital investments. SFT is assisting the Scottish Government in implementing elements of this route
map, including developing a new prioritisation framework that aligns with policy ambitions, such as inclusive growth. However, in order to
effectively support the prioritisation framework there is a need to develop a more effective understanding of how infrastructure supports
inclusive growth priorities.

The specific objectives of this stage of the project are as follows:
       Establishing if (and thus where) an evidence base currently exists that connects infrastructure investment to inclusive growth.
       Selecting evaluation metrics to be used by SFT in a planned longitudinal study of a portfolio of infrastructure projects across Scotland.

The Dark Matter Labs approach
We have framed our contribution to the research inquiry as a series of questions and responses which are presented below. The queries were
designed to provocatively explore existing thinking whilst presenting vanguard and emerging alternatives for the future. Our intention is that
these responses will complement the EKOS report and the information flow that is shown below is therefore aligned with (and referenced
from) that report.
Six critical questions to be addressed in this report (Q1-Q6)
The following selected themes and questions delineate the report structure:
Illustrating a wide boundary understanding of infrastructure
Q1: If we use the Scottish Government’s wider definition of infrastructure (i.e. including natural and social infrastructure investments),
are there additional studies or evaluations that could contradict the Fraser of Allander (“FoA”) report2?
Q2: From an international perspective what is the emerging evidence base for the positive and negative impacts of infrastructure on
inclusive growth?
New perspectives for appraisal and evaluation
Q3: What can Scotland learn from ‘best practice’ infrastructure appraisal frameworks in the UK and internationally?
Q4: How is the way that we understand and measure value in the economy changing and how is that being evidenced in inclusive
growth frameworks internationally?
Q5: How can we evaluate the systemic health of the economy (as opposed to individual sectors or policy areas)?
Q6: How can we shift practitioner thinking to consider dynamic rather than utilitarian (allocative) prioritisation frameworks and
emerging rather than static systems?
2
The Fraser of Allander Report was commissioned by the Infrastructure Commission for Scotland in 2019 and its conclusions were a key driver in instigating
this current project.2. Illustrating a wide boundary understanding of infrastructure
A key driver and starting point for this project were the conclusions that were drawn from an earlier research study commissioned by the
Infrastructure Commission for Scotland (“Infrastructure Commission”). The output from this work was the Fraser of Allander Report (2019)
which concluded that it is impossible to draw conclusive causal connections between investment in infrastructure and economic growth (and
even less so about inclusive growth). The FoA report predominantly analysed existing literature review studies, which were themselves
focused on the causal link between investment in infrastructure and economic growth. In addition, the report began to explore potential
inclusive growth indicators and recommended that this work should be expanded upon.
For the purpose of their report, the FoA researchers started with the Scottish Government’s simple yet effective definition of inclusive growth,
which reads as follows:
‘Growth that combines increased prosperity with greater equity; that creates opportunities for all and distributes the dividends of
increased prosperity fairly’.
Whilst we accept the robustness and quality of the FoA report, we would stress that in the three years following its publication, there has been
a significant shift in the nature of our investment requirements. Furthermore, much work has been done to expand the conceptual boundaries
of infrastructure investment, to include categories such as “intangible infrastructure” and “civic infrastructures”. In our view, if we wish to
establish a link between infrastructure investment and inclusive growth (however defined) in the 21st Century, we first need to carefully
consider our understanding of the term ‘infrastructure’ and thus what may be included within it.2.2.
2.2.1 Notions of infrastructure that may be broader than the FoA Report
To put the FoA conclusions into context, it is interesting to note that all the studies which were included in the evidence review looked at a
narrow segment of infrastructure. The categories reviewed were as follows:
Transport (road and railway networks);
Energy (electricity networks mostly); and
Telecommunications and Digital (broadband and cellular network towers).
This approach excluded large swathes of physical infrastructure and the report itself suggested that investigating different types of
infrastructure might be required in order to establish a connection to inclusive growth (Fraser of Allander Institute 2019, 28). It is our view
that this requirement must include the consideration of intangible infrastructures in addition to broadening the scope of the more traditional
categories.
In contrast to the FoA parameters, the Scottish Infrastructure Investment Plan (Scottish Government 2021a, 8) already considers an
expanded definition of infrastructure. For example, the IIP accepts the Infrastructure Commission’s recommendation to include ‘Natural
Infrastructure’ within its scope. The definition adopted in the IIP echoes that used by the International Institute for Sustainable Development,
surmising that:
‘Natural infrastructure is an area or system that is either naturally occurring or naturalised and then
intentionally managed to provide multiple benefits for the environment and human wellbeing.’The full definition of infrastructure stated in the IIP is as follows (ibid, 8):
‘The physical and technical facilities, natural and other fundamental systems necessary for the economy to function and to enable, sustain or
enhance societal living conditions. These include the networks, connections and storage relating to the enabling infrastructure of transport,
energy, water, telecoms, digital and internet, to permit the ready movement of people, goods and services. They include the built environment of
housing; public infrastructure such as education, health, justice and cultural facilities; safety enhancement such as waste management or
flood prevention; natural assets and networks that supply ecosystem services and public services such as emergency services and resilience.’
DML’s own understanding of what constitutes infrastructure is evolving and we are currently in the process of creating a more comprehensive
taxonomy of infrastructure that we outline below3. Our intention is to use this taxonomy (both in this report and in our work more widely) to
investigate whether different types of investment are connected to a contextualised understanding of inclusive growth. Our analysis of the
different infrastructure asset classes is presented below under the following categories:
A. An overview of the full taxonomy
B. Hard / physical (tangible) infrastructure
C. Core (intangible) infrastructure
D. Social infrastructure
E. Environmental infrastructure
3
We acknowledge that in delineating any form of taxonomy, judgements and trade-offs are unavoidable. For example, we have included the provision of
housing under the category of hard / physical infrastructure, but appreciate that it can also be viewed as a social service under the heading of social
infrastructure.A. A broad overview of DML’s infrastructure taxonomy
Figure 1. Broad overview of infrastructure taxonomyB. Hard / physical (tangible) infrastructure
Figure 2. Hard infrastructure taxonomy
The asset classes presented above summarise the more traditional elements of public investment. In our view, whilst these classes remain as
key drivers in any investment plan, they must be considered in the context of the wider taxonomy presented above.C. Core (intangible) infrastructure
Figure 3. Intangible infrastructure taxonomyThe main addition to the infrastructure categories that are already recognized by the Scottish Government4 is the core or intangible
infrastructure category, which involves broad systems and patterns which are fundamental to modern economic life. Many of these are
second-order emergent manifestations of the physical infrastructures that enable them. Our working definition of intangible infrastructures is
thus as follows:
‘Intangible infrastructuring is the shared formulae, relationships, and abilities that underpin society’s
social, ecological, and economic systems. It refers to the process of using and creating these to scaffold
capabilities and values at a societal scale. They emerge through interactive processes between diverse
actors and tangible structures in a given context, relative to each actor’s conversion factor. Intangibles
enable the reduction of fundamental uncertainty and prevention of damage, and most importantly fulfil
conditions for societal thriving.’ (Rönnquist, de Dios, Chereji, upcoming)
Considering this broadened definition, the types of investments and spending which could relate to inclusive growth become more diverse.
The next subsection therefore aims to explore whether there are existing justifications for this wider definition of infrastructure if we start
from the perspective of more traditional economics. The subsequent subsections will investigate connections between three of the
sub-categories of intangibles that we have identified above and inclusive growth.
Total factor productivity (TFA)
Our understanding of economic prosperity diverges significantly from neoclassical economic theory. However, even working within that more
traditional framework, there are strong arguments for exploring wider definitions of infrastructure when searching for a link to growth
(whether inclusive or otherwise).
In neoclassical economics, the Cobb-Douglas production function, which describes the relationship between available input resources and
production, has three inputs: capital (K), labour (L) and a residual called Total Factor Productivity (A), which explains the variances in
productivity growth that cannot be explained by increases in either labour or capital inputs. In an overview study related to capital
4
As defined in the Infrastructure investment: Evidence Summary document (Scottish Government, 2018) : ‘Typically infrastructure refers to economic
infrastructure, such as utility networks, transport and digital communications, but the Scottish Government also includes social infrastructure such as schools,
universities, hospitals, prisons, community housing and parks’ and taking into account the addition of natural infrastructure to the definition in the IIP
(Scottish Government, 2021a).accumulation and growth, Easterly and Levine (2001) consider that capital accumulation is not the determining factor in differences in growth
between countries, but an unexplained ‘something else’, which is termed total factor productivity. In their view the boundaries of what makes
up total factor productivity are not clear and they concluded that: ‘These range from changes in technology (the instructions for producing
goods and services) to the role of externalities, changes in the sector composition of production, and the adoption of lower-cost production
methods. [...] Economists need to provide much more shape and substance to the amorphous term TFP’ (Easterly and Levine 2001, 178).
It therefore follows that as capital accumulation refers both to public capital (i.e. public hard infrastructure) and to productive assets (such as
private factories and machinery), this broad view regarding the mix of factors is indicative of the contingent nature of economic growth.
Some theories on the nature of TFP demonstrate a broad common ground regarding an expanded view on what should be considered as
intangible infrastructure. For example:
Romer’s (1986) view on long-run growth includes knowledge as an input in production and focuses on externalities such as
spillovers. The social and intangible infrastructures which enable knowledge advancement and diffusion then become critical to
growth.
Technological adoption is given as a large factor in TFP by Parente and Prescott (1994). The main barriers of technological adoption
vary from institutional setup, industrial relations, culture and of course the skill level of the existing human capital. Technological
diffusion then becomes a key factor and the underlying infrastructures that enable this diffusion, both tangible and intangible, can be
seen as determinants of growth.
Rodrik (1998) explores the importance of social cohesion and conflict resolution institutions in maintaining growth in the face of
external shocks. Institutional infrastructures (including judiciary and law enforcement) and social capital such as societal and
institutional trust then become a core enabler for antifragility and inclusive growth. Moreover, Rodrik’s interpretation of social conflict
is ‘the depth of pre-existing social cleavages in a society, along the lines of wealth, ethnic identity, geographical region or other divisions.’
(Rodrik 1998, 3). This implies that societal inclusivity in itself is a determinant factor of growth and it thus follows that inclusive growth
becomes more self-sustainable than unevenly distributed growth.
(Rodrik 1998, 2)Social capital, cohesion and trust Social cohesion as an example of infrastructure can be conceptually difficult to visualise. However, an interesting example of how social cohesion and institutional trust can play a critical role in delivering positive outcomes has been evidenced in the adoption of digital infrastructures. A study investigating the factors driving the adoption of COVID-19 test-and-trace apps (Cingolani 2022) found that trust in government was the most important factor in predicting adoption, compared to public spending, professionalism of the civil service and levels of ‘physical infrastructural capacity’. The studies presented in this section all attempt to show that parameters beyond hard capital are important determinants of economic growth and well-being. In the final two taxonomy sections, we will therefore look at evidence that links social and natural infrastructure to growth, wellbeing and inclusivity.
D. Social infrastructure (an emerging classification)

                                                      Figure 4. Social infrastructure taxonomy

Social infrastructure itself is a broad term encompassing both the physical and intangible infrastructure that underpins the societal activities
that create social cohesion. Examples of this class span diverse aspects of society, including health and social care, education, community
building and institutional infrastructure such as justice and policing services. Furthermore, the higher order effects of the investments in the
physical infrastructure which enable or hinder cohesion can themselves become infrastructures. Social infrastructure is becoming more
prevalent in economic dialogue but as a concept it remains somewhat opaque. To aid understanding, we have therefore expanded on the evidence base for three of its key underlying components below. Mental Health It is generally accepted that a good level of overall mental health across a population is necessary for a well-functioning society. Funk et al. (2012) provide an overview of the evidence linking poor mental health outcomes to poverty directly and to stalled development for lower and middle-income countries (LMICs). While they specifically focus on the impact in LMICs, they do also provide an overview of the economic impacts across the world and evidenced that mental disorders impact people experiencing poverty disproportionately. Firstly they are themselves a high-risk factor for the initial descent into poverty and by reducing people’s ability to work they compound their impact on productivity and earning opportunities. Thus on a contextual level untreated mental illnesses can act as a brake on developing human capital more generally (Funk, Drew, and Knapp 2012, 172). Moreover, on aggregate the costs of poor mental health are significant at a societal level. In a study cited by the abovementioned literature review, Sobocki et al. (2006) estimated that in a study encompassing twenty eight European countries, depression alone cost €118bn yearly, of which only 36% related to direct treatment costs, with the other 64% representing ‘lost employment, reduced productivity, and increased insurance and benefit payments’ (Funk, Drew, and Knapp 2012, 173). A similar study conducted by the King’s Fund (McCrone 2008) found that the cost of mental health in the UK in 2007 was almost £49bn with £26bn of this relating to lost earnings. The above analysis indicates that breaking the feedback loop between poverty and mental illness is a crucial leverage point in achieving inclusive growth. Looking firstly at negative impacts, the ‘Failure Demand’ report recently produced by the Wellbeing Alliance (Chrysopoulou, Anielski, and Weatherhead 2021) found links between inadequate housing conditions, precarious employment (and unemployment) and a degradation of mental health. Another study looking at the association between income levels, social cohesion and mental health found a strong correlation between lower income and degraded mental health in Caerphilly County Borough in Wales (Fone et al. 2007). In contrast, they found that higher levels of social cohesion significantly reduced the correlation between poverty and poor mental health. Other studies have investigated the links from the perspective of driving improvements in health. For example, a meta-study analysing the social determinants of mental health and the impact of policy interventions to alleviate its associated problems (Alegría et al. 2018) found strong evidence of links between social determinants (i.e. living conditions, improper heating, employment status, etc) and health welfare.
The study also identified positive correlations between interventions in infrastructure areas such as housing provisions for the homeless and
improved levels of mental illnesses, together with urban green spaces reducing depressive symptoms amongst pregnant women.

Education
Skill attainment and the overall outcomes of education are difficult to measure and are based on a number of normative assumptions5.
However, aggregate levels of literacy, numeracy and basic critical thinking have been assessed more robustly. For example, through the
OECD’s PISA programme where second-order outcomes are usually captured by measuring levels of intellectual outputs, such as patents and
trademarks.

A 2005 theoretical modelling study (F. K. Rioja 2005) compared the returns on investment between spending on public capital (i.e. physical
infrastructure) or education. The model was calibrated to data corresponding to the economies of seven Latin American countries, which
makes the applicability of the results to other countries limited. The study found that increasing spending on education boosted growth rates
more than investing in physical infrastructure. Similarly, shifting spending from infrastructure to education (up to 3-4% of GDP) increased the
growth rates of those economies. Although we have not found similar models relating to developed economies, evidence from Spain has been
collected and analysed which shows that regional variations in both infrastructure stock and educational attainment mean that differentiated
levels of investment in the two sectors are required for optimal growth and regional convergence (Esteller and Solé 2005). A similar study
found that infrastructure investment had not helped to reduce regional inequalities because investment was not prioritised towards the
regions most in need of upgraded investment (de la Fuente et al. 1995).

A more recent study analysing Poland (Wójcik 2021) analysed the link between educational attainment and income levels at a local and
regional level and found that the patterns of convergence were different. The research highlighted that additional causal mechanisms, such as
the migration of more educated workers towards more competitive regions and cities were reinforcing regional inequalities. The study
concluded that creating opportunities for success amongst those with a higher level of education in their local regions is an additional
requirement for the gains in education to be realised in regional growth outcomes.

5
 The ONS uses measures of educational attainment and more recently has introduced measures of at-school bullying to measure educational quality in its
public service productivity measures. (Office for National Statistics 2021a)
Child care
The provision of good quality child care is essential for the solid development of future human capital. This in turn drives future economic
growth through increased productivity and innovation. Delivering early stage childcare has been shown to have long-term effects not just via
the future workplace, but also as a function of reducing failure demand. For example, a recent IFS study found that the since-discontinued
UK's Sure Start education initiative (designed to improve early-year care in children under the age of 4) reduced hospitalisation rates amongst
10-11 year old children by 30% (Rosie Stock Jones 2020).

The issue of providing good quality and accessible child-care infrastructure is a gender inequality issue as well. Even though the U.K. is doing
better than most in terms of gender equality, British women spend on average twice as much time doing unpaid child-care work compared to
men and three times as much on adult care (OECD 2021a). According to ONS data, unemployed adults who are seeking work respond
differently to survey questions depending on their gender with more than 33% of women responding that they cannot find work because of
home or family caring duties, compared to only 10% of men (Office for National Statistics 2022). This disparity limits the effective earning
potential of women compared to men and this was clearly manifested during the acute stages of the COVID-19 pandemic. For example, a
recent IMF blog post (Kristalina Georgieva et al. 2021) highlights that during the lockdown caused by the COVID-19 pandemic, employment
amongst mothers of young children fell by over 7%, whereas employment of men in the same situation was reduced by less than 2%.
E. Natural/Environmental Infrastructure

                                                  Figure 5. Environmental infrastructure emerging taxonomy

The Scottish Government’s recent decision to include natural infrastructure in their definition of infrastructure is progressive and in line with
our understanding of an emerging consensus. One of the main criticisms that has been levied against traditional economic measures like GDP
(and national accounting more generally) is that they do not account for the benefits of natural capital unless they produce a market
transaction or can be viewed as government investment. For example, woodland is economically valuable when it is turned into timber but not
as a result of its carbon capture properties6. This incumbent reality necessitates a change in focus to look at indirect causal links between
natural capital investments and improvements in well-being, as opposed to traditional economic growth. We have therefore selected two
examples below (health improvements and energy efficiency) which illustrate how indirect pathways can be linked to achieving inclusive
growth goals.

Health improvements
A recent literature review (McKinney and VerBerkmoes 2020) analysed 42 studies searching for links between Natural Green Infrastructure
(‘areas of vegetation that are generally unmanaged or, more often, receive some low-cost sporadic management such as debris removal or

6
 That being said, the ONS and other statistical bodies around the world have started publishing experimental statistical tables describing natural capital
which include services such as carbon sequestration and urban cooling (Office for National Statistics 2021b)
invasive plant removal’ (McKinney and VerBerkmoes 2020, 36) ) and beneficial effects on health. The papers in the review all found beneficial impacts on various aspects of health and social well-being (including mental health, crime reduction, obesity and well-being), either through objective data measurement or self-reported responses. A related literature review by Suppakittpaisarn et al. (2017) looked both at the links between health outcomes and green infrastructure including the specific asset class of green stormwater infrastructure (GSI), which relates to natural solutions used specifically to store and mitigate stormwater runoff (e.g. bioswales and green roofs). The literature review relating to green infrastructure more generally studied 55 papers and found benefits relating to diverse aspects of health. Improvements were found in mortality rate, cardiovascular health, cortisol levels (indicators of stress), pregnancy and birth outcomes, respiratory diseases and allergies, as well as various aspects of mental health and crime reduction and pro-social behaviours. However, the review did not establish a specific link between GSI and health outcomes. Energy Efficiency A 2017 study (Giometto et al. 2017) investigated the effect of urban forests on wind flows and the associated impact on energy usage. The authors found through simulations and collected empirical data that removing all the trees can double the wind speed in an urban setting, leading to increased risks during wind storms. They also found that wind pressure can account for up to a third of a building’s energy consumption and that removing trees around a building increased its consumption by 10% in winter and 15% during summer. An older study (Akbari 2002) similarly estimated the impact that the shade provided by trees has on energy consumption for cooling and heating purposes in various US cities. It estimated that a tree planted in Los Angeles would have the same effect on reducing carbon emissions as 4-5 trees planted in a forest, as a result of avoided emissions made possible by improved energy efficiency and absorbed solar energy. The scale of the savings were estimated to equate to one tree avoiding up to 18kg of carbon annually and producing savings of up to 200$/year. The study’s findings were spatially limited to specific US cities and the energy mix and efficiencies of air conditioning and heating systems available at that time. However, a more recent study found that a Plane tree in London can reduce a building’s summertime energy use by up to 31% over a hundred years (Donovan and Butry 2009) and there is a growing evidence base of similar findings. 2.2.2 Infrastructure investment versus maintenance Most of the studies included in the FoA literature review attempted to link capital expenditure to increasing the capital stock of infrastructure, but were not designed to look at the impact of expenditure on maintaining the existing public capital stock. In contrast, a study on the value of infrastructure by Rioja (2013) found that ‘estimated rates of return for maintenance are high’ and that there is an optimal level of
maintenance expenditure beyond which investment in new infrastructure starts lagging. The importance of maintenance is recognized in the
IIP’s Annex B (Scottish Government 2021a, 47) and is also reflected in the Scottish Government Investment Hierarchy, which prioritises
‘maximising the useful life of existing assets’ as opposed to ‘replacing, creating or building new assets’ (2021a, 9).

A study by Gibson and Rioja (2017) simulated the effects of three different models of infrastructure spending in Mexico. The first strategy
maximised investment in new infrastructure, the second divided the budget equally between new infrastructure investment and maintenance
and the third directed the entire budget to maintenance spend. The study then tracked the effects of these strategies on both productivity
outputs and on levels of inequality. The authors found that the ‘all maintenance’ strategy was the most effective at reducing inequality,
whereas the strategy of spending equal amounts on investment and maintenance optimised productive output. The authors concluded that a
strategy that pursues solely new investment fails both at increasing economic growth and reducing inequality. It must be noted however, that
these findings were calibrated to Mexico’s existing infrastructure stock and have not yet been corroborated more widely.

In addition to the above cited studies, we would emphasise that reducing the maintenance cost of infrastructure must logically be seen as a
key enabling factor in terms of maximising limited resources. Furthermore, as one the key benefits of nature-based solutions are their lower
maintenance costs. For example, this was illustrated by a study looking at the difference in cost between traditional and sustainable drainage
systems which found that the green solutions were more cost efficient (Duffy et al. (2008)). This observation gives further weight to a diverse
taxonomy of infrastructure if inclusive growth targets are to be realised.

The research outlined in section 2.2 demonstrates that a wider definition of infrastructure is being adopted internationally. Logically, this
conceptual expansion also necessitates a wider view to be taken of the scope of potential impacts (both positive and negative) on inclusive
growth. For example, both environmental and social infrastructure were shown to have substantiated impacts on health, which itself is a key
indicator of both wellbeing and prosperity.
To further illustrate the breadth and diversity of these impacts we have therefore selected a small selection of illustrative examples and case
studies which are presented below under the following categories:
   1. Place based examples
2. Broad context examples

2.3.1 Placed-based examples

China
Xun and Guanghua (2017) have studied the impact that infrastructure investment in rural China has had on both growth and distributional
effects. The study looked at landline telephone and tap water as types of rural infrastructure and found that these types of infrastructure have
a strong impact on growth in rural areas, which were severely economically depressed in comparison to urban areas. Additionally they found
that these infrastructures had a significant impact in reducing inequality but that individuals with higher levels of education and experience
gained more from the presence of rural infrastructure: They concluded that ‘from the view of income distribution, infrastructure provides more
opportunities for educated and experienced individuals to earn higher incomes.’ (Xun and Guanghua 2017, 107) which highlights the need to
complement infrastructural investments with investments in skills.

In an earlier study, Ansar et al. (2016) investigated the economic growth impact of transport infrastructure in aggregate across China,
investigating 95 projects, totalling investments of ~$65 bn (2015 equivalent). They found that past the short-term growth caused by the
increase in demand that infrastructure construction spurs, an over-investment in infrastructure can ‘[fuel] economic growth today by
excessive capital accumulation, policy-makers risk suffocating the possibility of steadier and more resilient future economic growth that comes
from greater efficiency and productivity of using scarce factors of production.’ (Ansar et al. 2016, 378). The study focuses on the unsustainable
amount of both public and private debt that has been accrued in constructing infrastructure (282 % of GDP at the time of the article) as a
significant risk factor for future growth. The recent credit crises (Sun Yu and Tom Mitchell 2022) of some of China’s largest private or partly
state-owned housing companies seems to validate some of the concerns the study brought up. The study also investigates the poor
performance (in terms of usage) and cost overruns of projects as further detractors from future growth.

The study acknowledges the risk that future maintenance costs can negatively impact on growth, but did not consider those costs to be the
main determinant of future economic performance. More importantly, the authors disregarded the idea that measuring spillover benefits of
transport networks would fundamentally change the conclusions of the Benefit-Cost Ratio (BCR) calculations that formed the basis of their
findings: ‘Benefits, such as value of time savings or increased land values, do not come about unless the forecast traffic volumes materialize.
Actual traffic is thus the most concrete and fool-proof gauge of the actual benefits of a transport project. If the basic traffic does not
materialize, the rest of the benefits are also unlikely to emerge’ (Ansar et al. 2016, 378). It should also be noted that the study does not take
into account distributional effects whatsoever.

South Africa
A Master’s Degree thesis (Gnade 2015) from the University of Johannesburg set out to determine the impact of investment in both basic
(physical) and social infrastructure in South Africa, differentiating between investments in rural and urban areas. The author concluded that
investments in basic and social infrastructure contribute positively both economically (measured by GDP per capita [GDPpc], poverty rates
and household income) and developmentally (measured by the Human Development Index and the percentage of people in extreme poverty).
The thesis concluded that social infrastructure investments have a stronger economic effect than basic infrastructure investment, and that
investments in rural areas tend to yield more significant improvements both in terms of economic growth and social benefits. This research
provides evidence that infrastructure investment does play a role in inclusive growth and development in the context of developing countries
such as South Africa.

2.3.2. Broad context examples

Preventative health spending
In the UK, preventative health has been treated as a revenue cost rather than as a capital investment but the Health and Care Bill (which will
put Integrated Care Systems on a statutory footing from July 2022) is driving a shift in this approach. The arguments for this shift are
multifaceted and whilst there is a focus on Return on Investment [ROI] justifications7 there is also a growing awareness of the reciprocal
spillover effects associated with preventative health (WHO 2020). For example, a report from the World Health Organisation on public health
investment emphasised the integrated societal benefits of preventative spending highlighting a fourfold return to the wider economy for every
dollar invested. A wide range of auxiliary benefits were examined with improvements being evidenced in areas such as violence reduction,
road traffic accident rates and unemployment levels. Conversely, looking from the perspective of initiatives outside of the traditional health
workflow, there is a growing body of evidence demonstrating positive health effects from investments that do not themselves have
preventative healthcare as the primary objective.

7
 The Marmot Review (2010) on health inequality for example leads with figures on lost productivity and taxes due to health inequality and lack of
preventative health spending, before describing societal impacts.
An interesting illustration of the concept of positive unintended consequences can be seen in the aforementioned study by the IFS which
found that the UK's Sure Start initiative reduced hospitalisation rates amongst 10-11 year old children by 30% (Rosie Stock Jones 2020).
Similarly, as previously discussed in the Natural/Environmental Infrastructure section, urban natural resources have a very strong impact on
both mental and cardiovascular health. But due to accounting conventions, even when the benefits for health outcomes further down the line
of the cohort impacted by an intervention are proven, these investments are not counted towards preventative health spending (as per (OECD,
Eurostat, and World Health Organization 2017)). This points to a need to move beyond systems where only primary expected outcomes are
used to determine spending (for further context please see New perspectives for appraisal and evaluation section.)

Urban development
In a previous study, DML investigated the impacts of the much applauded public investment into the High Line park in Manhattan8. The
research highlighted that whilst the initiative had significantly increased the mean property values in the area (the park cost $187m to build
and contributed to an additional increase of $3.4bn for nearby properties) the returns to the government in property taxes were limited, with
the lion’s share of the increase in wealth accruing to private landowners. This outcome, whilst clearly unintentional, epitomises the issue
highlighted by Marianna Mazzucato of public investments being hijacked as a mechanism for socialising the risks of innovation whilst
privatising the rewards. (Mazzucato 2018) A similar issue was identified by a study that looked at the urban development that occurred in East
London as a result of the 2012 Olympic Games being held in the area (Watt 2013). The analysis highlighted that the city’s desired outcome of
creating improved social and economic conditions in the area did not correspond to the lived experience of those who were displaced by
infrastructure development. This is a conclusion echoed by a study undertaken by the What Works Well Centre for Local Economic Growth into
Estate Regeneration spanning a sample of OECD countries. They found that whilst the economic performance of purposefully regenerated
areas improves considerably, this does not apply to all demographics; for example if higher income groups move in as a result of the initiative
and lower income groups are forced to move out, then this will indirectly drive up the average area income level. They concluded that
‘disentangling these effects on area averages from impacts on particular individuals or groups in an area is a major challenge for evaluation of
these projects’ (What Works Well 2015). These studies demonstrate that if the aspiration of an investment programme is to achieve inclusive
growth then there is a clear need to consider broader societal impacts, even if the initial links between a given investment and economic
growth overall appear attractive.

8
    https://provocations.darkmatterlabs.org/a-smart-commons-528f4e53cec2
You can also read