101 Filtering Face Mask Batches - A Comprehensive Study on Particle Passage
←
→
Page content transcription
If your browser does not render page correctly, please read the page content below
101 Filtering Face Mask Batches – A Comprehensive Study on Particle Passage Lukas Tobias Hirschwald RWTH Aachen University, AVT.CVT - Chemical Process Engineering Stefan Herrmann RWTH Aachen University, AVT.CVT - Chemical Process Engineering Daniel Felder DWI – Leibniz Institute for Interactive Materials Anna Maria Kalde DWI – Leibniz Institute for Interactive Materials Felix Stockmeier DWI – Leibniz Institute for Interactive Materials Denis Wypysek DWI – Leibniz Institute for Interactive Materials Michael Alders RWTH Aachen University, AVT.CVT - Chemical Process Engineering Maik Tepper DWI – Leibniz Institute for Interactive Materials Jens Rubner RWTH Aachen University, AVT.CVT - Chemical Process Engineering Peter Brand RWTH Aachen University Hospital, Institute for Occupational, Social and Environmental Medicine Thomas Kraus RWTH Aachen University Hospital, Institute for Occupational, Social and Environmental Medicine Matthias Wessling RWTH Aachen University, AVT.CVT - Chemical Process Engineering John Linkhorst ( manuscripts.cvt@avt.rwth-aachen.de ) RWTH Aachen University, AVT.CVT - Chemical Process Engineering Research Article Keywords: 101 Filtering Face Mask Batches, Covid-19 infections, Comprehensive Study, Particle Passage, protection equipment Posted Date: June 16th, 2021
DOI: https://doi.org/10.21203/rs.3.rs-608685/v1 License: This work is licensed under a Creative Commons Attribution 4.0 International License. Read Full License
101 Filtering Face Mask Batches – A Comprehensive
Study on Particle Passage
Lukas T. Hirschwald1,♥ , Stefan Herrmann1,♥ , Daniel Felder1,2,♥ , Anna M. Kalde1,2,♥ , Felix
Stockmeier1,2,♥ , Denis Wypysek1,2,♥ , Michael Alders1 , Maik Tepper1,2 , Jens Rubner1 ,
Peter Brand3 , Thomas Kraus3 , Matthias Wessling1,2 , and John Linkhorst1,*
1 RWTH   Aachen University, AVT.CVT - Chair of Chemical Process Engineering, Forckenbeckstraße. 51, 52074
Aachen, Germany
2 DWI - Leibniz Institute for Interactive Materials, Forckenbeckstr. 50, 52074 Aachen, Germany
3 RWTH Aachen University Hospital, Institute for Occupational, Social and Environmental Medicine, Pauwelstr. 30,

52074 Aachen, Germany
♥ these authors contributed equally to this work
* manuscripts.cvt@avt.rwth-aachen.de

ABSTRACT

During the first wave of Covid-19 infections in Germany in April 2020, clinics reported a shortage of filtering face masks with
aerosol retention >94 % (FFP2 & 3, KN95, N95). Companies all over the world increased their production capacities, but quality
control of once-certified materials and masks came up short. To help identify falsely labeled masks and ensure safe protection
equipment, we tested 101 different batches of masks in 993 measurements with a self-made setup based on DIN standards.
An aerosol generator provided a NaCl test aerosol which was applied to the mask. A laser aerosol spectrometer measured
the aerosol concentration in a range from 90 to 500 nm to quantify the masks’ retention. Of 101 tested mask batches, only 31
batches kept what their label promised. Especially in the initial phase of the pandemic in Germany, we observed fluctuating
mask qualities. Many batches show very high variability in aerosol retention. In addition, by measuring with a laser aerosol
spectrometer, we were able to show that not all masks filter small and large particles equally well. In this study we demonstrate
how important internal and independent quality controls are, especially in times of need and shortage of personal protection
equipment.

Introduction
Aerosols are heterogeneous mixtures of solid or liquid suspended particles in a gas. Liquid aerosols, produced via talking,
coughing, sneezing, breathing, and singing1–5 can contain contaminants such as viruses6 . Exposure to such aerosols can
significantly increase the risk of infection. To prevent infection, personal protection equipment (PPE) can be used to shield
aerosol emissions from others, as well as for self-protection7–9 .
     One kind of PPE is face masks, which have proven to be an effective measure against aerosol infection and are common
protection equipment for medical personnel3, 10–12 . Two types of masks are used primarily: surgical masks and filtering masks.
While surgical masks are quite impermeable to moisture and therefore mainly act as a barrier, filtering masks act as depth
filters in which size-dependent adsorption of particles occurs through electrostatic interactions3, 13–16 . As filtering masks are
originally designed to protect by minimizing the inhaled concentration of airborne particles in environments with high loads of
fine particulates, various countries have classified them according to their filtration efficiency. European standards include the
filtering facepiece class 3 (FFP3) with a maximum passage of 1 % and the filtering facepiece class 2 (FFP2) with a maximum
passage of 6 % according to DIN EN 14917 . With similar testing standards and product requirements to FFP217–21 , the US
standard defines N-series (N95) with a maximal passage of 5 % according to NIOSH-42CFR8421 . The Chinese standard defines
a KN-series (KN95) with a maximal passage of 5 % according to GB 2626-200620 . In the usual certification processes, the
respective mask is initially certified for a period of up to five years and requires intermediate quality control22 .
     Due to the fast global spreading of the new coronavirus (Sars-CoV-2) at the beginning of 202023 , the World Health
Organization (WHO) declared COVID-19 a worldwide pandemic on March 11, 202024 . Although transmission of coronaviruses
may occur by direct contact or contact with contaminated surfaces3, 25 , the most probable way of infection is via droplets
and aerosols2, 3, 25, 26 . While the typical droplet size of infectious aerosols was found to be in the range of 1 µm to 20 µm and
larger2, 4, 5, 27–31 , the size of the new coronavirus is approximately 120 nm3, 4, 26, 32 . Thus, due to the recommendation of health
organizations, governments around the world stipulate using medical masks in public and, more importantly, for healthcare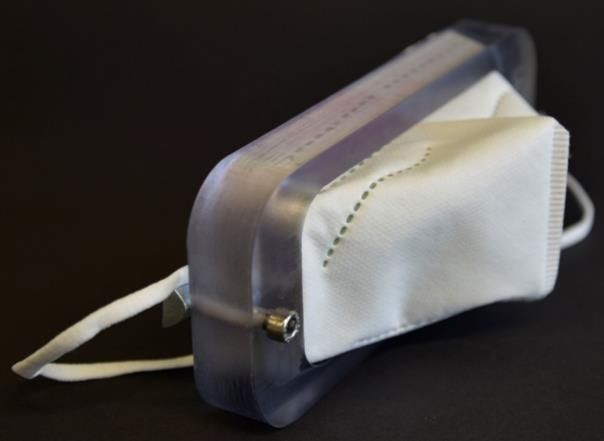
workers and infectious patients11, 33–35 .
     These worldwide recommendations added up to a drastic increase in PPE demand and a sudden shortage of face masks11, 32, 36 .
Hence, production of all types of face masks, especially of higher protection classes such as FFP2, N95 and KN95, needed
to be suddenly increased many times over. The enormous demand for face masks and hurried expansion of the production
capacity led to varying product qualities for the end customer in several cases. Due to the supply shortage of filtering masks,
new manufacturers entered the market, while at the same time, many types of masks were only insufficiently controlled due to
the limited time. This allowed counterfeit, uncontrolled and incorrectly labeled products to enter the market so that buying new
masks became dangerous12, 37–43 . As a result, researchers around the world started to work on options for the reusability of
filtering face masks44–47 .
     Also, different studies on the measurement of particle retention were reported4, 12 . Lam et al.12 measured 160 brands of
surgical masks and found that 48.8 % of the tested masks did not fulfill their standard. Schilling et al.4 presented a low-cost
setup for evaluating filtration performance and breathability of filtering face masks. The authors performed material tests of 47
non-regulated, commercially available masks and saw a poor performance for more than half of the tested masks. These studies
show that companies, hospitals, and others require validation of medical mask filtration performance.
     In this study, we present a method to evaluate the retention performance of masks and identify non-compliant masks. The
custom measurement setup allowed us to quickly and non-destructively measure a large number of masks, especially during the
early months of the pandemic. We tested 5 to 50 mask samples of 101 batches by various producers, totaling 993 measured
masks. The high number of measurements subsequently allowed robust statistical analysis of the results. Filtering face masks
were tested according to the European standard with additional insights in further product properties, such as overall rejection,
size-dependent rejection, a production period dependent product quality, and a systematic investigation of potential erroneous
parts of the mask (material, weld joints, fit).
     We show that there are substantial differences in filtration performances in all investigated protection classes. Only about a
third of all tested mask batches fulfilled their standard. Also, we found a tendency of lower protection performance for face
masks that were produced at the beginning of the COVID-19 pandemic.

Results and Discussion
Setup and Validation
The three international standards used for PPE certification require a flame photometer for particle passage determination.
This device monitors the overall passage as total mass summed up across all particle sizes, which is considered sufficient as a
lethal dose reference. In contrast, a laser spectrometer gives information on the number of particles passing the sample as a
function of particle size. By mass-weighted averaging of passing particles, redundant information to a flame photometer can be
acquired. Additionally, information on the dependency of passage on particle size allows for further statistical analysis of mask
performance. In this study, we, first, use a flame photometer and a laser spectrometer in redundancy for method validation and,
second, investigate the size-dependent protection performance of different mask batches.
     To validate the standalone use of the laser spectrometer, a flame photometer was used in parallel to quantify the aerosol
passage. The discrete measurements of the laser spectrometer were converted to an overall mass passage value to allow
comparability and validation described in the methods section. Figure 1 shows the overall passage of both detectors plotted
against each other for validation. Ideally, both detectors measure the same passage and therefore all values would lie on the
bisecting line.
     The agreement between the two measurement methods is assessed with Lawrence Lin’s concordance correlation coefficient
ρc 48, 49 (see Equation 4). The coefficient equals 1 if all points lie on the bisecting line and decreases for increasing deviations
from this line. For the full data range (Figure 1 a)) from 0 % to 100 % a ρc of 0.9987 is obtained. In the clinically relevant range
for protective face masks of up to 10 % passage (Figure 1 b)), a value of 0.95 is observed. This indicates a good agreement
between the measurements by flame photometry and laser spectroscopy. Therefore, we consider both methods equivalent.

Filtration Performance
During the first month that the pandemic hit Germany, the setup was established, and performance evaluation of different
face masks was started to help communal organizations provide safe equipment to their staff. Therefore, our results indicate
changes in the overall mask quality over the course of the pandemic. After the slackening of the pandemic situation, we used
the acquired base of data for statistical evaluation to help evaluate mask protection performance and enhance product quality
tests in the future.
    Figure 2 shows the mean passage as a measure of quality of all tested FFP2 and KN95 grade masks fabricated between
October 2019 and February 2021, each data point representing one mask batch. While FFP2 grade masks had production dates
spanning the entire measurement period, the tested KN95 grade masks were produced only between February 2020 and June
2020, resulting from a rapidly increased availability during that period.

                                                                                                                              2/12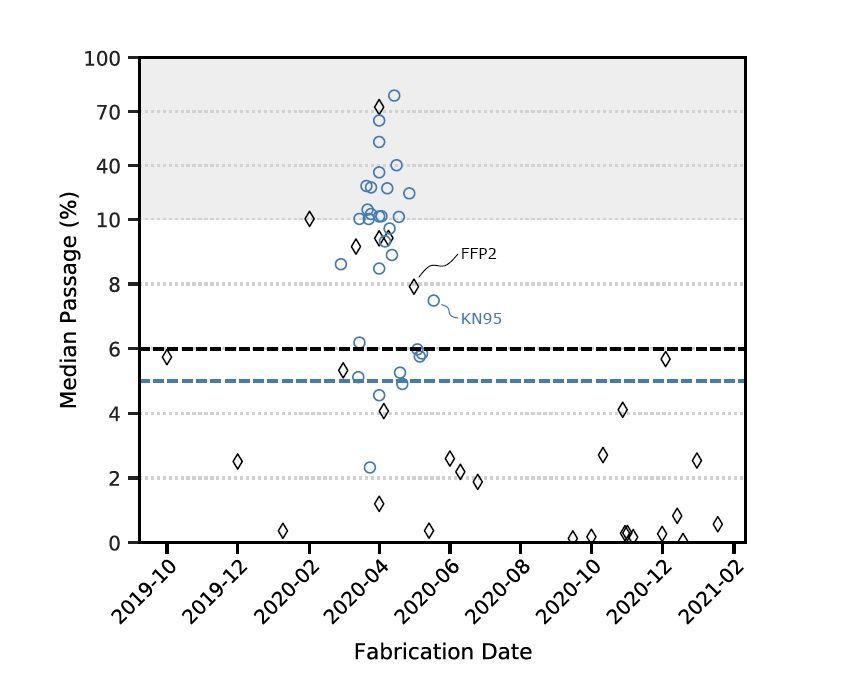
a) b)
see b)
Figure 1. Passage detected with the flame photometer plotted over the passage detected with the laser spectrometer. (a) The
entire range from 0 % to 100 % passage is plotted to show the overall agreement of both measuring methods. (b) Magnification
of the range from 0 % to 10 % in which the retention limits of all standards are located.
The mask performance results are interpreted in close temporal relation with the course of the pandemic, increase in
production capability, and mask availability. The strong decrease in mask quality starting February 2020 correlates with the
significant increase in demand during the first Covid-19 wave and the following increase in production. Our results show that
the increased production was accompanied by a decrease in mask quality. For KN95 masks, our results are limited to the
production period from February 2020 to June 2020 and do not allow us to draw conclusions on quality beyond that period. The
limited availability of FFP2 masks during that time led to an increase in the use of KN95 masks. KN95 masks were gradually
superseded by FFP2 masks on the German market as soon as their availability stabilized.
Most tested FFP2 batches comply with the specification over the whole observation time. However, between February
2020 and June 2020, which coincides with the first wave of the pandemic in Germany, the required specification is not met by
about 50 % of the batches, with one batch being completely out of specification (>70 %). In contrast, most KN95 mask batches
(92 %) do not comply with the 5 % passage specification. Hence, our results show a strong dependence of mask performance
on the temporal market situation.
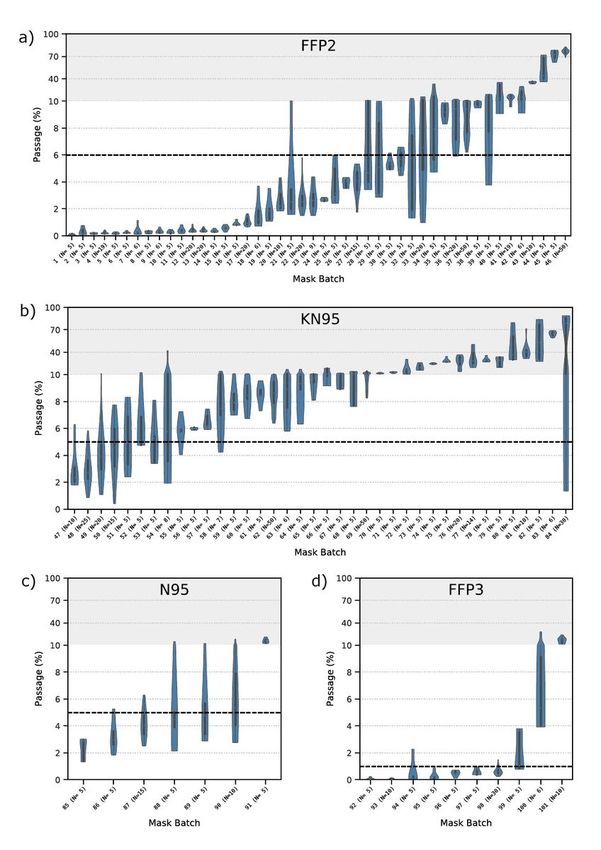
Irrespective of the mask production period, the mask performance was measured for each batch individually. The individual
mask batch results of particle passage are displayed in Figure 3. The passage of particles is displayed as violin plots, which are
similar to box plots, except that their thickness at different passages reflects the probability density of the data. In all violin
plots, the passages are averaged over all particle size classes individually detected by the laser aerosol spectrometer, allowing
for a conclusive evaluation of the spread between individual masks. This way, the data displayed here is consistent with the
data assessment in standardized mask certification. The respective standardized maximal passage is indicated by a dashed line,
while the axis is shrunk for passages above 10 %.
In Figure 3 a), passages of all investigated mask batches officially certified as FFP2 are plotted. The violin plots allow for
an evaluation of the spread of passage between individual masks in the measurement. Strong deviations in qualities can be
observed between the different mask batches. In general, three main groups of masks can be identified. First, masks that show
a passage of particles well below the standardized limit of 6 % (batches 1-20). This excellent product performance allows
for statistical deviations while still meeting the standard for every single mask. Second, a group of masks that shows particle
passage in the range of the standardized limit can be identified (batches 21-33). Most products of this group are featured
by high variability in passage between individual masks tested. This effect of high performance deviations between masks
demonstrates a significant discontinuity in product quality among single masks. With less than 20 masks being tested in the
standardized certification process, there is a high statistical risk of masks being certified that exhibit particle passages higher
than the maximum allowed passage. Hence, the variability in product performance for some product types underlines the need
for representative sample sizes to evaluate the product quality on a statistically reliable basis. Third, a group of masks can be
identified that show particle passages way above the allowed limit of 6 % (batches 34-46).
Figure 3 b) shows the violin plots of particle passage for the masks according to the KN95 standard. In contrast to the
results shown in Figure 3 a), no masks with particle passages well below the standardized limit of 5 % were found. In the group
with the best particle retention performance, masks that show particle passage in the range of the standardized limit can be
3/12
FFP2
KN95
Figure 2. Mean aerosol passage over time for ( ) FFP2 and ( ) KN95 certified masks. The gray background indicates a
change in scale in the y-axis. The dashed lines mark the 6 % and 5 % specification, respectively.
identified (batches 47-57), showing high deviations between individual masks. A second category of KN95 masks was found
with particle passages in the order of 9 % (batches 58-69). The other KN95 masks can be clustered in a third group that exhibits
very high particle passages (batches 70-84). However, it must be noted that the KN95 products investigated in this study were
all produced in the first period of the pandemic, in which also many products certified by other standards were not able to meet
the standard’s requirements.
The particle passages of N95 and FFP3 mask batches are displayed in Figure 3 c) and d), respectively. For N95 products,
most investigated batches show particle passages widely spread around the standardized limit (batches 86-90). Only one batch
of masks shows passages distinctly below the standardized limit of 5 % (batch 85), and one batch stands out with a passage of
more than 10 % (batch 91). For FFP3 products, two of the tested batches exhibit very low particle passages (batches 92-93).
Half of the as FFP3 certified mask batches show comparatively high spreads below or slightly over the standardized limit of 1 %
(batches 94-98). A third group of products, again, is featured by high particle passages of many times higher than the allowed
maximum (batches 99-101).
The certification standards require the masks to pass a mass fraction criterion of the impinged aerosol, which is in accordance
with the current understanding of toxicity referring to a certain dose50 . The analysis of the total mass, in turn, reduces the
influence of small aerosol particles on the measured performance result. Hence, masks only retaining large particles might still
pass the criterion, while the passage of small particles might be well above the limit. This certification design is suitable for
PPE applications in medical environments, where a maximum virus load must be prevented. In this context, the total amount
of virus load scales with the aerosol particle volume. Hence, a mass-weighted protection performance evaluation is a good
measure for effective human protection. In mask applications for environments containing high loads of fine particulates,
however, particle passage sensitivity towards smaller particle sizes might cause severe differences in protection performance. In
these cases, smaller particles tend to be of an elevated hazardous potential51 . Hence, the retention of small particles in these use
cases is of higher importance.
To investigate this crucial mask performance parameter, we used the particularity of the laser aerosol spectrometer of
measuring particle passages as a function of the particles’ diameters. For statistical evaluation of the size-dependent spread in
retention, we calculated the standard deviation between all measured passages of different particle size classes. We determined
the particle classes’ passages by averaging the respective size class passages over all masks contained in one batch. In
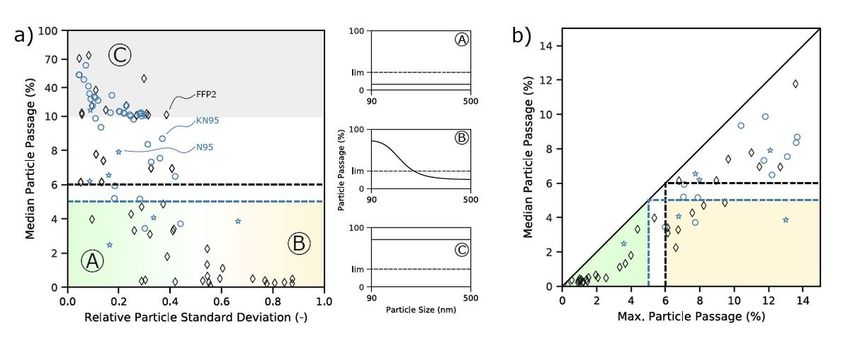
Figure 4 a), high median passages indicate low performance at most particle sizes. A small relative standard deviation of
particle passage reflects a uniform particle retention behavior over particle sizes. In contrast, a high relative standard deviation
of particle passage implies an increased spread in the passage for different particle sizes. In these cases, the measured particle
size distributions indicate that the mask still retains large particles while smaller colloids pass through.
Concerning particle passage deviation for different particle sizes, three categories can be identified. Most favorable are
masks of category A, featured by a low median passage and low relative deviation of the particle passage across all investigated
particle sizes. These masks uniformly retain particles and aerosols across the whole measured particle size range to a very
high percentage. Masks of category B show a low median passage but high deviations as a function of particle size. These
4/12a)
b)
c) d)
Figure 3. Violin plots for the 101 evaluated mask batches with 993 individual measurements. The dashed lines indicate the
standardized limits. a) FFP2. Limit of 6 %. b) KN95. Limit of 5 %. c) N95. Limit of 5 %. d) FFP3. Limit of 1 %. The gray
background indicates a change in scale in the y-axis.
5/12a) A b)
C
FFP2
KN95
B
N95
B C
A
Figure 4. Particle size-dependent retention for ( ) FFP2, ( ) KN95, and ( ) N95 masks. a) Particle median passage over the
relative standard deviation of passage over particle sizes. A, B, and C mark regimes for classification of the mask performance
of fully norm compliant (A), partially compliant (B) and non-compliant (C) mask batches. The black and blue dotted lines
represent the maximum allowed passage for FFP2, KN95, N95 standards, respectively. For the three regimes (A), (B), and (C),
the three small graphs exemplarily show the particle passage over particle size. The dotted line represents the maximum
allowed passage of 5% and 6%. b) Particle median passage over particle maximum passage. The black and blue dotted lines
represent the maximum allowed passage for FFP2, KN95, N95 standards, respectively.
products tend to retain larger particles while being more permeable to smaller ones below 100 nm. Masks of category C are
least favorable as they show a high median particle passage. The low values for the relative deviation of passage show that
these mask batches tend to be permeable across the whole span of particle sizes investigated.
In Figure 4 b), the particle median passage for all samples of one product batch and over all particle size classes is shown as
a function of the maximum particle passage observed for any particle size. This depiction allows for a distinction between
masks of three types; first, masks that comply with the maximum passage for all particle size classes (median and maximum
passage below the standardized overall maximum passage); second, masks that show higher particle passages for some particle
classes, but fulfill the required product quality of a maximum overall passage; and third, masks that do not meet the standard’s
requirements.
Conclusion and Outlook
Face masks are an effective tool to protect humans from aerosols that potentially contain viruses or other harmful substances.
Depending on the desired application, different standards according to country of origin and product quality are defined. With
the rise of the Sars-CoV-2 pandemic, the demand for face masks drastically increased in early 2020. Most severe was a scarcity
in face masks of higher protection classes such as FFP2, KN95, or N95.
The drastic increase in face mask demand led to a significant expansion of face mask production capacity. However, the
standardized certification process does not require a renewed certification after such process capacity adaptions. As a result,
incertitude evolved for end customers and raised the need for extensive studies on face mask protection behavior. In this study,
we investigated 101 batches of face masks by various manufacturers. For protection performance evaluation, we used a setup
complying with the defined standards for testing filtration performance during the face mask certification process.
Comparing the filtration performance of face masks on average over the production period, a tendency of lower protection
performance can be identified for FFP2, KN95, N95, and FFP3 face masks produced in the early phase of the pandemic.
However, all face masks investigated with a production date in the second half of 2020 or beginning of 2021 (FFP2, N95, FFP3)
meet the standards according to their certification. Overall, tremendous differences in mask performances were observed in
all protection classes. Only about a third of all mask batches investigated met the standard requirements, while another third
showed particle passages slightly over the standardized maximum passage. In turn, this means that a third of all mask batches
investigated in this study exhibited a particle passage significantly higher than the required standard, indicating a severe lack in
protection efficiency.
Further, using a laser spectrometer in our setup allowed for an additional evaluation of the particle passage as a function
of applied particle size. This analysis revealed additional differences in product quality among FFP2, KN95 and N95 mask
6/12batches. While some mask types retain all sizes of particles equally well, other mask types show a decreased particle retention
for small particles. While this complies with face mask applications for medical environments, it might be undesirable for
applications in environments with high loads of fine particulates.
Materials and Methods
Experimental Setup
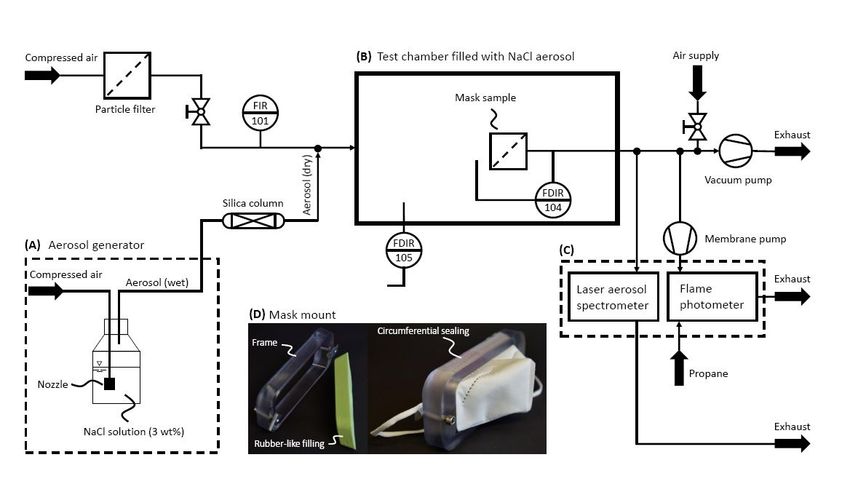
In this work, an experimental setup based on DIN EN 149 and DIN EN 13274-7 is used to test all presented face masks. The
setup consists of three main parts: an aerosol generator (A), a test chamber (B), and an aerosol analyzer (C), as shown in
figure 5.
To test face masks concerning their aerosol passage, a defined aerosol is necessary to get comparable results consistently. A
test following DIN EN 14917 requires two different test aerosols, a sodium chloride aerosol and a paraffin oil aerosol. The
sample needs to be exposed to the aerosols at an airflow rate of 95 L min−1 . To test a high amount of masks with a simple test
and with the actual use of the mask known, in this work, only sodium chloride aerosols were used to determine the aerosol
passage of face masks. The precise protocol for the aerosol passage test with sodium chloride and, thus, the requirements for
the aerosol generator are stated in DIN EN 13274-752 . To obtain the required aerosol with a median in particle size distribution
between 0.06 µm0.06 µm and 0.10 µm0.10 µm, an aerosol concentration between 4 mg m−3 and 12 mg m−3 in the test chamber,
and a relative humidity of 40 % or less at 22 °C a ’Portable Test Aerosol Generator 3073’ (TSI Inc., Shoreview (US)) is used.
The aerosol generator produces the aerosol by pumping compressed air through a nozzle submerged in a 3 wt% sodium chloride
solution. To dry the wet aerosol produced by the generator, the stream is passed through a silica column. In this work, a
’3062-NC Diffusion Dryer’ (TSI Inc., Shoreview (US)) is used. The tubing between the aerosol generator and the silica column
is heated to prevent condensation of wet aerosol on the tubing walls, especially during the long experiments needed to test
large numbers of masks in a row. A ’T-570’ (Winkler AG, Heidelberg (DE)) temperature controller with an ’HBSI 100 W’
(Horst GmbH, Lorsch (DE)) heating tape is used. Condensation would result in a decreased aerosol concentration and possibly
a change in particle size distribution leading to insignificant test results. The dried aerosol stream is mixed with additional
compressed air, as shown in the left part of Figure 5 to reach 95 L min−1 .The additional compressed air is filtered through a
submicro filter ’SMF 0002’ (Landefeld GmbH, Kassel (DE)) prior to the mixing point to prevent changes in the test aerosol
caused by particles in the compressed air.
The generated aerosol is fed into a test chamber (see Figure 5 (B)). The test chamber needs to be closed against the
environment and must provide an appropriate and sealed fixation for face masks. The airflow needs to be withdrawn from the
test chamber behind the face mask, and the withdrawn air needs to be fed to suitable analyzers. In this work, a ’Smart Store
45L’ (Orthex Group, Lohja (FI)) storage box is used as a test chamber. The storage box comes with a lid and is stable and
sealed when a vacuum of up to 20 mbar under ambient pressure is applied. All tubing is connected to the test chamber with
suitable IQS fittings. To perfuse the tested face mask with the required flow rate of 95 L min−1 a vacuum pump behind the
sealed face mask withdraws the air from the test chamber. A ’WD 5 P’ (Kärcher SE & Co. KG, Winnenden (DE)) is used in
this work. The complete air needs to pass through the mask to leave the test chamber. The tests are conducted with a pressure
difference between −3 mbar to −7 mbar compared to ambient pressure. The pressure difference between the inside of the test
chamber and ambient pressure is monitored by a differential pressure sensor (105). A second differential pressure sensor (104)
measures the pressure drop of the face mask.
The test chamber needs to be divided into two parts by the face mask: the part in front of the mask, where the test aerosol
is fed into, and a part behind the mask, where the air is withdrawn from the test chamber and fed to the aerosol analyzer to
measure the aerosol concentration. To avoid leakage of particles, the mask needs to be tightly sealed. A mask mount was
specifically designed to ensure tight sealing of the mask and for easy operation during sample change (see Figure 5 (D)).
The mask mount consists of a stable, 3D-printed frame and a silicone inlay. The inlay was produced by using the frame
as a mold. The face mask is clamped between frame and inlay for tight sealing during the measurement. The design of the
mask holder ensures an identical filter area for each inserted mask. To account for different face mask shapes, slight deviations
(aspect ratio and circumference) from the original design were fabricated to ensure identical filtration area and tight sealing.
To analyze the aerosol concentration, DIN EN 13274-7 states an aerosol flame photometer with sample ports in front of
the face mask and behind the face mask. In this work, a ’FP 8400’ (Krüss Optronic GmbH, Hamburg (DE)) is used (see
Figure 5 (C)). The flame photometer measures the concentration of sodium chloride in a gas stream by combustion in a flame.
The flame is created by the combustion of propane with filtered and compressed air. Photo diodes detect the color change
of the flame due to the combustion of sodium. The aerosol-containing sample flow is withdrawn from the tubing behind the
test chamber by a membrane pump (KNF Neuberger GmbH, Freiburg (DE)), as shown in the right part of Figure 5, and fed
to the flame photometer. Furthermore, a laser aerosol spectrometer (LAS) ’3340 A’ (TSI Inc., Shoreview (US)) is used for
aerosol concentration measurements (see Figure 5 (C)). The LAS counts particles flowing through a measurement volume by
measuring light scattering induced by particles crossing a laser beam. Thus, the LAS measures the number of particles and
7/12Compressed air (B) Test chamber filled with NaCl aerosol Air supply
Mask sample
Particle filter FIR
101
Exhaust
Aerosol (dry)
Vacuum pump
FDIR
Silica column 104
FDIR Membrane pump
(A) Aerosol generator (C)
105
Compressed air Exhaust
Aerosol (wet)
Laser aerosol Flame
spectrometer photometer
(D) Mask mount
Circumferential sealing
Frame
000 Propane
Nozzle
NaCl solution (3 wt%) Exhaust
Rubber-like filling
Figure 5. Flowchart of mask testing rig. (A) Aerosol generation. (B) Test chamber, pressure drop across the mask and
pressure in the test chamber relative to ambient pressure are measured. (C) Aerosol detection with a laser aerosol spectrometer
as well as a flame photometer. (D) Mask mount consisting of a stable frame and a rubber-like filling. Mask installed into the
mount shown on the right side.
the related particle size distribution in the sample flow. The used LAS measures 99 particle size classes of 4.5 % class width
between 90 nm and 7.5 µm. The LAS was connected to the outlet tubing of the test chamber, next to the sample port for the
flame photometer. The LAS is equipped with a sample pump. Thus, no additional pump is needed.
Experimental Method
In the experimental setup, two measurements are necessary to evaluate the filtration performance of a face mask. The first
measurement is a reference measurement, obtaining information on the aerosol in the test chamber. Therefore the mask mount
is placed in the test chamber without a face mask installed. This measurement is also used to validate the generated aerosol and
particle concentration in the test chamber with DIN EN 149. During the measurement, the test chamber is closed. The aerosol
concentration and particle counts over one minute are measured for five consecutive minutes using the flame photometer and
LAS. The first two minutes of each measurement are excluded from the evaluation of the mask’s filtration performance. As
flow rates are slow compared to the length of tubing, this time is needed to reach equilibrium in the whole system.
After the reference measurement, the experiment with a mounted mask is performed. The sample holder is placed in the
test chamber after checking for tight sealing of the mask. The filtration performance of the face mask is then calculated by
using the collected data of minutes three to five. For evaluation of the filtration performance, the test measurement is compared
to the reference measurement. When using the LAS, a correction term is used to calculate mass concentrations of the aerosol.
This calculation procedure is described in the next section.
Data Evaluation
The detected mass of particles mi per particle class i is calculated from the LAS data by averaging the particle count Ni per size
over three minutes multiplied by the individual particle mass normalized by the mean sample volume flow V̇sample :
3
Ni dmin,i · π 1
mi = · ·ρ · (1)
3 min 6 V̇sample
Here, the particle mass is calculated as the particle’s minimum volume with diameter dmin . The density ρ cancels out when
calculating the particle passage per size:
8/12mfilter,i
Pi = (2)
mreference,i
The variables mfilter,i and mreference,i are the particle mass per size with and without an installed filter, respectively. For the
comparison to the results from the flame photometer, the mean particle passe is calculated as:
∑i mfilter,i
Ptotal = (3)
∑i mreference,i
The concordance correlation coefficient49 between two measurement methods x and y is calculated as
2sxy
ρc = (4)
s2x + s2y + (x̄ − ȳ)
where sx and sy are the variances of the data set x and y and sxy is the covariance. x̄ and ȳ are the arithmetic means.
Statistical evaluation was done in Python using pandas53, 54 and seaborn55 , visualizing the results in Matplotlib56 . Violin
plots were created with the standard seaborn implementation and consist of a median boxplot in the center and symmetric
density distribution of measurement points.
References
1. Abkarian, M., Mendez, S., Xue, N., Yang, F. & Stone, H. A. Speech can produce jet-like transport relevant to asymptomatic
spreading of virus. Proc Natl Acad Sci U S A 117, 25237–25245, DOI: 10.1073/pnas.2012156117 (2020).
2. Mick, P. & Murphy, R. Aerosol-generating otolaryngology procedures and the need for enhanced PPE during the COVID-
19 pandemic: a literature review. J. otolaryngology - head & neck surgery 49, 29, DOI: 10.1186/s40463-020-00424-7
(2020).
3. Sommerstein, R. et al. Risk of SARS-CoV-2 transmission by aerosols, the rational use of masks, and protection of
healthcare workers from COVID-19. Antimicrob. Resist. & Infect. Control. 9, 100, DOI: 10.1186/s13756-020-00763-0
(2020).
4. Schilling, K. et al. An accessible method for screening aerosol filtration identifies poor-performing commercial masks and
respirators. J. exposure science & environmental epidemiology 1–10, DOI: 10.1038/s41370-020-0258-7 (2020).
5. Ng, C. S. et al. Growth of respiratory droplets in cold and humid air. Phys. Rev. Fluids 6, 054303, DOI: 10.1103/
PhysRevFluids.6.054303 (2021).
6. Fennelly, K. P. Particle sizes of infectious aerosols: implications for infection control. The Lancet Respir. Medicine 8,
914–924, DOI: 10.1016/S2213-2600(20)30323-4 (2020).
7. Ağalar, C. & Öztürk Engin, D. Protective measures for COVID-19 for healthcare providers and laboratory personnel.
Turkish journal medical sciences 50, 578–584, DOI: 10.3906/sag-2004-132 (2020).
8. Cook, T. M. Personal protective equipment during the coronavirus disease (COVID) 2019 pandemic - a narrative review.
Anaesthesia 75, 920–927, DOI: 10.1111/anae.15071 (2020).
9. Verbeek, J. H. et al. Personal protective equipment for preventing highly infectious diseases due to exposure
to contaminated body fluids in healthcare staff. The Cochrane database systematic reviews 4, CD011621, DOI:
10.1002/14651858.CD011621.pub2 (2016).
10. Leung, N. H. et al. Respiratory virus shedding in exhaled breath and efficacy of face masks. Nat. Medicine 26, 676–680,
DOI: 10.1038/s41591-020-0843-2 (2020).
11. MacIntyre, C. R. & Chughtai, A. A. A rapid systematic review of the efficacy of face masks and respirators against
coronaviruses and other respiratory transmissible viruses for the community, healthcare workers and sick patients. Int.
journal nursing studies 108, 103629, DOI: 10.1016/j.ijnurstu.2020.103629 (2020).
12. Lam, S. C., Suen, L. K. P. & Cheung, T. C. C. Global risk to the community and clinical setting: Flocking of fake
masks and protective gears during the COVID-19 pandemic. Am. journal infection control 48, 964–965, DOI: 10.1016/
j.ajic.2020.05.008 (2020).
13. Smith, J. D. et al. Effectiveness of N95 respirators versus surgical masks in protecting health care workers from acute
respiratory infection: A systematic review and meta-analysis. Cmaj 188, 567–574, DOI: 10.1503/cmaj.150835 (2016).
9/1214. Kowalski, W., Bahnfleth, W. P. & Whittam, T. Filtration of airborne microorganisms: Modeling and Prediction. ASHRAE
Transactions 105, 4–17 (1999).
15. Barrett, L. W. & Rousseau, A. D. Aerosol Loading Performance of Electret Filter Media. American Industrial Hygiene
Association Journal 59, 532–539, DOI: 10.1080/15428119891010703 (1998).
16. Brown, R. Electrically charged filter materials. Engineering Science and Education Journal 1, 71–79, DOI: 10.1049/ESEJ:
19920016 (1992).
17. DIN EN 149:2009-08. Respiratory protective devices - Filtering half masks to protect against particles - Requirements,
testing, marking. Eur. standard DOI: 10.31030/1527555 (2009).
18. 3M Personal Safety Division. Comparison of FFP2, KN95, and N95 Filtering Facepiece Respirator Classes. Tech. Bull.
(2020).
19. Bosch, R. 2020-03: Schutzmasken FFP2 (EN 149:2001) und KN95 (GB 2626-2006) zum Coronaschutz (SARS-CoV-2)
sind miteinander vergleichbar. https://www.din.de/de/mitwirken/normenausschuesse/fnfw/2020-03-schutzmasken-ffp2-
en-149-2001-und-kn95-gb-2626-2006-zum-coronaschutz-sars-cov-2-sind-miteinander-vergleichbar--709924 (2020).
[Online; accessed 08-March-2021].
20. GB 2626-2006. Respiratory protective equipment: Non-powered air-purifying particle respirator. China Natl. Inst.
Standardization (2006).
21. NIOSH 42CFR84. APPROVAL OF RESPIRATORY PROTECTIVE DEVICES. United States Natl. Inst. for Occup. Saf.
Heal. (NIOSH) (2019).
22. Regulation (EU) 2016/425. Personal Protective Equipment. Official Journal of the European Union (2016).
23. Sohrabi, C. et al. World Health Organization declares global emergency: A review of the 2019 novel coronavirus
(COVID-19). Int. journal surgery (London, England) 76, 71–76, DOI: 10.1016/j.ijsu.2020.02.034 (2020).
24. Cucinotta, D. & Vanelli, M. WHO Declares COVID-19 a Pandemic. Acta bio-medica : Atenei Parmensis 91, 157–160,
DOI: 10.23750/abm.v91i1.9397 (2020).
25. Jayaweera, M., Perera, H., Gunawardana, B. & Manatunge, J. Transmission of COVID-19 virus by droplets and aerosols: A
critical review on the unresolved dichotomy. Environ. research 188, 109819, DOI: 10.1016/j.envres.2020.109819 (2020).
26. Liu, Y. et al. Aerodynamic analysis of SARS-CoV-2 in two Wuhan hospitals. Nature 582, 557–560, DOI: 10.1038/s41586-
020-2271-3 (2020).
27. Papineni, R. S. & Rosenthal, F. S. The size distribution of droplets in the exhaled breath of healthy human subjects. J.
aerosol medicine : official journal Int. Soc. for Aerosols Medicine 10, 105–116, DOI: 10.1089/jam.1997.10.105 (1997).
28. Xie, X., Li, Y., Sun, H. & Liu, L. Exhaled droplets due to talking and coughing. J. Royal Soc. Interface 6 Suppl 6,
S703–14, DOI: 10.1098/rsif.2009.0388.focus (2009).
29. Morawska, L. et al. Size distribution and sites of origin of droplets expelled from the human respiratory tract during
expiratory activities. J. Aerosol Sci. 40, 256–269, DOI: 10.1016/j.jaerosci.2008.11.002 (2009).
30. Lindsley, W. G. et al. Quantity and size distribution of cough-generated aerosol particles produced by influenza patients
during and after illness. J. occupational environmental hygiene 9, 443–449, DOI: 10.1080/15459624.2012.684582 (2012).
31. Milton, D. K., Fabian, M. P., Cowling, B. J., Grantham, M. L. & McDevitt, J. J. Influenza Virus Aerosols in Human Exhaled
Breath: Particle Size, Culturability, and Effect of Surgical Masks. PLOS Pathog. 9, 1–7, DOI: 10.1371/journal.ppat.1003205
(2013).
32. Chua, M. H. et al. Face Masks in the New COVID-19 Normal: Materials, Testing, and Perspectives. Research 2020, 1–40,
DOI: 10.34133/2020/7286735 (2020).
33. RKI - Robert Koch Institut. COVID-19 (Coronavirus SARS-CoV-2). https://www.rki.de/DE/Content/InfAZ/N/
Neuartiges_Coronavirus/nCoV.html (2021). [Online; accessed 22-March-2021].
34. World Health Organization. Mask use in the context of COVID-19. https://www.who.int/publications/i/item/advice-
on-the-use-of-masks-in-the-community-during-home-care-and-in-healthcare-settings-in-the-context-of-the-novel-
coronavirus-(2019-ncov)-outbreak (2021). [Online; accessed 19-March-2021].
35. Centers for Disease Control and Prevention. How COVID-19 Spreads. https://www.cdc.gov/coronavirus/2019-ncov/
prevent-getting-sick/how-covid-spreads.html (2021). [Online; accessed 18-March-2021].
36. Livingston, E., Desai, A. & Berkwits, M. Sourcing Personal Protective Equipment During the COVID-19 Pandemic. JAMA
323, 1912–1914, DOI: 10.1001/jama.2020.5317 (2020).
10/1237. ORF.at. Zahlreiche Händler stoppen Maskenverkauf. https://orf.at/stories/3203893/ (2021). [Online; accessed 05-March-
2021].
38. Stiftung Warentest. FFP2-Masken im Test - 3M schützt am besten. https://www.test.de/Masken-Welcher-Mund-Nasen-
Schutz-hilft-am-besten-gegen-Corona-5692592-0/ (2021). [Online; accessed 26-February-2021].
39. Makrite Industries Inc. Statement from Makrite Industries Inc. http://www.makrite.com/statement-from-makrite-industries-
inc-6/ (2021). [Online; accessed 26-February-2021].
40. Daragahi, B. & Independent, T. ‘Total disregard for people’s lives’: Hundreds of thousands of fake masks flooding markets
as coronavirus depletes world supplies. https://www.independent.co.uk/news/health/coronavirus-face-mask-fake-turkey-
medical-supply-shortage-covid-19-a9423426.html (2020). [Online; accessed 18-March-2021].
41. Metzger, N. & ZDF. Labore sehen Qualitätsmängel bei FFP-Masken. https://www.zdf.de/nachrichten/panorama/corona-
ffp2-masken-maengel-100.html (2021). [Online; accessed 11-March-2021].
42. Ippolito, M., Gregoretti, C., Cortegiani, A. & Iozzo, P. Counterfeit filtering facepiece respirators are posing an additional
risk to health care workers during COVID-19 pandemic. Am. journal infection control 48, 853–854, DOI: 10.1016/
j.ajic.2020.04.020 (2020).
43. Centers for Disease Control and Prevention. Counterfeit Respirators / Misrepresentation of NIOSH-Approval. https:
//www.cdc.gov/niosh/npptl/usernotices/counterfeitResp.html (2021). [Online; accessed 19-March-2021].
44. Anderegg, L. et al. A scalable method of applying heat and humidity for decontamination of N95 respirators during the
COVID-19 crisis. PLOS ONE 15, 1–9, DOI: 10.1371/journal.pone.0234851 (2020).
45. Liao, L. et al. Can N95 Respirators Be Reused after Disinfection? How Many Times? ACS Nano 14, 6348–6356, DOI:
10.1021/acsnano.0c03597 (2020).
46. Kim, H. P., Jo, M. S., Kim, C. H., Choi, J. S. & Yu, I. J. Re-use of health masks after autoclaving. NanoImpact 19, DOI:
10.1016/j.impact.2020.100231 (2020).
47. Wang, D. et al. Can Masks Be Reused After Hot Water Decontamination During the COVID-19 Pandemic? Engineering
6, 1115–1121, DOI: 10.1016/j.eng.2020.05.016 (2020).
48. Watson, P. & Petrie, A. Method agreement analysis: a review of correct methodology. Theriogenology 73, 1167–1179
(2010).
49. Lawrence, I. & Lin, K. A concordance correlation coefficient to evaluate reproducibility. Biometrics 255–268 (1989).
50. Rozman, K. K. & Doull, J. Dose and time as variables of toxicity. Toxicology 144, 169–178 (2000).
51. Donaldson, K., Li, X. & MacNee, W. Ultrafine (nanometre) particle mediated lung injury. J. aerosol science 29, 553–560
(1998).
52. DIN EN 13274-7:2019-09. Respiratory protective devices - Methods of test - Part 7: Determination of particle filter
penetration. Eur. standard DOI: 10.31030/3049135 (2019).
53. Wes McKinney. Data Structures for Statistical Computing in Python. In Stéfan van der Walt & Jarrod Millman (eds.)
Proceedings of the 9th Python in Science Conference, 56 – 61, DOI: 10.25080/Majora-92bf1922-00a (2010).
54. The pandas development team. pandas-dev/pandas: Pandas, DOI: 10.5281/zenodo.3509134 (2020).
55. Waskom, M. L. seaborn: statistical data visualization. J. Open Source Softw. 6, 3021, DOI: 10.21105/joss.03021 (2021).
56. Hunter, J. D. Matplotlib: A 2d graphics environment. Comput. Sci. & Eng. 9, 90–95, DOI: 10.1109/MCSE.2007.55 (2007).
Acknowledgements
Matthias Wessling acknowledges the European Research Council Advanced Investigator Program (694946) for financial support
and DFG funding through the Gottfried Wilhelm Leibniz Award 2019 (WE 4678/12-1). The authors acknowledge the funding
provided by the Federal Ministry of Education and Research (BMBF) and the Ministry of Culture and Science of the German
State of North Rhine-Westphalia (MKW) under the Excellence Strategy of the Federal Government and the Länder.
The authors thank TSI Inc. for support on analysis equipment and A.Krüss Optronic GmbH for providing the flame
photometer, Georg Linz for equipment procurement, ZUMOLab GmbH, Christian Moritz, and Stefanie Kriescher for support
with sensor integration, and FURTHRresearch GmbH & Co. KG, Hannah Roth, Daniel Menne, and Hanna Wolff for support
with research data management.
The authors also acknowledge support with mask measurements from Sandra Gelbach, Heike Zander, Lea Steinbeck,
Florian Pradellok, Arne Lüken, Berinike Bräsel, Matthias Geiger, Christian Linnartz, Niklas Köller, Dana Kaubitzsch, Kristina
11/12Baitalow, Jan Vehrenberg, Hannah Roth, Korcan Percin, Jonas Lölsberg, Johannes Lohaus, Georg Linz, Lucas Stüwe, Sebastian
Rauer, Maike Bruckhaus, Jonas Bässler, Maren Großeheide, Maria Padligur, Tobias Harhues, Elizaveta Evdochenko, Mojtaba
Mohseni, Hanna Wolff, Stephan Musholt, Fabian Rüttnauer, Jannis Müller-Dott, Petar Peric, Johanna Güttler, Kaspar Deffner,
Fabian Edwin, Alexander Schrade, Miriam Schaake, Richard Dunkel, and Sharon-Virginia Pape.
Author contributions statement
L.H., S.H., D.F., A.K., F.S., D.W.: Conception and design of the setup and the experiments; Acquisition, analysis, and
interpretation of the data; Original draft, review, and editing of the work. M.A., M.T., J.R.: Conception and design of the setup
and the experiments; Acquisition, analysis, and interpretation of the data. P.B., T.K.: Interpretation of the data; Substantive
revision and editing of the work. M.W.: Interpretation of the data; Substantive revision and editing of the work; Initialization
and supervision of the project; Funding acquisition and resource supply. J.L.: Conception and design of the setup and the
experiments; Interpretation of the data; Substantive revision and editing of the work; Initialization and supervision of the
project; Funding acquisition and resource supply.
Additional information
Competing financial interests: The authors declare no competing interests.
Supplementary information: The dataset, including all raw data and supplementary information for this paper, is available at
https://doi.org/10.18154/RWTH-2021-05390.
12/12Figures Figure 1 Passage detected with the ame photometer plotted over the passage detected with the laser spectrometer. (a) The entire range from 0% to 100% passage is plotted to show the overall agreement of both measuring methods. (b) Magni cation of the range from 0% to 10% in which the retention limits of all standards are located.
Figure 2

Mean aerosol passage over time for (◊) FFP2 and (Ο) KN95 certi ed masks. The gray background
indicates a change in scale in the y-axis. The dashed lines mark the 6% and 5% speci cation, respectively.
Figure 3

Violin plots for the 101 evaluated mask batches with 993 individual measurements. The dashed lines
indicate the standardized limits. a) FFP2. Limit of 6 %. b) KN95. Limit of 5 %. c) N95. Limit of 5 %. d)
FFP3. Limit of 1 %. The gray background indicates a change in scale in the y-axis.
Figure 4 Particle size-dependent retention for (◊) FFP2, (Ο) KN95, and () N95 masks. a) Particle median passage over the relative standard deviation of passage over particle sizes. A, B, and C mark regimes for classi cation of the mask performance of fully norm compliant (A), partially compliant (B) and non- compliant (C) mask batches. The black and blue dotted lines represent the maximum allowed passage for FFP2, KN95, N95 standards, respectively. For the three regimes (A), (B), and (C), the three small graphs exemplarily show the particle passage over particle size. The dotted line represents the maximum allowed passage of 5% and 6%. b) Particle median passage over particle maximum passage. The black and blue dotted lines represent the maximum allowed passage for FFP2, KN95, N95 standards, respectively.
Figure 5

Flowchart of mask testing rig. (A) Aerosol generation. (B) Test chamber, pressure drop across the mask
and pressure in the test chamber relative to ambient pressure are measured. (C) Aerosol detection with a
laser aerosol spectrometer as well as a ame photometer. (D) Mask mount consisting of a stable frame
and a rubber-like lling. Mask installed into the mount shown on the right side.

Supplementary Files
This is a list of supplementary les associated with this preprint. Click to download.

    SIData.zip
    SI.pdf
You can also read