System Dynamics and Innovation in Food Networks 2013
←
→
Page content transcription
If your browser does not render page correctly, please read the page content below
System Dynamics and Innovation
in Food Networks
2013
Proceedings of the 6thInternational European Forum on System Dynamics and Innovation in
Food Networks, organized by the International Center for Food Chain and Network
Research, University of Bonn, Germany
February 18-22, 2013, Innsbruck-Igls, Austria
officially endorsed by
EAAE(European Association of Agricultural Economists)
IFAMA (International Food and Agribusiness Management Assoc.)
AIEA2 (Assoc. Intern. di Economia Alimentare e Agro-Industriale)
CIGR (Intern. Commission of Agric. and Biosystems Engineering)
INFITA (Intern. Network for IT in Agric., Food and the Environment)
edited by
U. Rickert and G. Schiefer
2013, Universität Bonn-ILB, Germany, Order Address:
ISSN 2194-511X Department of Food and Resource Economics, University of Bonn
Meckenheimer Allee 174, D-53115 Bonn, Germany
Published by Phone: ++49-228-733500, Fax: ++49-228-733431
Universität Bonn-ILB Press, Bonn e-mail: uf.ilr@uni-bonn.de
(Rheinische Friedrich-Wilhelms-Universität Bonn, Printed by
Institut für Lebensmittel- und Ressourcenökonomik) Universitätsdruckerei der Rheinischen Friedrich-Wilhelms-Universität
Bonn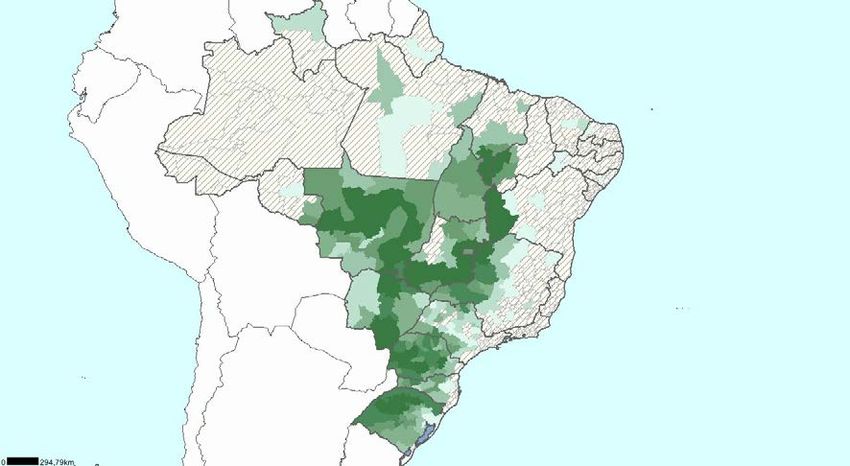
Aziz Galvão da Silva Júnior et al.

     Importance of the Main Agribusiness Products to the Brazilian Economy

    Aziz Galvão da Silva Júnior1, Bruna do Valle Rodriguez Neves2, Marina Macedo Rocha3,
                    Artur Henrique Leite Falcette , and Abdias Garcia Machado
            1
              Agricultural Economics Department. Federal University of Viçosa, Brazil.
        2
          Agricultural and Environmental Engineering Federal University of Viçosa, Brazil.
                  3
                    Agribusiness Management Federal University of Viçosa, Brazil
                                            aziz@ufv.br

Abstract
The performance of the agribusiness sector has significantly contributed to the consolidation of the
Brazilian economy, which is currently the sixth largest in the world. The sector is responsible for 27%
of the Gross Domestic Product (GDP). Moreover, it also accounts for nearly 40% of the values
generated in the export and employs around 26% of the economically active population of the
country. The objective of this paper is to present and discuss updated information regarding the
importance of the main products of the agribusiness sector to the Brazilian economy. Special
attention was given to the beef and soybean chain. The perspective and challenges of the sector are
briefly presented.

Keywords: agribusiness, agricultural products, Brazil

1       Introduction
Brazil has very favorable conditions for agricultural production as diversified climate, regular
rainfall, abundant solar energy, almost 13% of all available fresh water on the planet and
plenty of arable land.

Brazil is the fifth largest country in area in the world. According to the Research Institute of
Amazonia - IPAM, the potential area for farming in the country ranges from 303 million
hectares to 366 million hectares, ie 36% to 43% of the national territory. Such land
availability puts the country in a leading position in the global agribusiness scenario.

                                                 492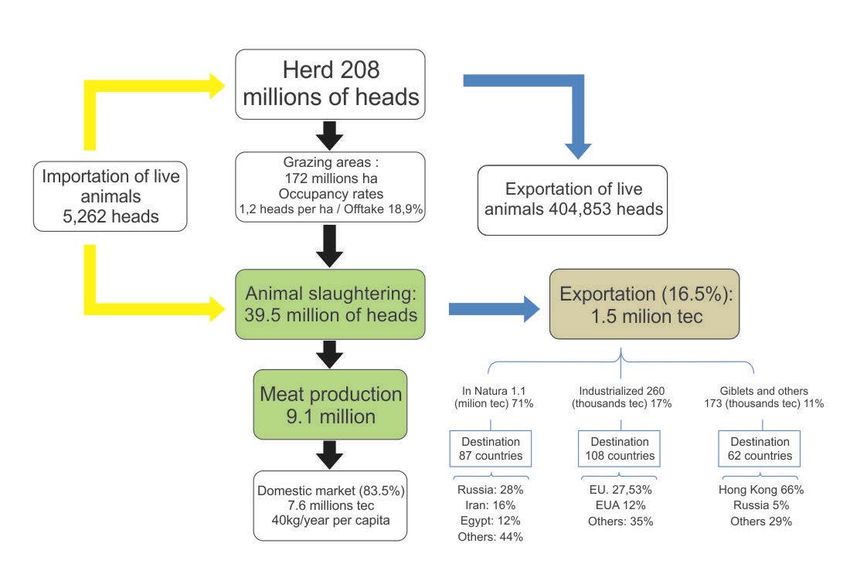
Aziz Galvão da Silva Júnior et al.

 Figure 1. Brazilian main regions and its available arable land compared with selected countries. Source FAO,
                                       prepared by The Economist, 2010.

The modernization of the Brazilian agribusiness has resulted in significant growth in
international trade, although it is still small considering the recent country development,
GDP and regional leadership. According to the International Monetary Fund - IMF, the
country's GDP in 2011 was U.S. $ 2.493 trillion, representing a stake of 2.9% in world GDP.
According to World Trade Organization (WTO) in its annual statistics of foreign trade, Brazil
is at 22nd in the world ranking of exporters and accounted for 1.4% of global sales.

The agribusiness export increased by almost 400% in the last 10 years (MAPA, 2012). Grain
production has also expanded allowing the attendance of increasing share of the world
demand. The United Nations Conference on Trade and Development (UNCTAD) predicts that
the country will be the world's largest producer of food in the next decade.

Basically, the country increased its exports by diversifying its key destinations, which
historically were concentrated in Latin America, the United States and Western Europe.
Currently countries like China, Japan and Saudi Arabia are also among the biggest buyers of
Brazilian agribusiness products

The agribusiness exports have guaranteed for a decade the Brazilian trade surplus. Despite
the international economic crisis, the fall in the average price of some important products
for the trade balance and the occurrence of adverse weather, agribusiness secured new
record for exports in 2012 reached the mark of U.S. $ 95.8 billion (MAPA, 2012).

In this scenario, some products are critical to the success of Brazilian agribusiness. The
country is a world leader in the production and export of several agricultural products. It is
the leading producer and exporter of coffee, sugar and orange juice. Moreover, leads the
ranking of external sales of alcohol and chicken (MAPA, 2012). The country is also among
one of world leading producers of cotton and biofuels made from sugar cane and vegetable

                                                     493
Aziz Galvão da Silva Júnior et al.
oils. Corn, rice, fresh fruits, cocoa, chestnuts, walnuts, plus pork and fish also are featured in
the Brazilian portfolio. The market share of world production and exports of Brazilian
products is depicted below.
Figure 2. Brazilian world share on production and exports of selected agricultural products. USDA, cited by The
Economist, 2010.
2 Main Products
The Brazilian grain production, which in 1991 was around 60 million tons cultivated in an
area of 38 million hectares reached, in 2011, a record of 162.8 million tons and a gross
production value of around R$ 215 billion, occupying a area of 50 million hectares (MAPA,
2012). The main grains produced are soybeanns and corn, which reached a production of
75.3 and 57.4 million tons respectively in 2011 (CONAB, 2012).
216,3
211,2
190,9
182,2187,6
174,4173,1
billios R$
166,6
153,6
146,7146,5
129,1
121,3126,2 126,3 116,5
1997 1998 1999 2000 2001 2002 2003 2004 2005 2006 2007 2008 2009 2010 2011 2012
Year
Figure 3. Gross value of production (vegetal products): Source IBGE/FGVDADOS. AGE/MAPA
494Aziz Galvão da Silva Júnior et al.
Coffee is also a very important item. Brazil is by far the largest producer and exporter and
the second largest consumer of coffee in the world. The estimation of national coffee
production for the crop of 2012 is 3 million tons (IBGE, 2012).
After a severe crisis in the 90’s, the cotton production chain has re-emerged as an organized
and competitive production chain in the savannah region of Brazil. Capitalized soybean
farmers adopted modern technology in production and first processing on the farm. Brazil
currently ranks 3rd and 5th place in cotton seed and cotton lint production, respectively. The
country has also gain a World Trade Organization (WTO) dispute settlement against USA for
unfair subsidies on cotton (Schnepf, 2011).
The export competitiveness of the Brazilian orange juice sector is impressive. Consolidated
after the 70’s and 80’s frost in the Florida, USA, the Brazilian producers in the State of São
Paulo, adopt modern technology and count with a competitive and internationally driven
industry. According to NEVES (2012) “Brazil produces the half of the orange in the planet,
bringing it from US$ 1.5 billion to US$ 2.5 billion in orange juice eports annually. In nearly 50
years, the citrus supply chain has brought in nearly US$ 60 billion to Brazil directly from
orange juice consumers.
The sugar cane sector has a great importance for the Brazilian economy since the colonial
period. The sector GDP is around US$ 28.1 billion, equivalent of almost 2% of the Brazilian
GDP – or almost all the income generated in a year in a country like Uruguay. The majority of
the industry’s inputs are local, explaining its favorable trade balance situation (NEVES, 2010).
Brazil has a consolidated biofuels program since the middle of the 70’s based on ethanol
from sugar cane, with give an additional contribution to the competitiveness of the sector.
The animal production in Brazil occupies the whole country and has an utmost historical,
social and economical important. The main meat production chains (cattle, chicken and pig)
are efficient and organized around an internationally very competitive industrial sector. In
2011 Brazil produced respectively 11,04; 9,22 and 3,23 million ton of chicken, cattle and pig
meat, and contributed to 12,33%; 14,78% and 2,97% to the world production, also of
chicken, cattle and pig meat. (FAOSTAT, 2011).
Although Brazil ranks worldly in the first place of chicken and cattle meat export and fourth
in pig meat, the internal consumption is very important as respectively 86%, 88% and 79% of
whole production is directed to the internal market.
The cow milk has reached a production of around 32 million ton of raw cow milk in 2011,
which represents 5,29% of the world production. The milk production is especially important
to around 1 million small scale farmers spread around the country, although a core of
100,000 dairy farmers supply most of the milk processed by licensed processors. The
industrial sector is in process of modernization and the sector faces challenges in improving
the agricultural efficiency to meet increasing quality requirements.
The poultry and pig industry are well organized and very competitive. They are organized
under contract and are closely linked to the grain production (maize and soybean). In 2011
495Aziz Galvão da Silva Júnior et al.
the gross value of the Brazilian production has reached 15,7 billion US$ for the chicken meat
and 4,9 billion US$ for pigmeat (FAOSTAT).
Considering the value of production the 20 important products of the Brazilian agribusiness
are listed below
Table 1. Brazilian value of production in billion US$.
1 Indigenous Cattle Meat 24.96
2 Sugar cane 23.89
3 Soybeans 18.16
4 Indigenous Chicken Meat 15.73
5 Cow milk, whole, fresh 9.91
6 Indigenous Pigmeat 4.96
7 Oranges 3.83
8 Rice, paddy 3.40
9 Maize 2.96
10 Coffee, green 2.90
11 Cotton lint 2.39
12 Bananas 2.06
13 Beans, dry 1.97
14 Hen eggs, in shell 1.69
15 Cashewapple 1.69
16 Tomatoes 1.63
17 Tobacco, unmanufactured 1.51
18 Cassava 1.33
19 Cottonseed 1.03
20 Grapes 88
Source: FAOSTAT, 2011.
The cattle meat and soybean production chain will be discussed next.
Cattle Meat
The Brazilian livestock sector has undergone huge changes in the last few years, especially
the ones related to the applications of more efficient production techniques, such as the
development of forages adapted for local conditions, diet supplementation, selection and
systematic genetic improvement and reproduction techniques such as artificial insemination
in a fixed time and embryo transference. These technologies brought to the sector
extraordinary gains of volume and productivity, determining factor to put Brazil in a leading
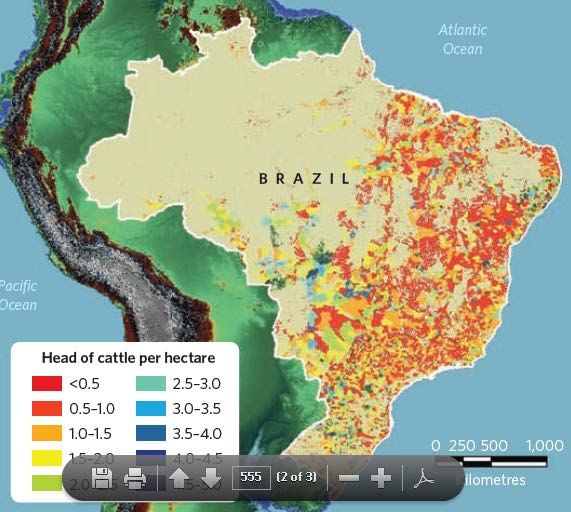
position as a beef producer. The following map depicts the distribution of beef production in
Brazil.
496Aziz Galvão da Silva Júnior et al.
Figure 4. Distribution of cattle production in Brazil. Source Nature, 2010.
In the year of 2011, more than 39.5 million heads were slaughtered and 404,853 were
exported, alive. In addition to being a big exporter, Brazil is also a great beef consumer and,
according to data from ABIEC (Brazilian Association of Beef Export Industries), in the year of
2011, the Brazilian internal market consumed 83.5% of the 9.1 million tons in equivalent
carcass (tec) of the meat produced. The other 16.5% were exported in great part in natura
(71%); but also industrialized (17%). The insides and others represent 11% of the total
exported (ABIEC, 2011).
497Aziz Galvão da Silva Júnior et al.
Figure 5. Meat production chain description in 2011, in Brazil. Source: CNA, Sigma Consultoria, SECEX,IBGE,
ABIEC (2011).
Soybean
Between the 1960s and the 1970s, the southern region, especially the states of Rio Grande
do Sul and Paraná, was the one with significant soybean production in the country. Currently
the largest national producer of the grain in volume is the State of Mato Grosso.
After the 1980s, the region called cerrado formed by the Triângulo Mineiro, the states of
Mato Grosso do Sul, Mato Grosso, Goiás, Tocantins, the south of Maranhão, south of Piauí
and western Bahia consolidated itself as the largest soybean producer in the country.
Studies about soil fertilization, plain topography and the development of appropriated
varieties to this region were the main factor which contributed to the expansion of the
cultivation in cerrado.
The country passed from an incipient producer, to the second largest in the world, besides
being the largest exporter of the product. The Brazilian soy reaches, nowadays, the most
rigorous markets in a global scale, such as the European, and it highlights itself for its quality.
Brazil had some changes not only because of the amount of soybean produced. Nowadays
the central-west region is the largest producer and it was unthinkable some decades before,
since this region was considered infertile and inappropriate to the agricultural cultivation
(EMBRAPA, 2004).
It is important to stress that the soybean production in Brazil is very closely linked to the
poultry and pig industry.
The figure below depicts the distribution of soybean production in Brazil.
498Aziz Galvão da Silva Júnior et al.
Figure 5. Soybean production in Brazil. Source: IBGE, 2006.
Brazil becomes more and steadier in the soy production because of its structure in the chain
over the time and because of the high investments made by Brazilian people and foreigners.
However, there are a lot of points to be improved, mainly the ones related to the logistics of
production flow. At this point, Brazil is quite behind the countries considered its competitors
in the soy market, since 65% of the agricultural production is directed to the Brazilian
highway network, where according to the National Company of Transports, only 3.5% of
these highways are paved.
The consequences of this barrier affect the price of the commodity and consequently, its
competitiveness. Alternatively, the climate, the rainfall regime and the higher cost of
production than the Brazilian one, equalize the balance of this competition. In the last
American harvest (2011/12), the climate worried the buyers, because the hot and dry
weather damaged the growth of the plants, reducing the productivity and the volume fixed
for the harvest. Besides the climatic diversity in the USA, the reduction of the American and
the Chinese soy area encourage the Brazilian spy plantation.
The internal market has been growing with the use of the grain to produce biodiesel and it
also encourages the plantation. The main competitor tillage, the corn one, has good
prospects to the season of 2011/12, but the speed of sales in the crop turns the soy more
attractive (FNP CONSULTORIA & COMÉRCIO, 2012).
3 Final Remarks
Brazil is an important food producer in the world. The share that Brazilian agribusiness
occupies in the world trade makes the country an economic reference and, on top of it all, a
reference to food safety when it comes as questions about the availability of food in the
world. However, the country has a potential to be better than it is currently. Some sectors
could improve their techniques and chains. Others still could expand the explored area.
According to a report of the Ministry of Agriculture, Livestock and Supply of Brazil (MAPA,
2012), the most dynamic products of Brazilian agribusiness in the next decade should be
cotton, soybeans, chicken, sugar, corn and cellulose.
499Aziz Galvão da Silva Júnior et al.
The growth of agricultural production in Brazil should continue to be based on productivity
gains. For grains (rice, beans, soybeans, corn and wheat), for a 21% increase in production
acreage is expected to expand by only 9% between 2011/2012 and 2021/2022. Despite
strong growth in exports, the domestic market will continue to be an important growth
factor. For soybeans, for example, 56% of production shall be for the domestic market.
Projections for meat production for Brazil show that the sector must present strong growth
in the coming years. Among meats, projecting higher growth rates of production in the
period 2011/2012 to 2011/2022 are the chicken, which is expected to grow annually at a
rate of 4.2% and beef, which is expected to grow at a rate 2.1% per year. The pig meat has
projected a growth of 2% (MAPA, 2012).
The Brazilian participation in world trade in soybeans, beef and chicken meat will grow and
continue to be highly significant. The Brazilian soybeans should take 2021/2022 participation
in exports in the world for 43% to 23.2% beef and chicken 43.5%. Besides the importance in
relation to those goods Brazil will maintain leadership in the global trade in coffee and sugar.
References
BCB, 2013. - Banco Central do Brasil. Disponível em: . Acessado em
Jan/2013.
Brugnaro, R. 2006. Determinantes da participação da Agropecuária no PIB do Brasil e dos EUA. Tese
Mestrado. ESALQ.
Dobson, W. D.; Jesse, E. V.; Reis, R. B. 2006. The dairy sector of Brazil: a country study. Babcock
Institute Discussion Paper 2008-3. Wisconsin University.
European Comission, 2006. Brazil’s Agriculture Survey. MAP. Monitoring Agri-Trade Policy. No. 02-
06. Nov. 2006.
FAO, 2006. Livestock long shadow: environmental issues and options. LEAD-FAO, 2006.
FAOSTAT. 2011. http://faostat.fao.org/
FMI, 2012. - Fundo Monetário Internacional. World Economic Outlook, 2012.
The Economist, 2010. Brazilian Agriculture: The miracle of the Cerrado. 26th October, 2012.
IBGE, 2012. Instituto Brasileiro de Geografia e Estatística. 12º avaliação da produção nacional de
cereais, leguminosas e oleaginosas. Disponível em: < http://www.ibge.gov.br >. Acesso em: Jan,
2012.
IBGE, 2012. Instituto Brasileiro de Geografia e Estatística. Levantamento Sistemática do Produção
Agrícola. Rio de Janeiro v.25 n.11 p.1-84 novembro,2012 .
IBGE, 2006. Instituto Brasileiro de Geografia e Estatística. SIDRA. http://www.sidra.ibge.gov.br
IPAM, 2009. - Instituto de Pesquisa Ambiental do Amazonas. Alcance territorial da legislação
ambiental e a consolidação do uso agropecuário de terras no Brasil.
MAPA, 2012. Ministério da Agricultura, Pecuária e Desenvolvimento. Disponível em: <
http://www.agricultura.gov.br/>. Acesso em: Jan, 2012.
MAPA, 2012. Projeções do agronegócio. Available at
http://www.agricultura.gov.br/arq_editor/file/Ministerio/gestao/projecao/Projecoes%20do%20
Agronegocio%20Brasil%202011-20012%20a%202021-2022%20-%20Sintese%282%29.pdf.
500Aziz Galvão da Silva Júnior et al.
Neves, M. F. 2012. The competitiveness of the orange juice chain in Brazil. In IFAMA Conference.
June 9th-14th June, 2012.
Neves, M. F. 2010. Measurement of sugar cane cahin in Brazil. International Food and Agribusiness
Management Review, Volume 13, Issue 3, 2010.
Schnepf, R. 2011. Brazil’s WTO case against the US cotton program. Congressional research service.
RL32571. Jun. 2011.
Scolari, D. D. G. 2006. Produção agrícola mundial: o potencial do Brasil. Embrapa.
Tollefson, L. 2007. The global Farm. Nature, vol. 406. 29. July.
World Bank. 2013. Disponível em: . Acessado em
Jan/2013.
WTO, 2013. - World Trade Organization. International Trade Statistics. World trade
developments 2011. Disponível em:
. Acesso:
Jan/2013.
501You can also read