Sustainable Horticultural Land Use Opportunities for the Tararua District Prepared for Tararua District Council - Independent Agriculture & ...
←
→
Page content transcription
If your browser does not render page correctly, please read the page content below
Independent
Agriculture
& Horticulture
Consultant
Network

Sustainable Horticultural Land Use
Opportunities for the Tararua District

Prepared for
Tararua District Council

 AgFirst Consultants HB Ltd
 Peer reviewed by Plant & Food Research
 March 2020

TABLE OF CONTENTS
1.0 Executive Summary ......................................................................................................... 4
2.0      Introduction .................................................................................................................. 14
3.0      Climate Analysis............................................................................................................. 17
   3.1      Air Temperature ........................................................................................................ 17
   3.2      Growing Degree Days (GDD)...................................................................................... 20
   3.3      Frost Free Period (FFP) .............................................................................................. 20
   3.4      Chilling Units (CU) ...................................................................................................... 21
   3.5      Annual Precipitation .................................................................................................. 21
4.0      Soils and Land Use Capability ........................................................................................ 23
   4.1      Introduction ............................................................................................................... 23
   4.2      Tararua Soils & Soil Properties ................................................................................... 27
      4.2.1        Soil Drainage....................................................................................................... 28
      4.2.2        Potential Rooting Depth ..................................................................................... 29
      4.2.3        Available Water .................................................................................................. 30
      4.2.4        Erosion Risk ........................................................................................................ 30
      4.2.5        Elevation ............................................................................................................. 32
   4.3      Conclusion ................................................................................................................. 34
5.0      Environmental Aspects of Permanent Horticultural Crops ........................................... 35
   5.1      Nitrogen ..................................................................................................................... 35
   5.2      Phosphorus ................................................................................................................ 36
   5.3      Efficiency of Uptake ................................................................................................... 37
6.0      Blueberry ....................................................................................................................... 37
   6.1      Blueberry: Background .............................................................................................. 37
   6.2      Blueberry: Soils .......................................................................................................... 38
   6.3      Blueberry: Climate ..................................................................................................... 39
      6.3.1        Frost Tolerance................................................................................................... 39
      6.3.2        Chill Hours .......................................................................................................... 39
      6.3.3        Temperature ...................................................................................................... 40
      6.3.4        Water Requirements .......................................................................................... 40
   6.4      Blueberry: Environmental .......................................................................................... 41
      6.4.1        Nutrition ............................................................................................................. 41
      6.4.2        Leaching loss ...................................................................................................... 42
   6.5      Blueberry: Markets .................................................................................................... 42
      6.5.1        Global ................................................................................................................. 42
      6.5.2        Domestic ............................................................................................................ 43
   6.6      Blueberry: Infrastructure and Investment ................................................................. 43
                                                                                                         1|Page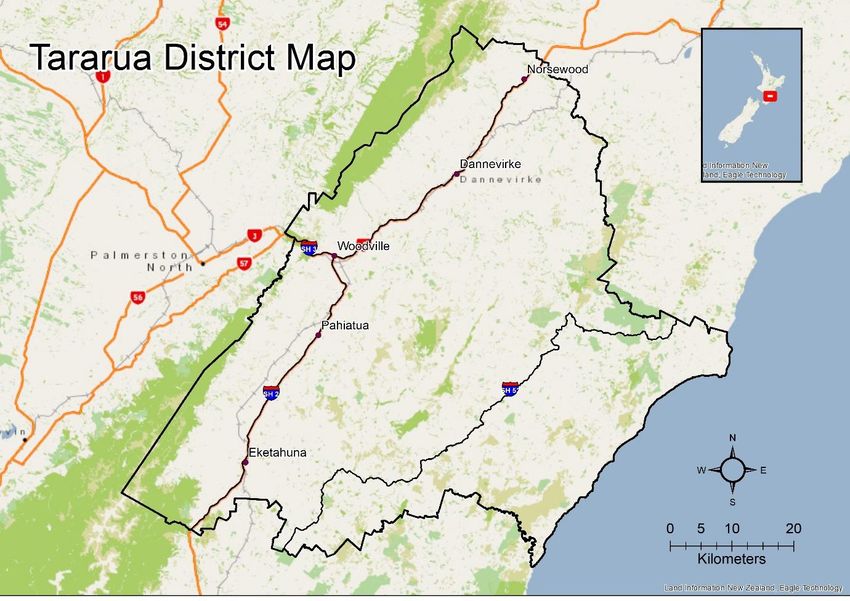
6.6.1       Blueberry Model Farm – Capital Investment and Gross Margin ........................ 44
      6.6.2       Assumptions ....................................................................................................... 46
      6.6.3       Harvest and Harvest Machinery ......................................................................... 47
  6.7      Blueberry: Resource Limitations ................................................................................ 48
  6.8      Blueberry: Skills and Labour ...................................................................................... 49
  6.9      Blueberry: Conclusion ................................................................................................ 50
7.0     Cider Apple .................................................................................................................... 52
  7.1      Cider Apple: Background ........................................................................................... 52
  7.2      Cider Apple: Soils ....................................................................................................... 52
  7.3      Cider Apple: Climate .................................................................................................. 53
  7.4      Cider Apple: Environmental ....................................................................................... 54
      7.4.1       Nutrition ............................................................................................................. 54
      7.4.2       Water ................................................................................................................. 55
      7.4.3       Leaching Loss...................................................................................................... 56
  7.5      Cider Apple: Markets ................................................................................................. 57
  7.6      Cider Apple: Infrastructure and investment .............................................................. 58
      7.6.1       Cider Apple Model Farm – Capital Investment and Gross Margin ..................... 59
      7.6.2       Assumptions ....................................................................................................... 60
      7.6.3       Harvest machinery ............................................................................................. 61
  7.7      Cider Apple: Resource limitations.............................................................................. 61
  7.8      Cider Apple: Skills and Labour ................................................................................... 62
  7.9      Cider Apple: Conclusion ............................................................................................. 63
8.0     Feijoa ............................................................................................................................. 65
  8.1      Feijoa: Background .................................................................................................... 65
  8.2      Feijoa: Soils ................................................................................................................ 65
  8.3      Feijoa: Climate ........................................................................................................... 66
  8.4      Feijoa: Environmental ................................................................................................ 66
      8.4.1       Nutrition ............................................................................................................. 66
      8.4.2       Water ................................................................................................................. 67
      8.4.3       Leaching loss ...................................................................................................... 67
  8.5      Feijoa: Markets .......................................................................................................... 67
  8.6      Feijoa: Infrastructure and Investment ....................................................................... 68
      8.6.1       Feijoa Model Farm – Capital Investment and Gross Margin .............................. 69
  8.7      Feijoa: Resource Limitations ...................................................................................... 71
  8.8      Feijoa: Skills and Labour ............................................................................................ 71
  8.9      Feijoa: Conclusion ...................................................................................................... 72

                                                                                                                              2|Page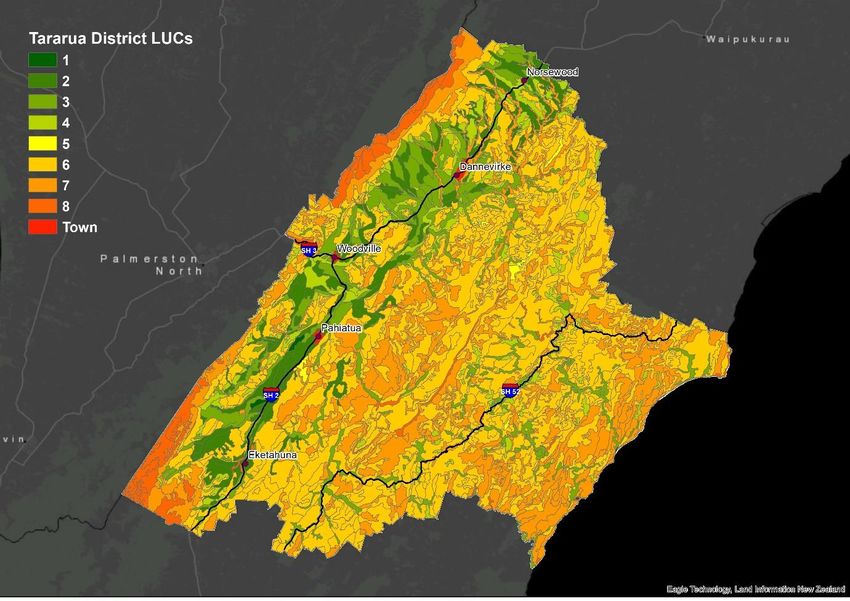
9.0      Hazelnuts ....................................................................................................................... 74
   9.1       Hazelnut: Background................................................................................................ 74
   9.2       Hazelnut: Soils ........................................................................................................... 74
   9.3       Hazelnut: Climate ...................................................................................................... 75
      9.3.1        Temperature ...................................................................................................... 75
      9.3.2        Water Requirements .......................................................................................... 76
   9.4       Hazelnut: Environment .............................................................................................. 76
      9.4.1        Nutrition ............................................................................................................. 76
      9.4.2        Leaching loss ...................................................................................................... 77
   9.5       Hazelnut: Markets ..................................................................................................... 77
      9.5.1        Global Market and Trends .................................................................................. 77
      9.5.2        Domestic Opportunities ..................................................................................... 78
   9.6       Hazelnut: Infrastructure and Investment .................................................................. 79
      9.6.1        Hazelnut Model Farm – Capital Investment and Gross Margin.......................... 80
      9.6.2        Hazelnut Assumptions ........................................................................................ 81
      9.6.3        Hazelnut Harvest Machinery .............................................................................. 82
   9.7       Hazelnut: Resource Limitations ................................................................................. 83
   9.8       Hazelnut: Skills and Labour ........................................................................................ 83
   9.9       Hazelnut: Conclusion ................................................................................................. 85
10.0 References..................................................................................................................... 87
   10.1         General................................................................................................................... 87
   10.2         Cider Apple............................................................................................................. 87
   10.3         Feijoa...................................................................................................................... 87
   10.4         Blueberry................................................................................................................ 88
   10.5         Hazelnut ................................................................................................................. 89

                                                                                                                              3|Page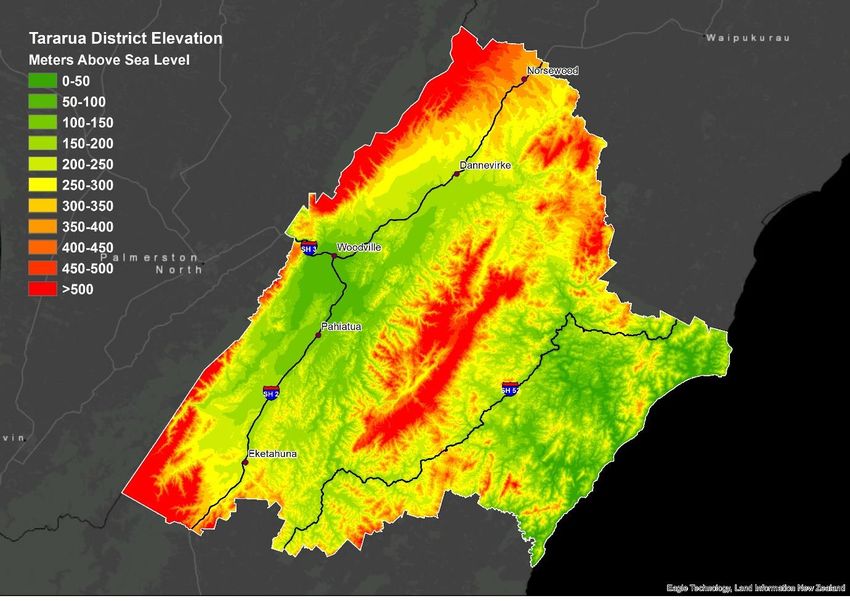
1.0      EXECUTIVE SUMMARY
The Tararua District Council has commissioned this project to evaluate four alternative
horticultural land uses for farmers of the Tararua District, including:
        Blueberry
        Cider Apple
        Feijoa
        Hazelnut

These land uses were selected by Tararua District Council based on previous knowledge from
the Go Project and the Tararua Districts strengths and vision of the future. Tararua District
Council chose feijoas and hazelnuts as these were part of an earlier study and there are
growers of these crops in the district. It was important to update earlier data on these two
crops and explore current market opportunities. Blueberries were selected as they are a crop
experiencing high growth at present. Cider apples were chosen as there are currently
shortages in New Zealand and it is a growing industry. Cider apples also offer potential to
support a future tourism industry if successful in much the same way as other regions have
successful winery tourism.

The scope of the project was to evaluate the topography, climate, and soils of the Tararua
District and determine whether the alternative land use options were environmentally and
economically sustainable. In particular, these permanent crops can have much lower carbon
footprints, lower nitrogen leaching losses and higher margins. The report also outlines the
potential markets, resource limitations and skill sets needed for each land use option.

Climate
The climate analysis revealed that altitude has a strong impact on several key climate metrics
across the Tararua District. Areas with higher altitudes (particularly Eketahuna and Norsewood)
recorded lower maximum, minimum and average temperatures and more days with
temperatures less than 0°C, resulting in fewer Growing Degree Days (GDDs) and a shorter
growing season.

In general, the average temperatures throughout the Tararua district support all the proposed
land use options. Rainfall timing is a limiting factor for some of the land use options.
Precipitation at flowering can inhibit flowering and pollination, ultimately leading to lower
yields. Precipitation at harvest can increase incidence of fruit splitting, rots and diseases.
Furthermore, rain at harvest can create situations where mechanical harvesters slip or slide on
wet surfaces, causing harvesters to damage trees or trellising.

Topography and Soils
The Tararua District is large with an approximate land area of 4,364 km2. Approximately 13%
of that land is classified as LUC 1, LUC 2, or LUC 3 and is preliminarily suitable for intensive
horticulture.

                                                                                    4|Page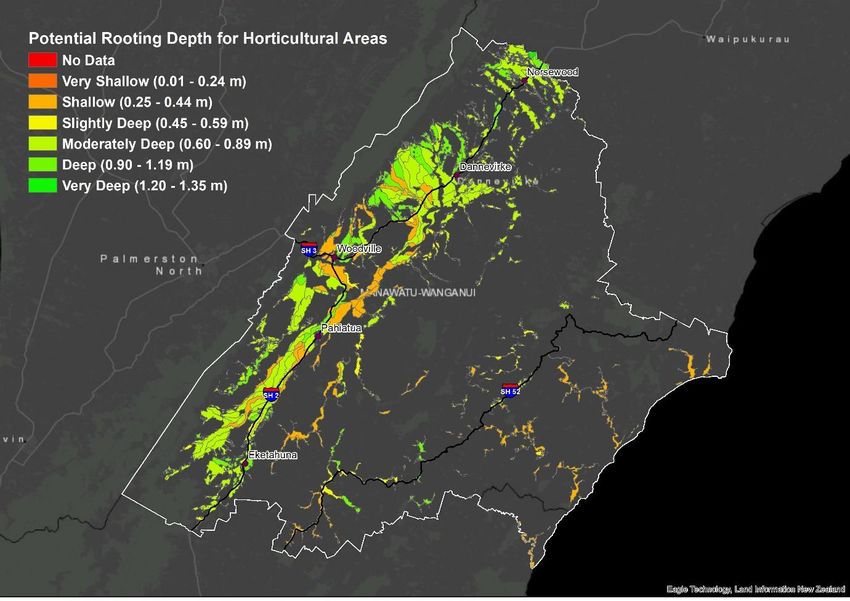
Soil physical properties and wetness are the primary soil limitations in the area designated for
horticulture, however, with slight to moderate soil modification, most of the land area should
be able to support at least one of the proposed land use options (i.e. blueberry, cider apple,
feijoa, or hazelnut production). In areas where soil modification is not an option, blueberries
could be grown in containers on top of the soil.

Elevation, and its impact on climate, is likely to be more of a limiting factor than physical soil
properties. Elevation will dictate the air temperature, rainfall pattern and length of growing
season and therefore limit land use options.

Environment
Nitrogen loss data in New Zealand is difficult to find for even the large horticultural tree or vine
crops (vineyards, pipfruit and kiwifruit). Most of the work done to date in reference to these
crops is modelling in either the Overseer or SPASMO modelling systems. Modelling shows
common ranges of nitrogen loss of 2kg N/ha/year up to 25 kg N/ha/year. With good
environmental management, all systems are expected to leach under 20kg nitrogen/ha/year.
This is low relative to current losses modelled for dairy farm systems in the Tararua district.
Most high value horticulture is placed on flat land, and in this case the risk of phosphorus runoff
is minor.

Economics
All the land use options are economically viable if well managed. The gross margins are very
sensitive to yield and return $/kg fruit. Low yields combined with poor quality fruit will result
in a significantly lower gross margin. These gross margins are example systems which will
change depending on the limitations for a specific location and the management of the farm
system.

Table 1.1- Financial Summary of Model Farms
                             Gross Margin     Development Cost      Breakeven
 Crop                              ($/ha)               ($/ha)     (No. Years)
 Blueberry                        $51,710             $281,130             11
 Cider Apple                      $14,510              $35,000               8
 Feijoa                           $10,038              $22,500               9
 Hazelnut                         $12,898              $35,000             11

Markets
There are currently no established markets within the Tararua District for the proposed land
use options. Local markets (e.g. farmers markets and local retail outlets) will need to be
developed.

                                                                                        5|Page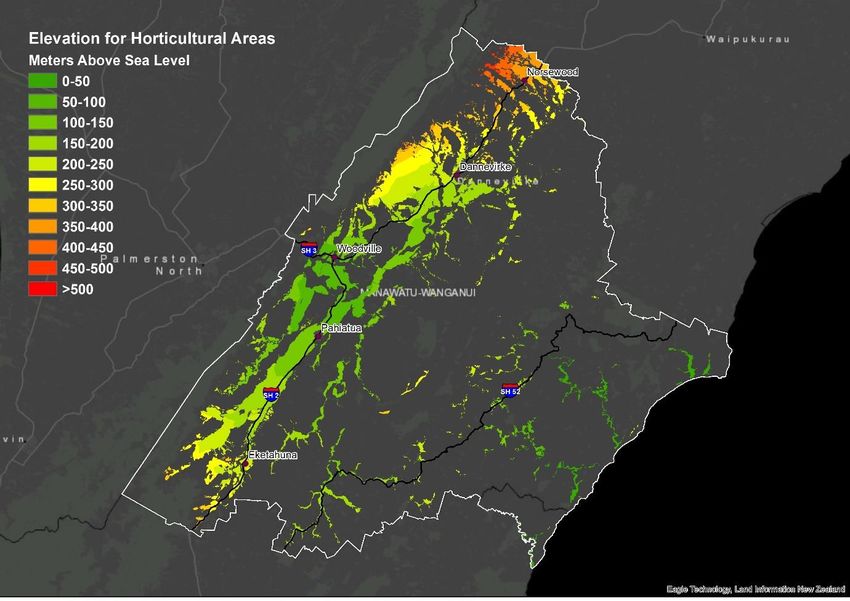
There are domestic and export markets established for all the land use options. The processing
facilities for these markets lie outside of the Tararua District, and to take advantage of the
these, a shipping and distribution network needs to be set up.

Resource Limitations
All the proposed land use options have the similar resource limitations including:
        Poor availability and supply of plant material
        Absence of consultancy support and local grower networks
        Lack of harvesting resources (both contract pickers and mechanized harvesters)
        No local processing facilities

Skill Sets
Each land use option will require a manger with fruit production experience, an interest in
learning and troubleshooting, and most importantly, a passion for horticultural production.
Specifically, a manager will need a range of skills including fruit tree husbandry, plant nutrition
and irrigation knowledge, plant pest and disease knowledge, and experience in staff and
contractor management.

Blueberry Summary
Blueberries will grow in the Tararua under weather protection. Some areas that are warmer
micro-climates with less flowering and harvest time rainfall may gain acceptable levels of
production with field grown blueberries, however, the year to year risk of losing a crop means
that growing plants in raised beds/containers and under tunnel house is the preferred option
for the Tararua.

Irrigation will be required, and it is advisable to connect to a fertigation system so that each
container gets the precise amount of water and nutrition is requires.

Flat land will be necessary, but the soil type can be anything not prone to surface ponding if
growing in raised containers. Nutrient losses will be able to be managed to near 0 kg N/ha/year
in this system, while in field grown systems, losses will be able to be carefully managed down
to the same range as apples at 3 to 24kg N/ha/year.

Undercover blueberries are a profitable option but require the availability of large amounts of
capital to set up.

Land area required is lower than other crop options in this study to make a functioning
business. A small blueberry operation could be set up with just 5ha of land, where the manager
is also a hands-on farm worker. Very small operations of 1 to 2ha can be viable in the same
way, and the manager might only work part time on the blueberry operation.

                                                                                       6|Page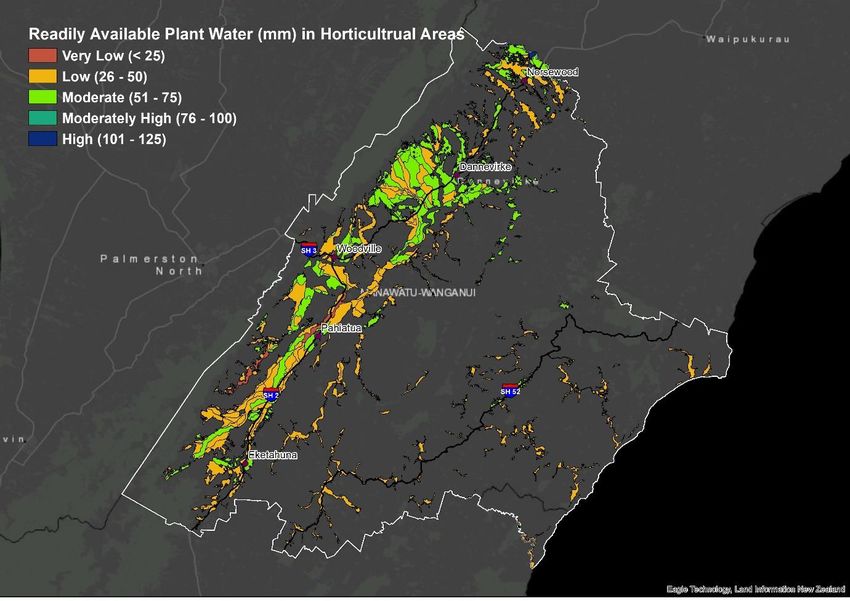
Main resource limitations include access to plants and varieties, people skilled in growing the
fruit, harvest labour and postharvest facilities to pack and store the fruit.

Table 1.2- Blueberry Summary Table
 Crop                                Blueberry
 Temp / GDD                          Mean summer temp 15 to 26°C
 Frost                               Protect from flowering to -2°C. Frosts from flowering
                                     below -3°C unsuitable.
 Frost free period                   >160 days
 Winter Chill                        800 to 1200 hours. Less than 700 unsuitable.
 Flowering time                      Varies depending on cultivar and climate from August to
                                     November
 Harvest time                        December to March
 Rainfall                            Annual 800 to1000mm. Rain at flowering and harvest an
                                     issue
 Wind                                Require shelter-live shelter belts and sheltered
                                     microclimates
 Slope                               Flat (indoor) to undulating (field grown) 0 - 7°
 Soil depth                          >60cm best.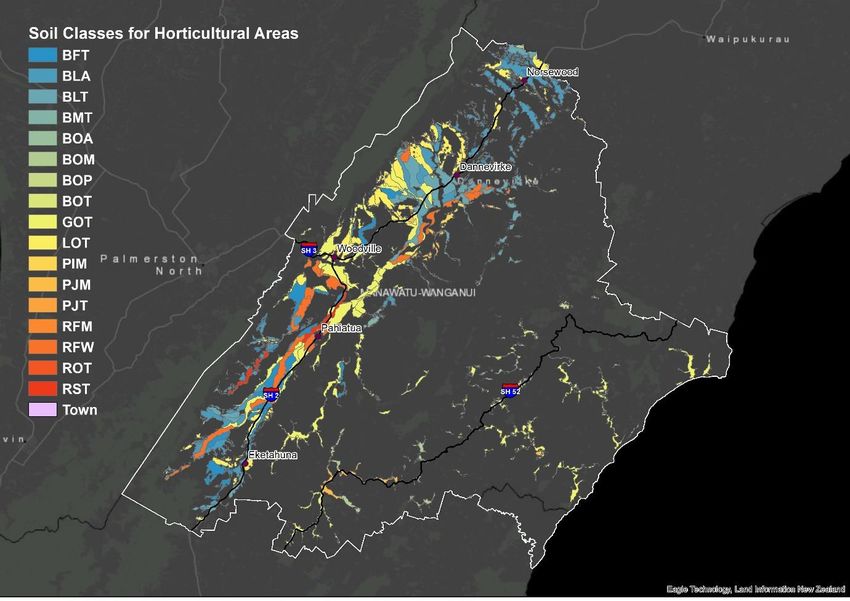
Cider Apple Summary
Cider apples will grow in the Tararua district in the warmer and drier areas of Woodville,
Pahiatua and Dannevirke. In these areas, they will need good frost protection, shelter belts
and specific attention needs to be paid to rainfall at the flowering time of the variety chosen.
Lack of pollination due to rain, disease being spread by water and wet soils dropping flowers
are all risks of growing apples in the Tararua District.

Well drained soils are important, whether naturally or tile drained to 1m depth. Apple trees
are good at accessing water, and roots go deep, so water for irrigation may only be necessary
when young. This avoids the need to install a permanent irrigation system. However,
consented water should be available to irrigate trees in hot summers when roots are still
shallow.

Flat to mildly rolling land will be usable and soils should be 70cm or more in depth. Avoid very
heavy clay soils or pans, and soils that stay saturated into spring.

Nutrient losses were modelled on Overseer and with management focus can be reduced to 10
to 20kg N/ha/year.

Cider apples will always complete with export over-run fruit in New Zealand, however there is
demand from cider makers to have access to cider-specific varieties. The gross margin is
attractive but could easily be eaten into by extra costs of coolstorage of fruit, or longer
transport distances.

Land area required for a cider apple orchard at a minimum is defined by the need for volume
support a machine harvester. Export apple orchards in Hawke’s Bay can operate at 10ha, with
a manager who also works on hands-on jobs. However, a cider apple orchard in the Tararua
will need 30-40 ha to cover costs of machine harvesting equipment, and in this case can hire a
full-time manager and one orchard worker on the property.

Main resource limitations include access to plants and varieties, people skilled in growing the
fruit, machine harvesting equipment and distance to storage facilities.

                                                                                    8|Page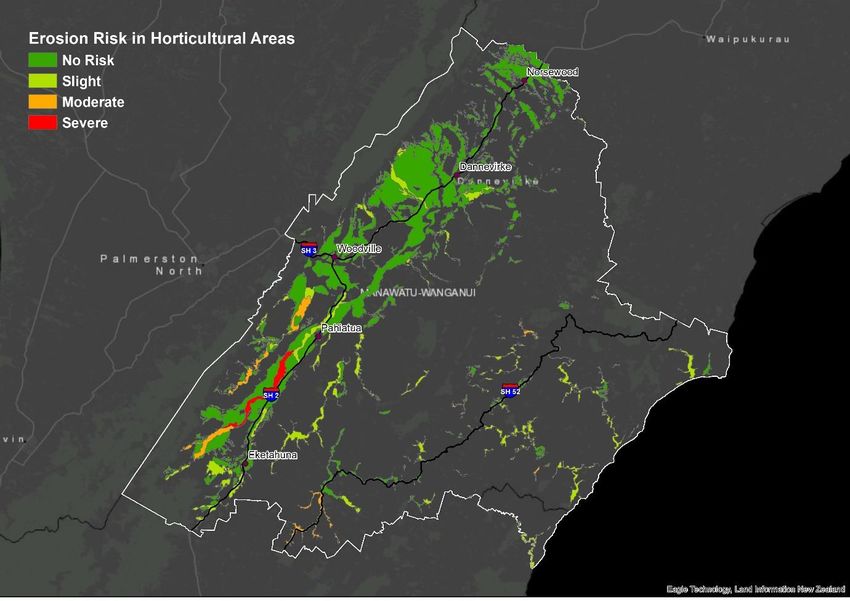
Table 1.3- Cider Apple Summary Table
 Crop                                  Cider Apple
 Temp / GDD                            >800 GDD
 Frost                                 Protect at flowering to 0°C. Fruit damaged below -1.5°C.
 Winter Chill                          1200 to 1500 hours below 7°C
 Flowering time                        October
 Harvest time                          March-May
 Rainfall                              Compare to Nelson 270mm average Sept- Nov rainfall.
                                       Less rain at flower better
 Wind                                  Require shelter-live shelter belts and sheltered
                                       microclimates
 Slope                                 Flat to mild rolling 0 - 10°
 Soil depth                            >70cm ideal. >50cm not suitable
 Soil type                             Moderate to well drained
 Avoid                                 Dense soils with high clay content, standing water
 Nitrogen loss if well managed         Tararua modelled N loss 15 to 17kg/ha
 Fert timing                           Postharvest (March to April) or foliar
 Water requirement                     Irrigate when young. 75 to 90mm for hottest months. 100
                                       to 200mm/year
 Market modelled                       100% NZ process for craft level ciders
 Supply chain end budgeted             Fresh apples freighted to Hawke's Bay, no processing or
                                       storage costs
 Harvest                               Machine harvested
 Labour needs                          Low- Moderate
 Land area required                    10ha to 30+ha
 Gross margin and sensitivity          $14,510 per ha. If 50t/ha and $0.35/kg, $8,210/ha.
 Development Costs                     $35,000/ha in model, plus frost protection and shelter
                                       belts which vary widely in cost could increase to $50,000.
 Breakeven (model)                     8 years. Unlikely to achieve higher yields, prices
                                       constrained by export over-run

                                                                                       9|Page
Feijoa Summary
Feijoas already are grown in the Tararua District for export and local production. They are frost
hardy, have a later flowering than many other fruit crops and tolerate a wide range of climates
throughout New Zealand. Harvest timing is expected to be in April-May, later than warmer
growing districts, which could present a market supply opportunity. They are wind tolerant
but in Tararua’s windy climate shelter will be required, especially if aiming for export markets
where wind rub is an issue.
Feijoas will benefit from flatter land with moderate to well drained soils. More sloped land
restricts trellising and machinery access, but systems can be tailored to work on undulating or
mildly rolling country (0-10°). Feijoas grow on a wide range of soil types, but heavy clays with
standing water present should be avoided. Light, stony sands should also be avoided,
especially if there will be no permanent irrigation system installed. Soils should ideally be 60cm
in depth or greater.
Nitrogen losses are likely to be able to be kept between 10 and 20kg N/ha/year with careful
fertiliser application management. Timing of fertiliser application is in spring.
It is advisable to have a water consent available to provide water when trees are young, and
for very dry years. Overall, feijoas are reasonably drought tolerant.
The local fresh market for feijoa is at capacity currently, and the opportunities for feijoa are
process or export systems. The orchard set up will be targeted to one or the other market.
The orchard model is for process which has a lower gross margin than export, but which can
have a very low capital set up. One of the drawcards for feijoa is also the ease of management.
Land area required for a process feijoa orchard at a minimum is defined by the need for volume
to support a machine harvester. A feijoa orchard in the Tararua will need 30ha to cover costs
of machine harvesting equipment, and in this case can hire a full-time worker on the property.
Main resource limitations include people skilled in growing the fruit, machine harvesting
equipment and postharvest, processing or storage facilities.
10 | P a g eTable 1.4- Feijoa Summary Table
Crop Feijoa
Temp / GDD Wide range of temperate climates.
Frost Frost tolerant. Winter down to -10°C. During season, -
1.5°C.
Frost free period n.d. Frost protection from Oct-May to -1.5°C
Winter Chill 200 hours below 7°C
Flowering time November-December
Harvest time April-May, 4-6 weeks later than warmer districts
Rainfall Moderate, 750 to 1000mm. Low humidity harvest
Wind Require shelter-live shelter belts
Slope Flat to mild rolling 0 - 10°
Soil depth >60cm ideal. >40cm not suitable
Soil type Moderate to well drained
Avoid Dense soils with high clay content, standing water
Nitrogen loss if well managed Likely 10 to 20kg/ha/year
Fert timing Spring, mainly Nov-Dec
Water requirement Irrigate when young. 75 to 90mm for hottest months. 100
to 200mm/year
Market modelled NZ process or fresh export market
Supply chain end budgeted Machine harvested and freighted to Hawke's Bay, no
storage or processing
Harvest Machine modelled. Other options are touch picked or
catch-nets for export
Labour needs Low for process. Otherwise extra workers just for harvest
Land area required 10ha to 30+ha
Gross margin and sensitivity $10,038 per ha. If price is $1.00/kg, $14,032/ha.
Development Costs $22,500/ha in model, plus frost protection, other
machinery and shelter belts
Breakeven (model) 9 years. Unlikely to get price upside unless supplying non-
commodity processor
11 | P a g eHazelnut Summary
Hazelnuts will grow well in Tararua as long as they have adequate shelter, soil moisture and
lower rainfall at harvest. Rain at harvest time in the Tararua as researched in the climate
section of this report, indicated that Eketahuna and Norsewood will be less suitable than the
other main centres analysed.
Soils for hazelnut production should be flat or slightly sloping to accommodate harvest
machinery. They should be 60cm deep or more, with high water holding capacities. Dense
poorly structured soils or standing water should be avoided.
Nitrogen requirements to form protein in the nut are higher than other crops in this study, and
it is estimated that with good nutrient management nitrogen losses should be 15 to 25kg
N/ha/year. Irrigation is not costed in the model but may be required, perhaps instead of tile
drainage depending on soil characteristics.
Tararua hazelnut production will struggle to be price competitive with imports, so will likely
target smaller boutique markets and will need strong branding. Hazelnuts are slower to reach
mature production than other crops, but once they do reach maturity, they will continue
producing for many years with minimal labour requirement.
Land area required is 30 ha based on having enough scale to have a machine harvester. Smaller
land areas of 10 ha are estimated to be viable to have 1 full time labour unit focussed on the
crop.
Resource restrictions include tree availability, skills and advice around growing the crop,
machine harvest equipment, contract drying facilities and processing facilities.
12 | P a g eTable 1.5- Hazelnut Summary Table
Crop Hazelnut
Temp / GDD Mild summers below 30°C and cool winters to -10°C
Frost Very frost tolerant. Flowers tolerate temperatures to -8°C.
Frost free period n.d. Not the most important factor for Hazelnut
Winter Chill 600 to 1200 hours
Flowering time Female flowers open June - September
Harvest time Late Feb to early April
Rainfall 800 to 1000mm, evenly distributed but less over harvest
Wind Require shelter-live shelter belts and sheltered
microclimates
Slope Flat to mild rolling 0 - 10°
Soil depth >60cm ideal. >40cm not suitable
Soil type Fertile loam with high water holding capacity to mitigate
drought
Avoid Soils with poor structure, standing water, low water holding
capacity
Nitrogen loss if well managed Likely 15 to 25kg/ha/year
Fert timing Little and often through growing season
Water requirement Irrigate when young. 75 to 90mm for hottest months. 100
to 200mm/year
Market modelled High quality nuts for fresh local and export market
Supply chain end budgeted Harvested and hung to dry in a barn, no cost added for
storage materials
Harvest Machine harvested
Labour needs Low, 2 permanents for 30ha, one manger one worker. Extras
for pruning.
Land area required 10ha to 30+ha
Gross margin and sensitivity $12,898 per ha. At 3.5 t/ha and $9.50/kg, $19,405/ha
Development Costs $35,000/ha in model, plus other machinery and shelter belts
Breakeven (model) 11 years. Likely to be able to achieve upside on yield and
price
13 | P a g e2.0 INTRODUCTION
The Tararua District Council has commissioned this project to evaluate several alternative
horticultural land uses for farmers of the Tararua District. This project is intended to be an
introduction to these crop options, from which landowners can investigate further those they
have interest in with reference to their land resource, accessible capital, lifestyle values and
passions.
The Productivity Commission completed a report in 2018 recommending the government
incentivise diversification of land use towards horticulture and cropping as part of a strategy
for a low-emissions economy. Meanwhile, the climate is changing, with projections for warmer
average temperatures, less rainfall on the east coast in summer, and more extreme weather
events. The first two may come as opportunities for the Tararua District, while the latter will
be an issue across the country and the globe. NZ also has a strong national drive for improved
water quality which has been set in law by the National Policy Statement for Freshwater
Management (2014). This forces regional councils to set water quality and quantity limits and
enforce these.
Environmental limits may be tough for some animal-based land uses to adhere to. Alternative
land uses can bring benefits such as lower environmental impacts, higher economic
profitability, higher permanent labour requirements and agriculture and horticulture related
tourism. The outcome of all this is several strong drivers for land use change or diversification.
The next barrier is the learning and culture change it will take for farmers to be successful if
they want to make a diversification decision. The Tararua District Council sought to provide
information on a range of potential diversification options in order to facilitate the thought
process with landowners. Initially, many crops were to be studied, and this was narrowed
down to four based on perceived likelihood of success for the farmers and the regional benefits
the industry could provide.
Land uses studied in this report include:
Feijoa
Blueberry
Cider apple
Hazelnut
Feijoas already have examples of being grown successfully in the Tararua District, and the
potential is there for Tararua to become a feijoa industry hub. Blueberries can be grown under
cover, and both feijoa and blueberry can be added flavours to a cider industry. Cider apples
are in demand across the country from boutique brewers, and Tararua cider apples could be
used to make cider within the district and allow Tararua to attract visitors on the Classic NZ
Wine Trail to stay in the region and add cider tasting to their activities. Hazelnuts handle coder
and wetter climates than many other horticultural crops. All are permanent crops which would
14 | P a g ehelp farmers meet their environmental limits, improve local water quality, attract people to
the region and improve the livelihoods of Tararua communities.
The Tararua District is located between the Hawke’s Bay and the Wairarapa regions of the
North Island’s east coast (Figure 1). On the East of the Tararua ranges, the valley in which State
Highway 2 (SH2) is situated features large tracts of flatter land. Another line of hills used
predominantly for sheep and beef farming and forestry runs to the east coast. The rainfall
gradient is generally higher near the large Tararua Ranges and lower towards the east coast.
Small areas of flat land lie around the river valleys of the east coast, but these are too small to
present major opportunities for the district. The higher rainfall, flat land area in the SH2 valley
was in forest for a long time before being cleared and is currently used for dairy. This flatter
area of land is the focus of this report.
Table 2.1- Map of the Tararua District
The high rainfall and wind levels in the Tararua District present horticultural challenges, but
these can be overcome with the right crop and the right mitigations such as shelter belts.
Tararua’s position as a horticultural supplier is close to the transport hub of Palmerston North,
and there is opportunity to supply Wellington and Hawke’s Bay direct too.
Environmental issues are a key concern for the farmers of Tararua, with nitrogen leaching loss
caps and improved environmental management having new focus in New Zealand
communities and governing bodies. The National Policy Statement for Freshwater
15 | P a g eManagement 2014 (NPSFM) requires the Horizons Regional Council to set targets and limits
for water quantity and quality, which they did within the One Plan. This is affecting many
farmers in the Tararua District, who are facing regulatory restrictions on how they can farm.
The government also proposed action on agricultural emissions in 2019, and this will be then
next pressure on farmers to reduce their carbon emissions. Horticultural systems have
potential to lower the impact the land is having on waterways and greenhouse gasses and can
be an attractive option to land users having trouble reaching their environmental objectives.
Horticulture as an industry is booming throughout New Zealand currently, driven by export
apples, kiwifruit and a burgeoning avocado and cherry industry, to name a few. The profit
potential of horticultural land uses is greater than dairy or sheep and beef systems, along with
bringing in more labour units per hectare, as well as support industry and supply chain to the
area. This is important for Tararua District, because the district population has increased
between the 2013 and 2019 censuses. Horticulture also has potential to create a higher level
of tourism, which brings money and jobs to the region.
The question for the district is: Do any of these four land use options have the potential to take
off in areas suitable for horticulture, and can these options help farmers meet environmental
challenges, increase profitability and attract more people and supporting businesses to the
Tararua District over the next 10 to 30 years?
The answer is yes, there is potential for this, but it will not be easy, and it will need passionate
and motivated individuals to take the first steps and set up a commercially successful business
before others will follow suit. It will also need excellent marketing, whether this is to convince
buyer companies to take this first step, or whether it is forming a local vertically integrated
business selling their own Tararua branded products. Our rural people have demonstrated this
ability throughout NZ history, and it can be done again in the Tararua District.
Previous work that feeds into this project includes the Tararua District Council ‘Go Project’, an
in-depth study on land use conducted by the council 10 years ago. The aim of the ‘Go Project’
study was to discover alternative land use options for farms in the region, particularly areas
which are underutilised in terms of growing potential. Thirty-seven highly detailed maps were
produced, showing district-wide annual rainfall, crop options and optimal planting areas for
high-yield, high-return crops which would work for the Tararua District. These included, among
others, hazelnuts, saffron, feijoa, flax and Mānuka.
The current report aims to deepen understanding of potential in the region for four crops of
interest, updating our understanding, or completing a full new study of them.
A climatic analysis of the region was undertaken, and a soils analysis summarised from the data
already collected under the ‘Go Project’. The report then is divided into sections by crop, which
16 | P a g erelate climatic, soil and production requirements back to the weather and soil summary data.
Each crop section also includes information on:
Environmental sustainability
Financials
Markets and trends
Labour needs
3.0 CLIMATE ANALYSIS
In order to assess the feasibility of growing cider apples, blueberries, feijoas, and hazelnuts
across the Tararua District, an analysis of the local climate and weather events was undertaken.
Metrics that directly impact horticultural production were assessed based on 10-year averages
from 2009 to 2018, including:
Maximum, minimum and average daily and monthly air temperature
Growing Degree Days (GDD)
Frost Free Period (FFP)
Annual precipitation
Chilling Units (CU)
In the Tararua District, weather data was collected and analysed for Dannevirke, Eketahuna,
Norsewood, Pahiatua and Woodville. These localities were chosen because they had the
largest areas of flat land that were suitable for horticultural production and they also provided
a wide range of topographical situations. The data from the Tararua District weather stations
was compared to Hastings, a well-established horticultural region.
Most of the weather data was accessed from NIWA’s National Climate Database (CliFlo)1;
however, incomplete datasets were supplemented with NIWA’s Virtual Climate Station
Network (VCSN)2.
3.1 Air Temperature
Maximum, minimum and average air temperatures greatly impact the productivity of
horticultural crops.
Maximum daily temperatures (both absolute and average) directly impact photosynthetic
production. For example, blueberry plants will not undergo photosynthesis if maximum daily
temperatures exceed 30°C and this is important because photosynthesis drives plant growth
and fruit quality. Maximum daily temperature is also a component of Growing Degree Days
(GDD), a heat index used to predict plant growth and development and fruit maturation.
1
https://cliflo.niwa.co.nz
2
https://data.niwa.co.nz/#/home
17 | P a g eMinimum daily temperatures (both absolute and average) can also impact photosynthetic
production. Furthermore, temperatures below 0°C can result in plant and flower senescence,
impacting final fruit yield and quality. Minimum daily temperature is also a component of GDD
and is the basis for determining the length of the growing season.
The Tararua District has a moderate climate like the Hastings in terms of average maximum,
minimum and daily temperature, with slightly lower long term maximums that bring the
average down from 15.9°C in Hastings to a range of 14.4°C to 15.6°C through the Tararua
District (Table 3.1).
The analysis revealed that altitude has a strong impact on several key climate metrics across
the Tararua District. For example, the weather station at Norsewood recorded lower
maximum, minimum and average temperatures (Tables 3.1 and 3.2) and more days with
temperatures less than 0°C (Table 3.3) when compared with other towns in the study, resulting
in fewer GDDs (Table 3.4), and a shorter growing season.
Table 3.1. Average Temperatures during the growing season (1 October - 31 April) at several locations in the
Tararua District over a ten-year period (2009-2018).
Maximum Minimum Daily Average
Weather Station
(°C) (°C) (°C)
Dannevirke 20.2 10.1 15.1
Eketahuna 20.1 9.9 15.0
Norsewood 19.5 9.3 14.4
Pahiatua 20.5 10.5 15.5
Woodville 20.6 10.5 15.6
Hastings 21.5 10.3 15.9
Absolute maximum temperature is lower at all Tararua sites when compared to Hastings (Table
3.2). The average number of days above 30°C is 3 days or less in the Tararua District and this
lower maximum temperature can be an advantage for growing some fruit crops. For example,
at temperatures higher than 35°C, hazelnut trees stop producing carbohydrates which could
result smaller nuts, negatively impacting yield. Climate change in the region is predicted to
increase temperatures by between 0.7°C and 1.1°C by 2040, which brings the average
temperature very close to Hastings for many areas of the Tararua District.
18 | P a g eTable 3.2. Absolute maximum and minimum temperatures, and number of days above 30°C and below 0°C during the
growing season (1 October - 30 April) at several locations in the Tararua District over a ten-year period (2009-2018).
Absolute Absolute
Weather No. Days No. Days
Maximum Minimum
Station Above 30°C Below 0°C
(°C) (°C)
Dannevirke 31.1 3 -1.5 6
Eketahuna 30.6 2 -1.3 12
Norsewood 30.4 2 -2.0 10
Pahiatua 31.1 3 -1.0 8
Woodville 31.5 3 -1.2 9
Hastings 36.4 55 -1.2 11
The first autumn frosts typically occur around the 1st of May for most of the Tararua District,
except for Norsewood, which can have frosts as early as mid-April. Woodville’s first frosts can
be a little later due to the proximity to the Manawatu Gorge. Westerly winds coming through
the gorge keep the air at the surface well mixed with relatively warmer air from higher in the
atmosphere, resulting in fewer frosts.
Areas of the Tararua District that are higher in elevation also have the greatest number of late
frosts. For example, both Norsewood and Eketahuna have more incidences of frost in October
and November than the other towns in this analysis (Table 3). This is important because late
spring frosts are more likely to have detrimental effects on horticultural production (e.g. bud
damage, flower senescence, and fruit damage).
In general, frosts colder than -3°C are hard to manage with conventional frost fans unless a
heat source is used alongside the frost fan. In Central Otago, where frosts are regularly below
-3°C, overhead sprinklers are used.
Higher frost incidence and absolute minimum temperatures colder than -3°C in the cooler
areas of the district will narrow land use options and require a higher level of frost protection.
Table 3.3. Total incidence of temperatures below 0°C and absolute minimum temperature during flowering at several
locations in the Tararua District over a ten-year period (2009-2018).
Sep Oct Nov
Weather Min.
(No. days (No. days Min. Temp. (No. days Min. Temp.
Station Temp.
< 0°C) < 0°C) (°C) < 0°C) (°C)
(°C)
Dannevirke 12 -2.2 7 -1.5 2 -1.1
Eketahuna 18 -3.0 10 -1.3 4 -0.7
Norsewood 21 -2.1 10 -2.0 4 -1.7
Pahiatua 10 -2.6 6 -1.0 3 -0.4
Woodville 10 -2.6 6 -1.2 4 -0.7
Hastings 15 -2.3 4 -1.2 2 -0.4
19 | P a g e3.2 Growing Degree Days (GDD)
Growing Degree Days, a heat index, is a means of characterising climate for predicting the crop
suitability of a region. Growing Degree Days can also be used to predict when a crop will reach
maturity. For most of the lowland areas in the district, the GDD values are between 1000 and
1100 (Table 3.4). In the northern part of the district, between Norsewood and Dannevirke, the
values are around 900. The climate stations with the highest GDD are Pahiatua and Woodville,
with approximately 1200 GDD.
Table 3.4 shows maximum, minimum and the upper and lower quartile GDDs over the growing
season for the 10-year period from 2009-2018. Dividing the data into quartiles is a useful way
to quantify the year to year variability. The GDD ranges across the district are enough to
support all the proposed land use options (Table 3.4).
It should be noted that areas with lower GDDs will take longer to bring a crop to full maturity
when compared to an area with higher GDDs. Essentially, areas with lower GDD will have less
time to size and mature the fruit on the tree.
Table 3.4. Average, Minimum, Lower Quartile, Median, Upper Quartile, and Maximum GDD (base 10°C) during the growing
season (1 Oct - 30 Apr) at several locations in the Tararua District over a ten-year period (2009-2018).
Weather Lower Upper
Average Minimum Median Maximum
Station Quartile Quartile
Dannevirke 1116 944 1037 1155 1198 1254
Eketahuna 1085 922 1026 1081 1166 1243
Norsewood 975 809 901 1018 1050 1112
Pahiatua 1190 1031 1129 1194 1268 1340
Woodville 1207 1035 1140 1219 1282 1379
Hastings 1259 1076 1157 1254 1340 1466
3.3 Frost Free Period (FFP)
The length of the growing season is typically determined by the number of consecutive days
without frost; this is the time between the last spring frost and the first frost in the autumn.
For this report, the frost-free periods are given for the number of consecutive days with a
minimum air temperature above both 0°C and -1°C.
Frosts are more prevalent in the areas of higher elevation (i.e. Norsewood and Eketahuna)
where the air temperature is cooler (Tables 3.1, 3.2, 3.3). In general, the length of growing
season is acceptable across the district for all the land use options. However, Norsewood has
the lowest FFP and it will be necessary for growers in these areas to choose crops or varieties
that better tolerate low temperatures.
20 | P a g eTable 3.5. Average growing degree days (GDD), rainfall, evapotranspiration (ET) during the growing season (1 Oct - 30 Apr),
and annual Chill Units and Frost-free Period (FFP) at several locations in the Tararua District over a ten-year period (2009-
2018).
FFP0* FFP1**
Weather Rainfall ET GDD Chill Units
(No. Days (No. Days
Station (mm) (mm) (base 10°C) (Hours)
>0°C) >1°C)
Dannevirke 532 758 1107 2360 231 261
Eketahuna 782 728 1075 NA 220 253
Norsewood 756 744 970 2683 135 244
Pahiatua 642 751 1180 2182 229 270
Woodville 620 757 1197 1744 227 271
Hastings 336 765 1253 1571 222 264
* Consecutive frost-free days above 0°C
** Consecutive frost-free days above -1°C
3.4 Chilling Units (CU)
Winter chilling is the period of cold weather that many crops require during their winter rest
period, prior to commencing new growth in spring. Typically, the most effective chilling
temperatures are between about 3°C and 7°C. Conditions colder than freezing do not assist
chilling, and at temperatures above 15°C, the chilling process is reversed.
Typically, chill unit calculations are made from air temperatures recorded at least once an hour,
although reasonably reliable chill estimates can be made from daily maximum and minimum
temperatures.
There are various methods to calculate chill units, however, a count of the number of hours
between 0°C and 7°C is most common in New Zealand.
Chill unit accumulation increases with elevation across the district. Horticultural crops have
different chilling requirements; therefore, growers must choose an appropriate crop-variety
combination to ensure chill requirements are met. For example, blueberry shrubs have
different chilling requirements depending on cultivar. High bush blueberries require at least
800 hours of chilling, however, rabbiteye blueberries require less than 600 hours of chilling. All
the sites assessed across the district meet the chilling requirement for the evaluated land use
options.
3.5 Annual Precipitation
The quantity of water a horticultural crop requires varies with soil type, the age of the plant,
the amount of fruit produced, the presence of competitive weeds, and humidity. Low
precipitation can result in water stress, leading to reduced carbohydrate production, poor fruit
set, low fruit quality, and diminished yields. Excessive precipitation can increase plant vigour,
which in turn can increase incidence of plant diseases and reduce fruit quality.
21 | P a g eThe annual rainfall is relatively high over the district, so lack of water is less of a risk in this
climate than excessive water. Supplemental irrigation will still be needed at key phenological
stages and over the summer to combat drought periods (Table 3.5).
Rainfall timing is a limiting factor for some of the land use options. Precipitation at flowering
can inhibit flowering and pollination, ultimately leading to lower yields. Precipitation at harvest
can increase incidence of fruit splitting, rots and diseases. Furthermore, rain at harvest can
create situations where mechanical harvesters slip or slide on wet surfaces, causing harvesters
to damage trees or trellising. Rainfall over flowering and harvest are higher in areas of higher
elevation (i.e. Norsewood and Eketahuna) (Table 3.6).
Table 3.6. Average rainfall (mm) at flowering and harvest at several locations in the Tararua District over a ten-
year period (2009-2018).
Rain at flowering Rain at harvest
Weather Station
(Sept - Nov) (Mar - May)
Dannevirke 275 171
Eketahuna 418 242
Norsewood 410 254
Pahiatua 344 187
Woodville 329 179
Hastings 135 138
Nelson* 270 330
*A comparison is added here with Nelson data, because Nelson is a key horticultural growing area for apples, where rainfall is
much higher than Hastings.
Table 3.7 below shows maximum, minimum and the upper and lower quartile rainfall over the
growing season for the 10-year period from 2009-2018. This table reveals that rainfall in the
Tararua district is relatively stable from year to year and that the mean rainfall figure is not
hiding 5 years of drought and 5 years of excessive rainfall.
Table 3.7. Average, Minimum, Lower Quartile, Median, Upper Quartile, and Maximum rainfall (mm) during the growing season
(1 Oct - 30 Apr) at several locations in the Tararua District over a ten-year period (2009-2018).
Weather Lower Upper
Average Minimum Median Maximum
Station Quartile Quartile
Dannevirke 532 368 428 506 633 787
Eketahuna 782 585 685 737 884 1035
Norsewood 756 548 603 754 857 1139
Pahiatua 642 478 558 602 732 835
Woodville 620 440 547 555 727 843
Hastings 336 226 265 329 373 528
22 | P a g e4.0 SOILS AND LAND USE CAPABILITY
4.1 Introduction
This section provides maps and data illustrating the topography and soil properties of the
Tararua District. Specifically, the single factor maps in this section will focus on the areas of the
district that are suitable for intensive horticulture.
Landscape topography, climate and soil properties all show obvious spatial variability across
the Tararua District. Visualizing these differences through maps will help determine
appropriate potential land uses for different areas within the Tararua District.
This section provides interpretation of the data, including maps, in terms of land suitability for
blueberries, cider apples, feijoas and hazelnuts.
Land Suitability
The Land Use Capability3 (LUC) system has been used since the early 1950s to help achieve
sustainable land development and management. The LUC system has two key components:
Land Resource Inventory (LRI) – Assessment of physical land features
LUC Classification – Using the LRI, land is categorised into 8 classes according to long-term
capability to sustain one or more productive uses.
For this project, horticultural land suitability was determined by using LUC less than 4 (Figure
4.1), and a slope classification less than 3 (Figure 4.2).
Land Use Capabilities are described as:
LUC Class code Description
Land with virtually no limitations for arable use and suitable for cultivated crops, pasture or
1
forestry
2 Land with slight limitations for arable use and suitable for cultivated crops, pasture or forestry
Land with moderate limitations for arable use, but suitable for cultivated crops, pasture or
3
forestry
Land with moderate limitations for arable use, but suitable for occasional cropping, pasture
4
or forestry
High producing land unsuitable for arable use, but only slight limitations for pastoral or
5
forestry use
Non-arable land with moderate limitations for use under perennial vegetation such as pasture
6
or forest
Non-arable land with severe limitations to use under perennial vegetation such as pasture or
7
forest
Land with very severe to extreme limitations or hazards that make it unsuitable for cropping,
8
pasture or forestry
3
https://www.landcareresearch.co.nz/__data/assets/pdf_file/0017/50048/luc_handbook.pdf
23 | P a g eThe Tararua District has a wide range of LUCs (Table 4.1). Approximately 54,163 hectares,
nearly 20% of the land area of the Tararua District, is suitable for the proposed land use options
(Table 4.1) according to the simple LUC and slope rules implemented.
Figure 4.1. Tararua District Land Use Capabilities (LUC). Data from: https://lris.scinfo.org.nz.
Table 4.1. LUC designations for the Tararua District.
LUC Area (ha) Percent of Total
1 549 0.1%
2 31,368 7.2%
3 46,348 10.6%
4 22,246 5.1%
5 1,375 0.3%
6 211,106 48.4%
7 105,481 24.2%
8 16,859 3.9%
Town 889 0.2%
Grand Total 436,221 100%
24 | P a g eSlope Classes are described as:
Item code Class description Class range
A Flat to gently undulating 0–3°
B Undulating 4–7°
C Rolling 8–15°
D Strongly rolling 16–20°
E Moderately steep 21–25°
F Steep 26–35°
>35°
G Very steep
(36–42°)
H Precipitous (>42°)
Figure 4.2. Tararua District Slope Classification. Data derived from a 25-meter DEM from: https://lris.scinfo.org.nz.
25 | P a g eLUCs are further broken down into subclasses. The LUC subclass is a subcategory of the LUC
Class that defines the main physical limitation or hazard that might limit land use.
The four limitations are:
LUC subclass
Description
modifier
e Erosion – where susceptibility to erosion is the dominant limitation
Soil Wetness – where high water table, slow internal drainage, and/or flooding is
w
the dominant limitation
Soil Physical – where the dominant limitation is in the rooting zone (e.g. shallow
s
soil, low water holding capacity, stoniness, low fertility, salinity or toxicity)
Climate – where climate is the dominant limitation (e.g. summer drought,
c
excessive rainfall, unseasonal/frequent frost, and strong winds).
The land suitable for intensive horticulture in the Tararua District has all four limitations (Figure
4.3). Soil Physical and Soil Wetness make up approximately 82% of the total limitations, while
erosion and climate contribute the remaining 18% (Table 4.2). Note that soil physical
limitations can class soil as unsuitable for horticulture when you can get around these
limitations and be successful, for example planting blueberries in pots above the shallow soil,
or soils like the Hastings Gimblett Gravels which are world class soils for grape vines.
Figure 4.3 Limitations of land designated for intensive horticulture. Data from: https://lris.scinfo.org.nz.
26 | P a g eYou can also read