Relative errors in derived multi-wavelength intensive aerosol optical properties using cavity attenuated phase shift single-scattering albedo ...
←
→
Page content transcription
If your browser does not render page correctly, please read the page content below
Atmos. Meas. Tech., 15, 3279–3296, 2022
https://doi.org/10.5194/amt-15-3279-2022
© Author(s) 2022. This work is distributed under
the Creative Commons Attribution 4.0 License.

Relative errors in derived multi-wavelength intensive aerosol optical
properties using cavity attenuated phase shift single-scattering
albedo monitors, a nephelometer, and tricolour
absorption photometer measurements
Patrick Weber1 , Andreas Petzold1 , Oliver F. Bischof1,2 , Benedikt Fischer1 , Marcel Berg1 , Andrew Freedman3 ,
Timothy B. Onasch3 , and Ulrich Bundke1
1 Institute
          of Energy and Climate Research 8 – Troposphere (IEK-8), Forschungszentrum Jülich GmbH, Jülich, Germany
2 Particle
         Instruments, TSI GmbH, Aachen, Germany
3 Aerodyne Research Inc., Billerica, MA 01821, USA

Correspondence: Ulrich Bundke (u.bundke@fz-juelich.de)

Received: 17 September 2021 – Discussion started: 27 September 2021
Revised: 3 February 2022 – Accepted: 17 March 2022 – Published: 2 June 2022

Abstract. Aerosol intensive optical properties, including           One key finding is that the coefficients of light absorption,
Ångström exponents for aerosol light extinction (EAEs),          scattering and extinction derived from combing the mea-
scattering (SAEs) and absorption (AAEs) as well as and           surements of two independent instruments agree with mea-
the single-scattering albedo (SSA), are indicators for aerosol   surements from single instruments; the slopes of regression
size, chemical composition, radiative behaviour and particle     lines are equal within reported uncertainties (i.e. closure is
sources. Derivation of these parameters requires the mea-        observed). Despite closure for measured absorption coeffi-
surement of aerosol optical properties at multiple wave-         cients, we caution that the estimated uncertainties for ab-
lengths, which usually involves the use of several instru-       sorption coefficients, propagated for the differential method
ments. Our study aims to quantify the uncertainties in the       (DM; absorption = extinction minus scattering), can exceed
determination of these intensive properties using an optical     100 % for atmospherically relevant SSA values (> 0.9). This
closure approach. In our laboratory closure study, we mea-       increasing estimated uncertainty with increasing SSA yields
sured the full set of optical properties for a range of light-   AAE values that may be too uncertain for measurements
absorbing particles with different properties externally mixed   in the range of atmospheric aerosol loadings. We recom-
with ammonium sulfate to generate aerosols with controlled       mend using the DM for measuring AAE values when the
SSA values. The investigated absorbing particle types were       SSA < 0.9. EAE- and SAE-derived values achieved closure
fresh combustion soot emitted by an inverted flame soot gen-     during this study within stated uncertainties for extinction
erator (SOOT; fractal agglomerates), Aquadag (AQ; compact        coefficients greater than 15 Mm−1 . SSA values for 450 and
aggregates), Cabot black (BC; compact agglomerates) and          630 nm wavelengths internally agreed with each other within
an acrylic paint (magic black, shape unknown). The instru-       10 % uncertainty for all instrument combinations and sam-
ments used in this study were two cavity attenuated phase        pled aerosol types, which fulfils the defined goals for mea-
shift particle monitors for single-scattering albedo (CAPS       surement uncertainty of 10 % proposed by Laj et al. (2020)
PMSSA ’s; λ = 450, 630 nm) for measuring light-extinction        for GCOS (Global Climate Observing System) applications.
and light-scattering coefficients, one integrating nephelome-
ter (λ = 450, 550, 700 nm) for light-scattering coefficients,
and one tricolour absorption photometer (TAP; λ = 467, 528,
652 nm) for filter-based light-absorption coefficients.

Published by Copernicus Publications on behalf of the European Geosciences Union.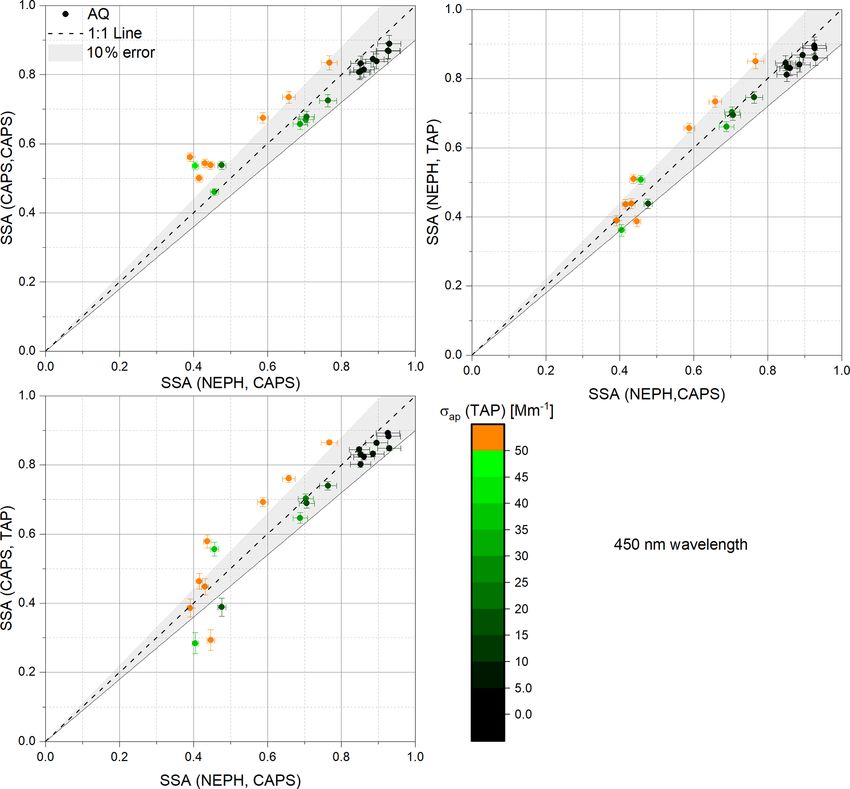
3280                                                   P. Weber et al.: Relative errors in intensive aerosol optical properties

1   Introduction                                                      Intensive aerosol parameters like the single-scattering
                                                                   albedo (SSA) or Ångström exponents are often not directly
The precise determination of aerosol optical properties is         measured but calculated from multiple instrument datasets,
crucial for the provision of reliable input data for chem-         which could lead to an increase in errors and uncertain-
istry transport models, climate models and radiative forcing       ties. The importance of measuring reliable intensive param-
calculations (Myhre et al., 2013). This applies, in particu-       eters is undisputable, especially when their use is required
lar, to light-absorbing particles like black carbon (Petzold et    for an experiment or sensitive climate-related modelling.
al., 2013), which are produced by incomplete combustion            The Ångström exponents are widely used to adjust exten-
processes and absorb visible light very efficiently. Aerosol       sive parameters to a desired wavelength (Ångström, 1929)
light-absorbing properties are also relevant for source ap-        for instrument comparisons (Foster et al., 2019), for aerosol
pointment studies and the determination of anthropogenic in-       characterization (Russell et al., 2010) like the refraction in-
fluences on atmospheric aerosols (Sandradewi et al., 2008).        dex determination of mineral dust (Petzold et al., 2009) or
There are two common methods to generate aerosol light-            black carbon (Kim et al., 2015), or for source identifica-
absorption values for long-term and short-term monitoring,         tion of mineral dust (Formenti et al., 2011). Ångström ex-
each with its own disadvantages. One method is a filter-based      ponents vary with particle size, shape and chemical compo-
technique, which operates by deriving light-absorbing val-         sition, though the relative importance of these factors dif-
ues from the attenuation of light through particle-loaded fil-     fers for each optical property. The scattering Ångström ex-
ters (Rosen et al., 1978). A disadvantage of all filter-based      ponent (SAE) is most sensitive to particle size and, there-
methods is linked to artefacts like multiple scattering in-        fore, used as an indication of the size distribution of mea-
side the filter matrix, shadowing of light-absorbing parti-        sured aerosols. An SAE value of 4 indicates either gaseous
cles in highly loaded filters and humidity effects on the fil-     Rayleigh scattering or nanometre-sized particles, whereas a
ter substrate (Moosmüller et al., 2009). Widely deployed           value of 0 indicates coarse particles (Kokhanovsky, 2008).
filter-based light-absorption instruments include the parti-       The absorption Ångström exponents (AAEs) are sensitive to
cle soot absorption photometer (PSAP; Bond et al., 1999),          the chemical composition and size of the aerosol particles. A
the tricolour absorption photometer (TAP), the continuous          value of 1 indicates an aerosol which absorbs light strongly
light-absorption photometer (CLAP; Ogren et al., 2017), the        across the entire visible spectral range and is composed of
aethalometer (Hansen et al., 1984) and the multi-angle ab-         nanometre-sized spherules (Berry and Percival, 1986). This
sorption photometer (MAAP) (Petzold et al., 2005). The             behaviour is characteristic for fresh soot or black carbon frac-
PSAP, TAP, CLAP and aethalometer share their measure-              tal agglomerates (Kirchstetter and Thatcher, 2012; Xu et al.,
ment principle, utilize a reference spot technique and re-         2015). AAE values higher than unity indicate the presence
quire complex correction algorithms (Collaud Coen et al.,          of brown carbon (Kim et al., 2015) or mineral dust (For-
2010; Virkkula, 2010; Virkkula et al., 2005). The MAAP             menti et al., 2011), both of which are characterized by a
utilizes a different approach, a two-stream radiative trans-       stronger absorption in the blue and ultraviolet compared to
port model, made possible by its measurement of both direct        the red spectral range. AAE values > 1 may also occur for
transmission and backscatter from the particle-loaded filter       coated light-absorbing particles (e.g. coated soot) or larger,
substrate. Another method for deriving aerosol light absorp-       more compact light-absorbing particles (Lack and Cappa,
tion is the differential method, based on the subtraction of       2010). The extinction Ångström exponent (EAE) is often
light scattering from extinction. This method is commonly          used for aerosol classification by remote sensing methods
conducted by comparing measurements from two separate              such as lidar and depends on particle size and chemical com-
instruments, which results in large precision errors particu-      position (Veselovskii et al., 2016; Kaskaoutis et al., 2007).
larly for low light-absorption and/or high single-scattering       Combining these Ångström exponents in cluster plots is a
albedo (SSA) values. In laboratory studies, however, the dif-      reliable method for classifying aerosol sources (Russell et
ferential method is widely used as a reference technique be-       al., 2010). The SSA of an aerosol is the key parameter for
cause the applied light-scattering and light-extinction instru-    its direct and semi-direct impact on climate (Penner, 2001).
ments make measurements on freely floating particles (i.e.         The SSA describes the ratio of scattering to total extinction
no filter-based artefacts) and are well characterized (Bond        of a measured aerosol. An SSA value of 1 indicates that
et al., 1999; Schnaiter et al., 2005; Sheridan et al., 2005).      light extinction occurs exclusively due to light scattering.
A significant improvement of aerosol measurement capac-            In contrast, SSA values > 1 indicate an aerosol with a sig-
ities is achieved by the recently developed cavity attenu-         nificant fraction of light-absorbing components, which may
ated phase shift particle monitor for single-scattering albedo     cause heating of the atmosphere. The intensive parameters
(CAPS PMSSA ) (Onasch et al., 2015), which is able to mea-         are commonly available only through multiple-instrument
sure light extinction and scattering simultaneously and is the     approaches at different wavelengths, which calls for a de-
focus of recent studies (Perim de Faria et al., 2021; Modini       tailed analysis of their measurement uncertainties. Our study
et al., 2021).                                                     contributes to this topic with a detailed optical closure study,
                                                                   in which we deploy standard and advanced instrumentation

Atmos. Meas. Tech., 15, 3279–3296, 2022                                             https://doi.org/10.5194/amt-15-3279-2022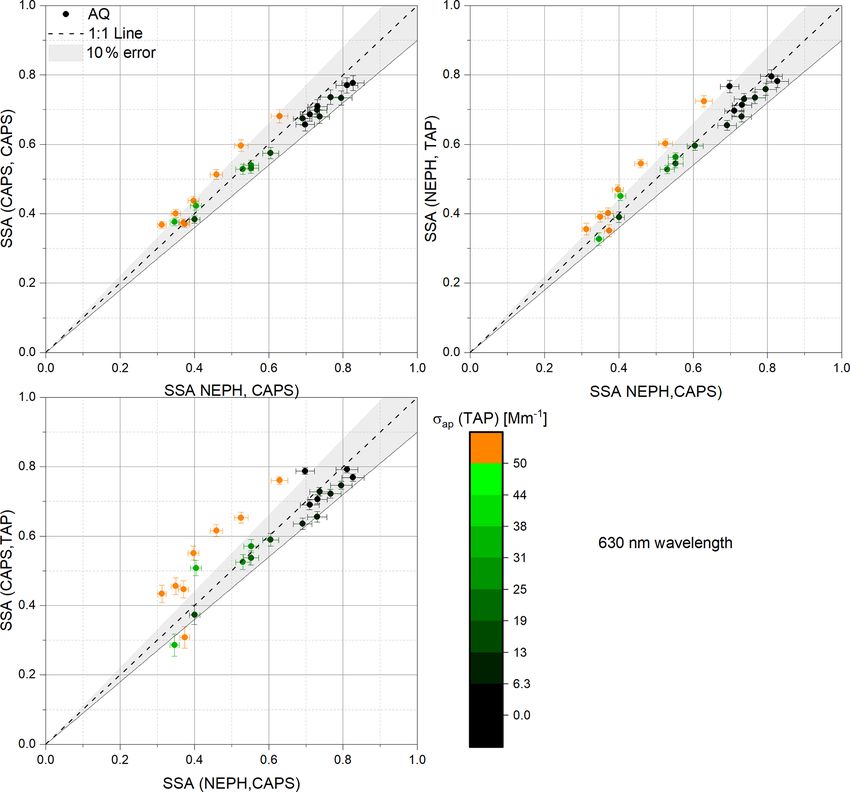
P. Weber et al.: Relative errors in intensive aerosol optical properties                                                    3281

for measuring aerosol optical properties and sample mix-           (TAP; Brechtel Inc., Hayward, CA, USA), which is based on
tures of light-absorbing and light-scattering aerosol to assess    the well-known particle soot absorption photometer (PSAP;
method uncertainties and precision errors.                         ARM Research) and the continuous light-absorption pho-
                                                                   tometer (CLAP) developed by the NOAA (Ogren et al.,
                                                                   2017). The particle light-extinction coefficient, σep , was di-
2     Experimental approach                                        rectly measured with the phase shift channel of the CAPS
                                                                   PMSSA .
2.1    Experimental design
                                                                      The light-extinction channel of the CAPS instrument has
A schematic of the experimental set-up is shown in Fig. 1.         an uncertainty of 5 % and a precision of 2 % and a scattering
Briefly, aerosol flows, generated using two nebulizers or an       uncertainty of 8 % and 2 % precision, respectively (Onasch et
inverted flame generator, are dehumidified (generally to be-       al., 2015). The TAP has an uncertainty of around 8 %, with
low 7 %) using diffusion driers filled with silica gel and sent    a precision of 4 % (Müller et al., 2014; Ogren et al., 2017),
to a mixing chamber to ensure homogeneous mixing prior             while the NEPH has an uncertainty of less than 10 % and a
to being sampled using a suite of optical instruments. In or-      precision of about 3 % (Anderson and Ogren, 1998; Massoli
der to avoid particle losses caused by electrostatic forces, all   et al., 2009). These literature-derived uncertainty estimates
tubing and chambers are constructed of either stainless steel      for measurement accuracy will be used in this study for in-
or conductive silicone tubing. The individual optical instru-      strument closure, either directly or via error propagation. In-
ments are connected using an iso-axial-orientated and isoki-       dividual point averages will be shown with corresponding
netically operated nozzle located in the centreline of the sup-    precision variances.
ply line. As shown in Fig. 1, aerosol production was con-
                                                                   2.3   Aerosol generation
trolled by multiple mass flow controllers (MFCs; Bronkhorst
High-Tech B.V., Ruurlo, Netherlands). A LabVIEW-based              Table 1 provides a complete list of all aerosol types used
program controlled the complete measurement system and             in the study. Solutions of known concentrations of Aquadag
centrally recorded all data from the individual instruments.       (AQ; aqueous deflocculated Acheson graphite; Acheson In-
Pressures in the aerosol delivery lines were maintained at that    dustries, Inc., Port Huron, MI, USA), Cabot black (BC)
of the ambient atmosphere at all times. Aerosol flow rates         and magic black (MB; an acrylic based paint) were pre-
to the individual instruments were provided at their speci-        pared on a daily basis by ultra-sonication before nebuliza-
fied levels (0.6–3.0 L min−1 ) except for that of the TSI neph-    tion in a constant output atomizer (Model 3076, TSI Inc.).
elometer. Given the limitations of the aerosol supply sys-         The count median diameter (CMD) and geometric stan-
tem, the flow to the nephelometer was reduced from 20 to           dard deviation (GSD) of the ammonium sulfate nebulized
2.2 L min−1 , causing the physical response time of that in-       by the constant output atomizer depends on the concentra-
strument to be increased to 10 min. Complete details of the        tion of the salt solution and the flow through the atomizer.
generation of aerosols are provided in the following section.      Use of constant flow rates and particle concentrations pro-
   The generated aerosol size distributions were character-        duced constant size distributions (Liu and Pui, 1975). The
ized and monitored with either a scanning mobility particle        inverted flame soot generator (Argonaut Scientific Corpo-
sizer (SMPS) composed of the combination of a differen-            ration, Edmonton, AB, Canada) was operated with a pre-
tial mobility analyser (DMA 5.400, Grimm Aerosol Tech-             determined oxidation-air-to-propane ratio of 7.5 L min−1 air
nik GmbH Co & KG Germany) and condensation particle                to 0.0625 L min−1 propane so that the flame produced a
counter (CPC 5.411, Grimm Aerosol Technik) system in a             stable and low-organic-carbon soot. It has previously been
sequential mode of operation or a Grimm optical particle           shown that at least 30 min was necessary for the Argonaut
size spectrometer (SKY-OPC, model 1.129, Grimm Aerosol             flame to reach stable aerosol concentrations (Bischof et al.,
GmbH & Co. KG, Ainring, Germany).                                  2019; Kazemimanesh et al., 2018).
                                                                      Initially, pure aerosol types were generated independently
2.2    Optical instruments and uncertainties
                                                                   and measured to quantify their size distributions and opti-
The suite of optical instruments used in this study included       cal properties. The main part of the study was focused on
the following instruments. The particle-scattering coefficient,    making external mixtures of ammonium sulfate and each of
σsp , was measured with an integrating multi-wavelength            the absorbing particle types, separately. These mixtures were
nephelometer (NEPH; Model 3563, TSI Inc., Shoreview,               controlled to provide a stable aerosol with varying intensive
MN, USA; (Bodhaine et al., 1991) and with the scattering           optical properties.
channel of the CAPS PMSSA (CAPS PMSSA , Aerodyne Re-
search Inc., Billerica, MA, USA; Onasch et al. (2015), which
is derived from a measurement of the total extinction and
single-scattering albedo. For the particle light-absorption co-
efficient, σap , we used the tricolour absorption photometer

https://doi.org/10.5194/amt-15-3279-2022                                            Atmos. Meas. Tech., 15, 3279–3296, 2022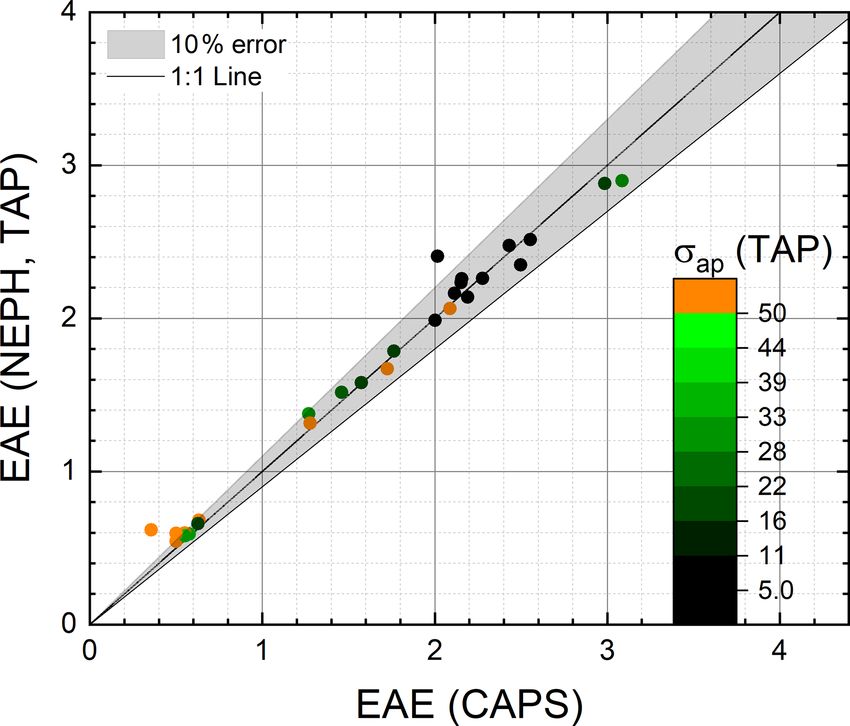
3282                                                   P. Weber et al.: Relative errors in intensive aerosol optical properties

Figure 1. Experimental set-up for the measurements. Flame soot measurements were done with a combustion flame source replacing nebu-
lizer no. 2.

2.4     Data treatment                                              2.4.2   Aerosol optical properties derived from primary
                                                                            measurements
2.4.1    Instrument corrections and calibrations
                                                                    The extensive parameters for aerosol light interactions are
The CAPS PMSSA instrument extinction channel was cali-              extinction, scattering and absorption. When two of them are
brated using polystyrene latex bead (PSL) particles as a ref-       known, the missing one can be calculated with the help of
erence standard and Mie theory using a BHMIE Python code            this equation:
derived from Bohren and Hoffman (1983). Additionally, the
450 nm wavelength CAPS PMSSA calibration was validated              σep = σsp + σap ,                                            (1)
using measurements of CO2 Rayleigh scattering. The scatter-         where σep is the extinction coefficient, σsp the light-scattering
ing channel of the CAPS PMSSA was internally adjusted to            coefficient and σap the coefficient for light absorption by
the extinction channel using ammonium sulfate as a light-           particles. The unit of all these parameters is inverse mega-
scattering aerosol, assuming a single-scattering albedo of          metres (Mm−1 ; 1 Mm−1 = 10−6 m−1 ). When solving Eq. 1
1.0. A truncation error correction was not necessary regard-        for σap , it is possible to derive the absorption coefficient
ing the size of the aerosols used (Onasch et al., 2015a) since      by combining CAPS PMSSA extinction measurements with
all the aerosols used had a median diameter smaller than            either CAPS PMSSA or NEPH scattering measurements
200 nm. The CAPS PMSSA , which is subject to baseline drift         (σap (CAPS, CAPS) or σap (CAPS, NEPH)) for comparison.
as the system heats up, stabilized after 30 min of operation        In the following, this is called the differential method (DM).
(Faria et al., 2019).                                                  To calculate the single-scattering albedo (SSA), the parti-
   The NEPH was calibrated using CO2 (Modini et al., 2021;          cle light scattering must be divided by the particle light ex-
Anderson and Ogren, 1998). Truncation corrections were              tinction:
made using the approaches developed by Anderson and                        σsp
Ogren (1998) for purely scattering aerosols and by Massoli          (λ) =       .                                                 (2)
                                                                           σep
et al. (2009) for aerosol mixtures containing light-absorbing
particles. The truncation corrections applied were always           The Ångström exponents (AEs) are calculated from
equal to or less than 5 %. Because of the reduced airflow, the
                                                                                  σxp (λ1)

                                                                            log σxp   (λ2)
NEPH needed at least 15 min to reach a stable plateau after
                                                                    xAE = −                  .                                   (3)
changing aerosol generation settings.                                        log (λ1/λ2)
   A new filter spot for the TAP was selected for each mea-         By solving Eq. (3) for σp (λ1) and assuming a valid
surement in order to minimize measurement uncertainties             Ångström exponent the resulting Eq. (3a) is used for wave-
due to particle-loaded filters. The first correction regarding      length adjustments
truncation is done by the included software. The software                                  −AE
has the capability to choose the Ogren correction scheme                                   λ1
                                                                    σxp (λ1) = σxp (λ2) ·         .
based on the filter type used (quartz fibre, BT-TAP-FIL100,                                λ2
ENVILYSE). Further corrections were made according to
                                                                    For the particle coefficient σxp , the corresponding σsp , σep ,
Virkkula (2010).
                                                                    or σap could be put into calculations (Eq. 3) to obtain the
                                                                    absorption Ångström exponent (AAE), extinction Ångström
                                                                    exponent (EAE) and scattering Ångström exponent (SAE),
                                                                    accordingly.

Atmos. Meas. Tech., 15, 3279–3296, 2022                                                 https://doi.org/10.5194/amt-15-3279-2022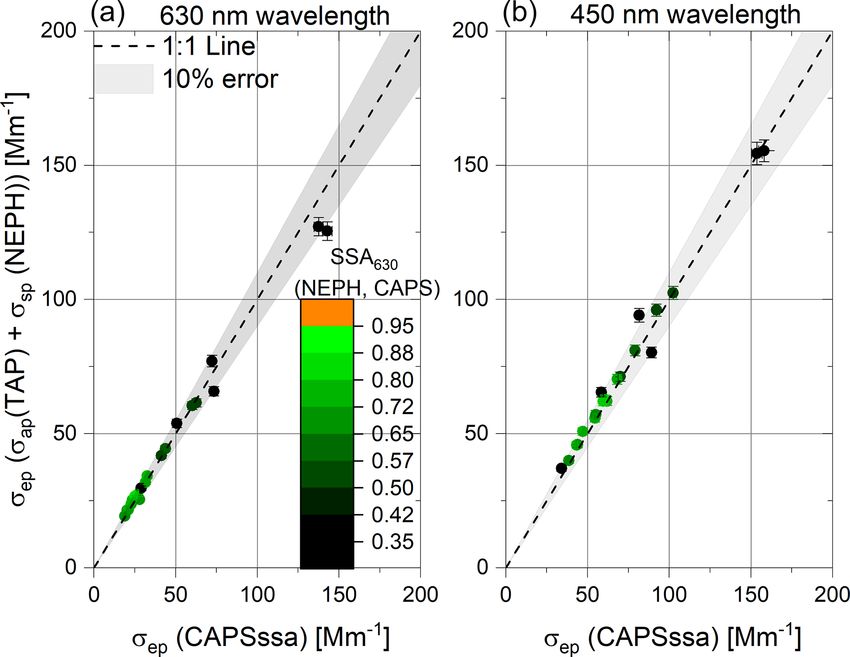
P. Weber et al.: Relative errors in intensive aerosol optical properties                                                              3283

Table 1. Overview of aerosol types used.

                        Substance                         Aerosol type             Abbreviation    Shape
                        Ammonium sulfate                  Salt                     AS              Spheroidal
                        Aquadag                           Colloidal graphite       AQ              Compact aggregates
                        Cabot black (Regal 400R)          Powder                   BC              Compact agglomerates
                        Flame soot                        Combustion aerosol       Soot            Fractal agglomerates
                        Magic black (acrylic paint)       Organic pigments         MB              Unknown

Table 2. List of applied correction algorithms to optical instruments.

                        Instrument       Manufacturer        Properties            λ (nm)                       Reference
                        CAPS PMSSA       Aerodyne               σep ; σsp        450; 630             Onasch et al. (2015)
                                         Research Inc.
                        NEPH             TSI Inc.                    σsp    450; 550;700     Anderson and Ogren (1998),
                                                                                                    Massoli et al. (2009)
                        TAP              Brechtel Inc.               σap    467; 530; 660           Virkkula (2010, 2005)

2.4.3   Error propagation                                                    state to be reached, including waiting ∼ 15 min due to the
                                                                             slow time response of the low-flow NEPH. At steady-state
Error propagation is determined by Gaussian error propaga-                   conditions, we measured size and optical properties fluctuat-
tion:                                                                        ing < 2 % over time with the OPC, CAPS PMSSA and NEPH.
              σsp yields                                                   All instruments recorded data at a 1 s rate. Reported data
SSA λσsp σep =        −→ 1SSA λσsp σep
                 σep                                                         points are given as averages of 100 s of stable-aerosol pro-
                 v
                 u                            !2                            duction. This value was chosen to obtain a minimum in data
                                2
                 u 1                  σsp                                    precision and detection limits as determined from Allan stan-
               = t        · 1σsp +     2
                                          1σep         (3)                   dard deviation plots by Massoli et al. (2010) for the CAPS
                      σep             σep
                                                                             extinction measurements and Ogren et al. (2017) for filter-
                      σsp    yields
                                                                             based absorption measurements. Averaging for longer peri-
SSA λσsp σap =                −→ 1SSA λσsp σap
                      σap+σsp                                                ods would only increase variances due to transmission (TAP)
 v
 u                           !2                            !2                and baseline drift (CAPS).
 u              σsp                     σap
=t               2            +             2 · 1σap (4)
         σap+σsp · 1σsp              σap+σsp

               σ (λ1)
                                                                            3     Measurements
         log σ xp
                xp (λ2) yields
AE = −                   −→ 1AE                                              3.1    Pure aerosol types
          log (λ1/λ2)
      s                                       2
                      −1                                                     The measured size parameters and calculated intensive pa-
    =                              · 1σxp (λ1)
           log (λ1/λ2) · σp (λ1)                                             rameters of the pure aerosol types are summarized in Ta-
                                          2                                ble 3. The errors reported in Table 3 are calculated from error
                    1                                                        propagation. The size distributions of the different aerosol
   +                            · 1σp (λ2) ,           (5)
       log (λ1/λ2) · σxp (λ2)                                                types were measured with a Grimm SMPS and are shown in

where σxp = σep , σsp , σap .                                                Fig. 2 normalized to 1000 particles per cubic centimetre. The
  Those equations could be expanded if the instruments                       Ångström exponents for the pure substances fall within typ-
where not calibrated properly, as Sherman (2015) proposed,                   ical ranges for these types of aerosols and size distributions
but are in accordance with the BIPM (Bureau International                    reported in the literature. For example, the SAE decreases
des Poids et Mesures).                                                       from a value of 3.22 for 40 nm AS particles, which is close
                                                                             to the SAE value of 4 for air molecules with increasing par-
2.4.4   Data averaging                                                       ticle diameter. Thus, the SAE drops to 0.76 for 130 nm com-
                                                                             pact AQ particles but increases to 0.99 for 140 nm fractal
For each experiment run, a different aerosol mixture was gen-                agglomerate soot. The shape of AQ is assumed to be more
erated with different optical properties and allowed a steady                compact than the soot agglomerates, such that their scatter-

https://doi.org/10.5194/amt-15-3279-2022                                                          Atmos. Meas. Tech., 15, 3279–3296, 2022
3284                                                     P. Weber et al.: Relative errors in intensive aerosol optical properties

Figure 2. Measured size distributions by SMPS for the pure aerosol
types used, normalized to an assumed total concentration.            Figure 3. Scatter plots of the extinction coefficients for different
                                                                     AQ–AS external mixtures at 630 nm (a) and 450 nm wavelengths
                                                                     (b). The y axes show the extinction coefficients derived by com-
ing and electrical mobility behaviours are dependent mainly          bining TAP absorption and NEPH scattering coefficients versus
                                                                     the CAPS PMSSA direct extinction coefficient measurements. The
upon their physical diameters. In contrast, the scattering be-
                                                                     colour code represents the SSA of the analysed mixed aerosol mea-
haviour of the fractal soot agglomerates is due mainly to the        sured at 630 nm wavelength. In addition, an error band of ±10 %
distribution of primary particles, whereas their electrical mo-      was added to the 1 : 1 line.
bility diameter is more dependent upon the major axis of the
agglomerate. As expected by Eq. (3a), the SSA increases
with decreasing wavelength (Bohren and Huffman, 1983).
The AAE for fractal combustion soot is close to 1, as reported       ues ranging from 0.3 to close to 1. The 10 % was chosen
by Török et al. (2018) for the mini-CAST soot generator.             to show the fulfilment of the requirements of Laj (2020) for
                                                                     aerosol properties. This shows that the instruments are not
3.2    Extensive parameters of aerosol mixtures                      sensitive to the SSA of the particle type used at either wave-
                                                                     length of interest.
First, the extensive parameters must be validated for all in-           The measured scattering coefficients at 450 and 630 nm
strument combinations to ensure the reliability of the inten-        wavelengths are compared using scatter plots for the differ-
sive parameters derived from them. We have chosen to use             ent techniques in Fig. 4. Here, we use the NEPH and the inte-
external mixtures of AS and AQ particles for these studies           grating sphere channel of the CAPS PMSSA instrument capa-
as they are both readily atomized, generating highly stable          ble of measuring the scattering coefficient directly. In addi-
aerosols for the necessary time periods for averaging. We            tion, we calculated the scattering coefficients using a differ-
note that AQ-absorbing aerosols are commonly used as a               ential method (DM), solving Eq. (1) for the scattering coef-
reference material for instrument comparisons (Foster et al.,        ficient by subtracting the absorption coefficient measured by
2019). The results for mixtures of AS with the other absorb-         the TAP from the extinction coefficient measured by CAPS
ing aerosol types are included in Tables 6–9.                        PMSSA . The NEPH is used as a reference because it has well-
   The two CAPS PMSSA ’s (450 and 630 nm wavelengths)                proven correction functions for light-absorption particles, as
measured the extinction coefficient of particles directly with       described in Sect. 2.4.1.
a small precision error of around 2 % (Modini et al., 2021). In         The measured scattering coefficients at both 450 and
Fig. 3, we show scatter plots of these direct extinction coeffi-     630 nm wavelengths agree within 10 % for the majority of
cient measurements (x axis) in comparison to the absorption          measurements. There is no apparent dependence of measured
coefficient measured using the TAP and the scattering coeffi-        scattering coefficients with scattering coefficient magnitude
cient measured using the NEPH combined using Eq. 1 in the            (over the range measured) nor with aerosol SSA, an indi-
form σep (NEPH, TAP) = σap (TAP) + σsp (NEPH) (y axis)               cator of the external mixing ratio. Several outliers are visi-
for wavelengths of 450 nm (Fig. 3b) and 630 nm (Fig. 3a).            ble, particularly for points with SSA values ∼ 0.35, indicat-
   Here, the measured 630 nm SSA colour code serves as a             ing nearly pure AQ aerosols. For the scattering coefficients
proxy for the mixing ratio of the external mixtures of neb-          derived using the differential method (CAPS extinction mi-
ulized AQ and AS particles. The measured 630 and 450 nm              nus TAP absorption), some of the scatter may be due to the
extinction coefficients align with the 1 : 1 line within 10 %        larger uncertainties associated with the filter-based absorp-
across a broad range of extinction values as well as SSA val-        tion measurements, as discussed in the Reno study (Sheridan

Atmos. Meas. Tech., 15, 3279–3296, 2022                                                https://doi.org/10.5194/amt-15-3279-2022
P. Weber et al.: Relative errors in intensive aerosol optical properties                                                          3285

Table 3. Overview of the measured intensive optical properties of the pure aerosol types.

                                                         AS            MB              BC            AQ           Soot
                Count median diameter                 40 nm          85 nm         105 nm         130 nm       140 nm
                Geometric standard deviation           1.60           1.50           1.55           1.65         1.65
                SSA 630 (NEPH, CAPS)                     1.0    0.85 ± 0.02    0.26 ± 0.03    0.37 ± 0.03   0.20 ± 0.02
                SSA 450 (NEPH, CAPS)                     1.0    0.92 ± 0.07    0.32 ± 0.04    0.44 ± 0.02   0.26 ± 0.08
                SAE (630/450) (NEPH)             3.22 ± 0.09    2.16 ± 0.37    1.71 ± 0.13    0.76 ± 0.06   0.99 ± 0.08
                AAE (630/450) (TAP)                        –    1.34 ± 0.12    1.16 ± 0.03    0.44 ± 0.02   1.08 ± 0.02
                EAE (630/450) (CAPS)             3.21 ± 0.08    2.03 ± 0.38    1.43 ± 0.65    0.52 ± 0.10   1.10 ± 0.10

Figure 4. Comparisons of measured light-scattering coefficients at 450 and 630 nm wavelengths for mixtures of AQ and AS aerosols. The
y axes show the CAPS PMSSA (integrating sphere) or the differential method (CAPS extinction minus TAP absorption) scattering versus
NEPH scattering measurements at 450 and 630 nm wavelengths. The colour code represents the SSA value of the measured aerosol mixture.
An error band of ±10 % was applied to the 1 : 1 line. Error bars shown represent instrument precisions (1σ ).

et al., 2005). The outliers in the CAPS vs. NEPH plots, espe-           exceptions for aerosols with low absorption and high SSA
cially at 450 nm wavelength, are currently unexplained and              values.
are likely due to apparent stability issues for these points.              The high Pearson correlation (R > 0.95) coefficients in
   Particle light-absorption coefficient measurements are the           Table 4 indicate that the correlations are highly linear. The
most complicated as none of our optical instrument tech-                primary focus for this study was to have most of the ex-
niques directly measure absorption. We have two meth-                   perimental runs exhibit light extinctions between 5 and
ods for measuring absorption coefficients: (1) the differ-              150 Mm−1 , representative of atmospheric conditions. The
ential method following Eq. (1), using either σap (CAPS,                slopes are all close to unity within the expected errors ranges,
NEPH) = σep (CAPS) – σsp (NEPH) or σap (CAPS,                           or at least single-instrument uncertainty, indicating closure
CAPS) = σep (CAPS) – σsp (CAPS), and (2) filter-based TAP               has been achieved for these optical measurements. Thus, the
measurements. As the filter-based method requires the ap-               extensive parameters can be trusted for instrument compar-
plication of multiple, empirical correction schemes, we have            ison, especially for the light-scattering and light-extinction
chosen σap (CAPS, NEPH) as the reference for the compari-               information. We provide regression analyses for all other
son of the σap (TAP) and σap (CAPS, CAPS) values.                       absorbing aerosol types externally mixed with AS in Ta-
   In Fig. 5, the light-absorption measurements at wave-                bles 7–9.
lengths of 450 and 630 nm are compared. We chose to in-                    Excellent agreement (R > 0.97) is shown for σsp measure-
clude 20 % error bands for these comparisons, though the                ments of the NEPH and the CAPS PMSSA scattering chan-
overall uncertainty for filter-based absorption measurements            nel, indicating that the CAPS PMSSA scattering channel be
is often estimated to be 30 % (Bond et al., 1999). Most of the          considered as a substitute for the nephelometer scattering
data points shown fall within the 20 % error band, with some            measurement. Trade-offs in the CAPS PMSSA versus NEPH
                                                                        comparison include the three wavelengths and backscatter

https://doi.org/10.5194/amt-15-3279-2022                                                     Atmos. Meas. Tech., 15, 3279–3296, 2022
3286                                                         P. Weber et al.: Relative errors in intensive aerosol optical properties

Figure 5. Scatter plots of measured 450 and 630 nm wavelength absorption coefficients of external mixtures of AQ and AS for different
instrument combinations. The colour code represents the SSA value of the respective data point. An error band of ±20 % was applied to the
1 : 1 line, which is required by Laj (2020) for light-absorption measurements. Error bars shown represent propagated instrument precisions
(1σ ).

Table 4. Linear regression results of scattering (σsp ), extinction (σep ) and absorption (σap ) coefficients from Figs. 3–5 for external mixtures
of AQ and AS particles, given as slopes (m), Pearson R and y axis intercepts (b).

                                          σsp (CAPS)     σsp (CAPS, TAP)       σep (NEPH, TAP)              σap (TAP)
                                                  vs.                  vs.                   vs.                   vs.
                                          σsp (NEPH)           σsp (NEPH)            σep (CAPS)     σap (CAPS, NEPH)
                         630 nm
                         m               1.07 ± 0.03          1.08 ± 0.05            0.99 ± 0.03            0.92 ± 0.07
                         R                      0.99                 0.97                   0.99                   0.95
                         b [Mm−1 ]      −1.84 ± 0.57         −2.15 ± 1.12            0.91 ± 0.93            0.78 ± 0.68
                         450 nm
                         m                0.99 ± 0.05         1.06 ± 0.03            0.98 ± 0.03            1.04 ± 0.08
                         R                       0.97                0.99                   0.99                   0.96
                         b [Mm−1 ]        1.14 ± 2.27        −4.60 ± 1.51            3.37 ± 1.71            2.13 ± 0.64

measurements of the NEPH versus the single wavelength                        points for external mixtures of AQ and AS falling within a
of the CAPS PMSSA , countered by the additional extinction                   range of σap (TAP)/σap (CAPS, NEPH) = {0.8–1.2}. These
measurement of the CAPS PMSSA allowing for absorption                        results support the linear regression results in Table 4, though
and SSA values to be simultaneously measured.                                they exhibit larger scatter due to the greater sensitivity to
   In addition to regression analyses, where outliers and/or                 small errors at low values.
high values can dominate the fitted slope of the regression,                    The average ratios for other externally mixed absorbing
another statistical approach is to investigate the ensemble-                 aerosol types deviate more from unity than AQ mixtures.
averaged instrumental ratios (σap (instrument 1)/σap (instru-                Most of this scatter can be ascribed to the greater sensitivity
ment 2)), which is more sensitive to errors at low values. Re-               of the ratio to small errors at low values. By filtering these
sulting 630 and 450 nm wavelength absorption coefficient ra-                 ratios for points with σap > 10 Mm−1 , approximately 80 %
tios are tabulated in Tables 5 and 6, respectively. The average              of the data are within the range of 0.8–1.2. The ratios for
ratios are calculated from the points shown in Fig. 5 for AQ                 σap < 10 Mm−1 exhibited almost no modal value in the rel-
and AS mixtures and from results obtained for the other ab-                  ative frequency distributions, confirming that scatter in low
sorbing particle types externally mixed with AS particles.                   values significantly affects the average ratios.
   Table 5 demonstrates that the light-absorption values agree                  Redoing this analysis for 450 nm wavelength, the light ex-
for the different methods in general. With an ensemble aver-                 tinction and scattering of smaller particles increases com-
age for the ratio σap (TAP)/σap (CAPS, NEPH) of 0.97±0.22,                   pared to the values at 630 nm wavelength. As a result, the
good agreement is confirmed, with over 60 % of all data                      errors in calculating the 450 nm wavelength absorption co-

Atmos. Meas. Tech., 15, 3279–3296, 2022                                                        https://doi.org/10.5194/amt-15-3279-2022
P. Weber et al.: Relative errors in intensive aerosol optical properties                                                          3287

Table 5. Ensemble-average ratios of σap (TAP)/σap (CAPS, NEPH) at 630 nm wavelength. N denotes the number of experiments used for
the average.

                       630 nm wavelength                     BC             AQ           SOOT             MB
                       σap (TAP)/σap                  1.22 ± 2.57   0.97 ± 0.22    1.10 ± 1.22    0.88 ± 0.17
                       (CAPS, NEPH)                     (N = 36)      (N = 28)       (N = 25)        (N = 8)
                       σap (TAP)/σap                  1.08 ± 0.19   0.94 ± 0.10    0.86 ± 0.13               –
                       (CAPS, NEPH) for                 (N = 24)      (N = 11)        (N = 6)
                       samples with σap > 10 Mm−1

Table 6. Ensemble-average ratios of σap (TAP)/σap (CAPS, NEPH) at 450 nm wavelength. N denotes the number of experiments used for
the average.

                       450 nm wavelength                     BC              AQ          SOOT             MB
                       σap (TAP)/σap                  1.03 ± 1.72   1.06 ± 0.38    0.89 ± 1.05    1.28 ± 2.91
                       (CAPS, NEPH)                     (N = 36)      (N = 28)       (N = 25)        (N = 8)
                       σap (TAP)/σap                  1.08 ± 0.33   1.01 ± 0.13    0.84 ± 0.27               –
                       (CAPS, NEPH) for                 (N = 24)      (N = 11)        (N = 6)
                       samples with σap > 10 Mm−1

efficients from the differential method also increase. As
demonstrated in Table 6, only the variance for the ratio σap
(TAP)/σap (CAPS, NEPH) for compact AQ particles was less
than 1 (i.e. < 100 %), with over 50 % of the data being within
the range of 0.8–1.2. All ensemble-average ratios were close
to 1; however, with an associated error of up to ±1.7 (i.e.
±170 %), these values are not significant, which means
that the ratios scatter widely with no clear modal value.
Again, filtering the 450 nm data for σap > 10 Mm−1 greatly
improves the results, with ratios σap (TAP)/σap (CAPS,
NEPH) = 1.08 ± 0.33 for BC. The best instrumental ratio of
1.01 ± 0.13 is shown for AQ mixtures in Table 6 at 450 nm
wavelength.
   In order to demonstrate the dependency of the uncertain-
ties associated with the differential methods for deriving
σap values on the SSA, the ensemble variance ratios of σap
(CAPS, CAPS)/σap (TAP) are shown as functions of SSA
in Fig. 6. For SSA values greater than 0.9, light-absorption        Figure 6. Variance of the measured absorption coefficients (σap
coefficients derived for the DMs have propagated uncertain-         (CAPS, CAPS)/σap (TAP)) for differential method calculations rel-
ties over 100 % independently of their load. The experimen-         ative to TAP measurements for AQ and AS external mixtures.
                                                                    The ratios are plotted against the aerosol measured SSA values
tal data align within these calculated relative uncertainties.
                                                                    (SSA(CAPS, CAPS)). The red line represents the calculated rela-
   The linear regression analyses reporting fitted slopes,          tive errors using Gaussian error propagation of the uncertainties in
Pearson coefficients, and y offsets for attenuation coeffi-         the DM with 1 as 100 %.
cients for external mixtures of AS and the different light-
absorbing aerosol types are presented in Table 7 (BC), Ta-
ble 8 (SOOT) and Table 9 (MB). For 630 nm wavelength                ence is only 10 %. The reason could be that soot is a fractal
results, high Pearson coefficients (R > 0.96) with negligible       agglomerate, and in situ methods as well as filter-based meth-
offsets (b < 1 Mm−1 ) and slopes ranging from 0.90 to 1.05          ods give different results as a function of the primary particle
demonstrate good agreement (i.e. closure) for scattering and        size (Sorensen, 2010) as well as of the previously mentioned
extinction coefficient measurements. Especially for MB and          filter-based artefacts, including changes in the slope at higher
SOOT, the TAP measurements tend to overshoot the differen-          σap (TAP) values. We measured values for BC ranging from
tial method value by 20 %–40 %, whereas for BC the differ-          14 to 400 Mm−1 for σep,630 nm , 1 to 322 Mm−1 for σap,630nm

https://doi.org/10.5194/amt-15-3279-2022                                               Atmos. Meas. Tech., 15, 3279–3296, 2022
3288                                                        P. Weber et al.: Relative errors in intensive aerosol optical properties

Table 7. Linear regression results of scattering (σsp ), extinction (σep ) and absorption (σap ) coefficients for external mixtures of BC and AS
particles, given as slopes (m), Pearson R and y axis intercepts (b).

                                   σsp (CAPS) vs.     σsp (CAPS, TAP) vs.       σep (TAP, NEPH) vs.          σap (TAP) vs.
                     BC               σsp (NEPH)              σsp (NEPH)                 σep (CAPS)    σap (CAPS, NEPH)
                     630 nm
                     m               1.02 ± 0.03              0.99 ± 0.05               0.94 ± 0.02           0.90 ± 0.02
                     R                      0.98                     0.96                      0.99                  0.99
                     b [Mm−1 ]       −0.69 ± 0.7             −2.13 ± 1.01               3.59 ± 0.60           2.57 ± 0.11
                     450 nm
                     m                0.99 ± 0.02             1.06 ± 0.06               0.94 ± 0.03           0.86 ± 0.05
                     R                       0.99                    0.95                      0.98                  0.97
                     b [Mm−1 ]        5.36 ± 1.45            −0.59 ± 3.86               0.97 ± 3.17           2.98 ± 0.48

Table 8. Linear regression results of scattering (σsp ), extinction (σep ) and absorption (σap ) coefficients for external mixtures of SOOT and
AS particles, given as slopes (m), Pearson R and y axis intercepts (b).

                                   σsp (CAPS) vs.     σsp (CAPS, TAP) vs.       σep (TAP, NEPH) vs.          σap (TAP) vs.
                     SOOT             σsp (NEPH)              σsp (NEPH)                 σep (CAPS)    σap (CAPS, NEPH)
                     630 nm
                     m                1.06 ± 0.04               0.9 ± 0.20              0.99 ± 0.08            0.76 ± 0.11
                     R                       0.99                     0.74                     0.97                   0.92
                     b [Mm−1 ]        0.05 ± 0.56              1.57 ± 3.21              1.80 ± 1.72            3.93 ± 1.68
                     450 nm
                     m                0.81 ± 0.03              0.77 ± 0.07              0.92 ± 0.04            0.70 ± 0.10
                     R                       0.99                     0.97                     0.98                   0.91
                     b [Mm−1 ]        1.73 ± 0.45              2.64 ± 0.91              3.26 ± 2.24            1.75 ± 0.82

and 12 to 174 Mm−1 for σsp,630 nm . For SOOT, we measured                 3.3     Intensive parameters of aerosol mixtures
values ranging from 12 to 158 Mm−1 for σep,630 nm , 1 to
322 Mm−1 for σap,630 nm and 5 to 80 Mm−1 for σsp,630 nm .                 3.3.1     Single-scattering albedo (SSA)
   For 450 nm wavelength results, similar slopes, Pearson R
and y offset values are reported. Linear regression slopes for            The single-scattering albedo (SSA), an important climate pa-
SOOT decrease at the lower wavelength to a value of 0.77                  rameter, is investigated here as a relative measurement using
for light scattering and 0.7 for light absorption. This decrease          multiple different methods of derivation to determine if clo-
may well be an effect of the primary particle size of agglom-             sure between the different methods can be achieved.
eration since those relationships change with the wavelength.               The SSAs for different combinations of instruments are
For MB, the light-absorption measurements using the DM                    derived using Eq. (2), with the instruments used denoted in
show the highest difference compared to the TAP measure-                  parentheses in Eqs. (7)–(10).
ment, with a regression slope of 0.21 ± 0.14. The reasons                                         σsp (NEPH)
could include different absorption behaviour (i.e. filter-based           SSA(NEPH, TAP) =                                                  (6)
                                                                                           σap (TAP) + σsp (NEPH)
artefacts) for the filter-based method relative to in situ mea-                            σep (CAPS) − σap (TAP)
surements (Lack et al., 2008). Unfortunately, no clear under-             SSA(CAPS, TAP) =                                                  (7)
                                                                                                  σep (CAPS)
standing of the MB particle shape, phase or uniformity could
be made during this study.                                                                   σsp (CAPS)
                                                                          SSA(CAPS, CAPS) =                                                 (8)
                                                                                             σep (CAPS)
                                                                                             σsp (NEPH)
                                                                          SSA(NEPH, CAPS) =                                                 (9)
                                                                                             σep (CAPS)
                                                                          We have chosen to use the SSA(NEPH, CAPS)-derived SSA
                                                                          values as a reference for these studies as this method allows

Atmos. Meas. Tech., 15, 3279–3296, 2022                                                      https://doi.org/10.5194/amt-15-3279-2022
P. Weber et al.: Relative errors in intensive aerosol optical properties 3289
Table 9. Linear regression results of scattering (σsp ), extinction (σep ) and absorption (σap ) coefficients for external mixtures of MB and AS
particles, given as slopes (m), Pearson R and y axis intercepts (b).
σsp (CAPS) vs. σsp (CAPS, TAP) vs. σep (TAP, NEPH) vs. σap (TAP) vs.
MB σsp (NEPH) σsp (NEPH) σep (CAPS) σap (CAPS, NEPH)
630 nm
m 0.96 ± 0.03 1.05 ± 0.03 0.96 ± 0.03 0.57 ± 0.10
R 0.99 0.99 0.99 0.94
b [Mm−1 ] 0.42 ± 0.79 −0.95 ± 0.53 0.99 ± 0.51 1.06 ± 0.38
450 nm
m 1.02 ± 0.02 1.00 ± 0.16 0.89 ± 0.11 0.21 ± 0.14
Rb 0.99 0.95 0.97 0.58
[Mm−1 ] −1.85 ± 0.78 −0.82 ± 6.04 4.58 ± 4.88 3.43 ± 0.91
eral, the higher the SSA values, the lower the measured ab-
sorption coefficients, σap , reflecting the fact that there are
just fewer particles of Aquadag in the external aerosol mix-
ture. The exception to this trend and the points exhibiting the
greatest number of outliers (> 10 % from 1 : 1 line) are the
points with high absorption coefficients (> 50 Mm−1 ). The
largest outliers are observed in the instrument combinations
that include the TAP and may be due to a nonlinear response
in the TAP under high aerosol loadings.
Similar to the previous section, we calculated the ensem-
ble instrument-to-instrument measurement ratio averages,
using the SSA(NEPH, CAPS) values for reference, as an-
other way of examining the correlations. The SSA values for
all absorbing aerosol types (externally mixed with AS) are
summarized in Table 10. The largest variance deviation is
visible with combustion soot for TAP-related data. The devi-
ations of the reported mean from 1 are less than the relative
uncertainties, which are around 0.09.
Figure 8 shows the SSA values obtained by the three com-
Figure 7. Scatter plots of derived SSA values from various combi- binations of measurements at 450 nm wavelength for all AQ–
nations of measurements at 630 nm wavelength obtained for AQ– AS external mixtures. Observed patterns are comparable to
AS mixtures (y axis) versus SSA(NEPH, CAPS) as the reference the 630 nm wavelength results in Fig. 7. For absorption co-
on the x axis. The colour code indicates σap (TAP) values shown in efficients up to 50 Mm−1 , all methods agree within 10 %.
inverse megametres (Mm−1 ). Above 50 Mm−1 , the largest outliers are again observed in
the instrument combinations that include the TAP instru-
ment.
Table 11 summarizes the 450 nm wavelength ensemble
us to test the CAPS-measured SSA with an independent, es-
instrument-to-instrument measurement ratio averages, using
tablished method (Sheridan et al., 2005). However, a strong
the SSA(NEPH, CAPS) values for reference. The pattern
argument could be made that the CAPS PMSSA -derived SSA
that fractal aerosol optical properties appear to differ most
values should be the true reference here as the CAPS-derived
from the reference values as the wavelength decreases is vis-
SSA values were obtained by simultaneously measuring the
ible here, too. The fresh combustion soot aerosol shows the
scattering and extinction of same aerosol sample within a sin-
largest deviation from 1 (0.64 ± 0.38) for SSA(CAPS, TAP)
gle instrument.
measurements. But, overall, all the instrument-to-instrument
Figure 7 shows the SSA values obtained by the three com-
ratios are unity within the observed variances.
binations of measurements at 630 nm wavelength. The cor-
relations show reasonable results relative to a ±10 % error
band, with the best correlation obtained for the SSA(CAPS,
CAPS) versus SSA(NEPH, CAPS) measurements. In gen-
https://doi.org/10.5194/amt-15-3279-2022 Atmos. Meas. Tech., 15, 3279–3296, 20223290 P. Weber et al.: Relative errors in intensive aerosol optical properties
Table 10. Ensemble instrument-to-instrument measurement ratio averages and standard deviations for different instrument combinations
used to derive SSA values at 630 nm wavelength using SSA(NEPH, CAPS) as a reference.
Instrument combinations used for SSA calculations BC AQ SOOT MB
SSA(CAPS, CAPS)/SSA(NEPH, CAPS) 1.00 ± 0.08 1.01 ± 0.07 1.07 ± 0.07 1.00 ± 0.04
SSA(NEPH, TAP)/SSA(NEPH, CAPS) 0.96 ± 0.08 1.02 ± 0.08 1.04 ± 0.29 1.00 ± 0.03
SSA(CAPS, TAP)/SSA(NEPH, CAPS) 0.98 ± 0.16 1.05 ± 0.16 1.07 ± 0.51 1.00 ± 0.03
Table 11. Ensemble instrument-to-instrument measurement ratio averages and standard deviations for different instrument combinations
used to derive SSA values at 450 nm wavelength using SSA(NEPH, CAPS) as a reference.
Instrument combination used for SSA calculation BC AQ SOOT MB
SSA(CAPS, CAPS)/SSA(NEPH, CAPS) 1.17 ± 0.21 1.04 ± 0.13 1.11 ± 0.13 0.98 ± 0.02
SSA(NEPH, TAP)/SSA(NEPH, CAPS) 1.07 ± 0.08 1.02 ± 0.08 0.96 ± 0.19 1.04 ± 0.13
SSA(CAPS, TAP)/SSA(NEPH, CAPS) 1.11 ± 0.13 1.03 ± 0.14 0.64 ± 0.38 1.05 ± 0.14
The following equations, based on Eq. (3), are used to
derive the Ångström exponents for extinction, scattering
and absorption using different instrument combinations with
their specific wavelengths indicated:
xAE (instrument1, instrument2)
σ (instrument1,instrument2)
log σxpλ1
xpλ2 (instrument1,instrument2)
=− (10)
log(λ1/λ2)
σepλ1 (CAPS)
log σepλ2 (CAPS)
EAE (CAPS) = − (11)
log(450/630)
(σ (TAP)+σ (NEPH))
σ
log σepλ1 σap (TAP)+σsp (NEPH)
epλ2 ( ap sp )
EAE (NEPH, TAP) = −
log(450/630)
(12)
σspλ1 (NEPH)
log σspλ2 (NEPH)
SAE (NEPH) = − (13)
log(450/700)
(σ (CAPS)−σ (TAP))
σ
Figure 8. Scatter plots of differential-method-derived SSA values log σspλ1 σep (CAPS)−σap (TAP)
spλ2 ( ep ap )
for different instrument combinations at 450 nm wavelength using SAE (CAPS, TAP) = − (14)
AQ–AS mixtures versus SSA(NEPH, CAPS). The colour code in-
log(450/630)
dicates σap (TAP) values shown in inverse megametres (Mm−1 ).
σapλ1 (TAP)
log σapλ2 (TAP)
AAE (TAP) = − (15)
log(467/652)
3.3.2 Ångström exponents
(σ (CAPS)−σ (NEPH))
σ
log σapλ1 σep (CAPS)−σsp (NEPH)
apλ2 ( ep sp )
Ångström exponents are calculated from extensive parame- AAE (CAPS, NEPH) = − .
log(450/630)
ters measured at different wavelengths. Even a small error in
(16)
the extensive parameter measurements can result in a signifi-
cant uncertainty in the derived Ångström exponents, consid- 3.3.3 Extinction Ångström exponents (EAEs)
ering error propagation. Some of optical instruments used in
the current study operated at slightly different wavelengths The derived EAE(NEPH, TAP) and EAE(CAPS) values are
such that the derived Ångström exponents will exhibit slight shown in Fig. 9 as a scatter plot and in Fig. 10 as a ratio
biases due to these wavelength differences; these biases are versus the 630 nm wavelength SSA(NEPH, CAPS) values.
small relative to the observed variances and are thus assumed The EAE(CAPS) values were used as the reference mea-
negligible. surement. When directly comparing EAE(NEPH, TAP) to
Atmos. Meas. Tech., 15, 3279–3296, 2022 https://doi.org/10.5194/amt-15-3279-2022P. Weber et al.: Relative errors in intensive aerosol optical properties 3291
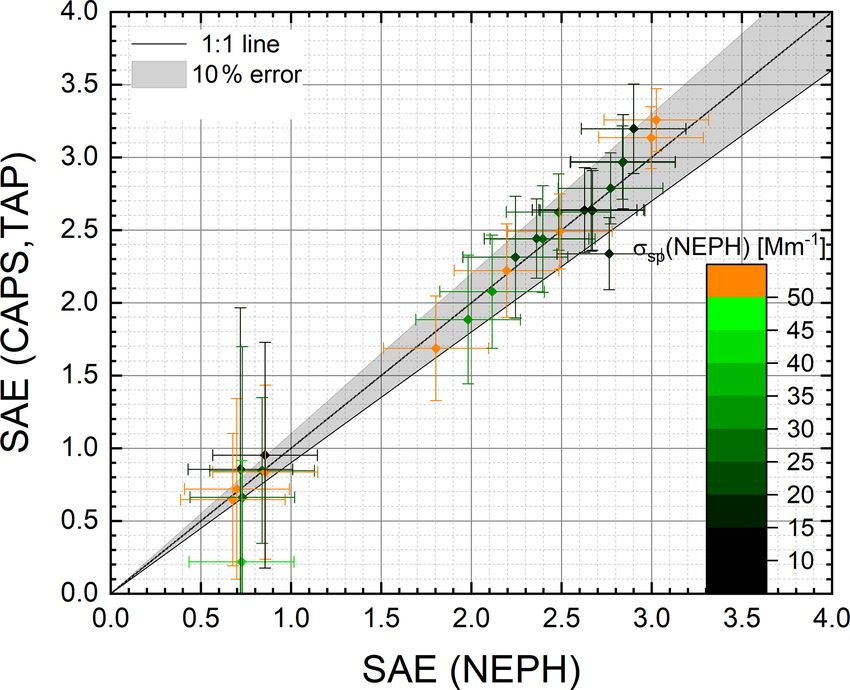
Figure 11. Scatter plot of SAE(CAPS, TAP) measurements com-
Figure 9. Scatter plot of EAE(NEPH, TAP) measurements com- pared to SAE(NEPH) measurements for AQ–AS mixtures. An error
pared to EAE(CAPS) measurements for AQ–AS mixtures. An error band of 10 % is shown.
band of 10 % is shown.
Figure 12. The scattering Ångström exponent ratio, SAE(CAPS,
Figure 10. The extinction Ångström exponent EAE(NEPH, TAP)/SAE(NEPH), as a function of 630 nm wavelength
TAP)/EAE(CAPS) ratios as a function of 630 nm wavelength SSA(NEPH, CAPS) values for AQ–AS mixtures. The 630 nm
SSA(NEPH, CAPS) values for AQ–AS mixtures. The 630 nm wavelength light-absorption coefficient, σap (TAP), is used as the
wavelength light-absorption coefficient, σep (CAPS), is used as the colour code.
colour code.
3.3.4 Scattering Ångström exponent (SAE)
EAE(CAPS), the EAE values agree within 10 % variance.
The highest measured EAE values for the AQ and AS mix- The derived SAE(CAPS, TAP) and SAE(NEPH) values are
tures, ∼ 3, were close to the EAE values measured for the shown in Fig. 11 as a scatter plot and in Fig. 12 as a ratio
pure AS particle distributions with CMD ∼ 40 nm (Table 3). versus the 630 nm wavelength SSA(NEPH, CAPS) values.
The measured EAE(NEPH, TAP)/EAE(CAPS) ratios exhib- The SAE(NEPH) values were used as the reference mea-
ited no systematic dependence on the σap (TAP) (Fig. 9) or surement. All SAE(CAPS, TAP) and SAE(NEPH) values
SSA(NEPH, CAPS) (Fig. 10) values. Measured EAE(NEPH, agree within 10 % variance, and the measured SAE(CAPS,
TAP)/EAE(CAPS) ratios for all absorbing aerosol types (ex- TAP)/SAE(NEPH) ratios exhibited no systematic depen-
ternally mixed with AS) are listed in Table 12. dence on the σsp (CAPS) for 630 nm wavelength (Fig. 11)
or SSA(NEPH, CAPS) (Fig. 12) values. The measured
SAE(CAPS, TAP)/SAE(NEPH) ratios for all absorbing
aerosol types (externally mixed with AS) are listed in Ta-
ble 12.
https://doi.org/10.5194/amt-15-3279-2022 Atmos. Meas. Tech., 15, 3279–3296, 20223292 P. Weber et al.: Relative errors in intensive aerosol optical properties
3.3.5 Absorbing Ångström exponent (AAE)
The absorption Ångström exponent (AAE) depends entirely
on the absorbing particle type and coatings and should not
differ when the light absorbing particles are externally mixed
with non-light-absorbing particles. Thus, scatter plots of
AAE values should exhibit a single point. Figure 13 shows
the derived AAE(CAPS, NEPH) values relative to the de-
rived AAE(TAP) values for pure AQ and for AQ–AS exter-
nal mixtures. The AAE(TAP) values were chosen as the ref-
erence measurements here, despite the potential for known
filter-based artefacts. The pure AQ measurements in Fig. 13
exhibit a compact cluster around AAE ∼ 0.4, indicating that
a well-defined (i.e. small variance) set of AAE measure-
ments were obtained for both AAE measurements. The mea- Figure 13. Scatter plot of AAE(CAPS, NEPH) measurements com-
sured AAE for pure AQ particles of 0.4 is consistent with the pared to AAE(TAP) measurements for pure AQ and AQ–AS exter-
“close-to-zero” result reported by Aiken (2016). nal mixtures. Measured precision error bars are shown for individ-
The externally mixed AQ–AS results show a significantly ual externally mixed AQ–AS measurements.
different result. For the AQ–AS mixtures, the AAE(TAP) ex-
hibited a similar variance as for the pure AQ aerosols, while
the AAE(CAPS, NEPH) values exhibited a much larger vari-
ance, including unphysical negative values. One reason for
the larger AAE(CAPS, NEPH) variances observed for the
external AQ–AS mixtures relative to the pure AQ is that
the mixed AQ–AQ samples were conducted at significantly
lower AQ loadings (i.e. lower σap values). Another reason is
that the pure AQ aerosols exhibited the lowest SSA values
(∼ 0.37 from Table 3) relative to the AQ–AS external mix-
tures.
Figure 14 shows the ratio AAE(CAPS, NEPH)/AAE(TAP)
versus the 630 nm wavelength SSA(NEPH, CAPS) values.
As predicted in the propagated error analysis shown in Fig. 6,
higher SSA values cause higher uncertainties in differential-
method-calculated light-absorption coefficients, σap (DM),
and, therefore, the derived AAE(CAPS, NEPH) values. In Figure 14. The absorbing Ångström exponent ratio, AAE(CAPS,
fact, since the derived AAE(CAPS, NEPH) values depend NEPH)/AAE(TAP), as a function of 630 nm wavelength
upon σap (DM) measurements at two different wavelengths, SSA(NEPH, CAPS) values for AQ–AS mixtures. The 630 nm
the AAE uncertainties will be significantly higher than the wavelength light-absorption coefficient, σap (TAP), is used as the
corresponding σap (DM) uncertainties, especially at high colour code. Measured precision error bars are shown for individual
SSA values. Figure 14 indicates that when lowering the ab- measurements.
sorption coefficients below 50 Mm−1 or increasing the SSA
above 0.5, the derived AAE (CAPS, NEPH) values begin to
sorption (AAE) exhibit large deviations from unity with even
vary strongly relative to the AAE (TAP) values. For labora-
larger variances. A large deviation for the AAE ratio value is
tory studies, aerosols with similarly low SSA values and high
associated with weak absorption coefficients of the aerosol
absorbing particle concentrations can be readily achieved
mixtures used. Therefore, the AAE values show the biggest
but are rarely present in the ambient atmosphere. There-
differences within the instrument-to-instrument ratio analy-
fore, extreme caution is justified when attempting to derive
sis.
AAE(CAPS, NEPH) values for atmospheric measurements.
Table 12 summarizes the averages and standard deviations
of the measured Ångström exponent ratios, EAE(NEPH, 4 Conclusions
TAP)/EAE(CAPS), SAE(CAPS, TAP)/SAE(NEPH) and
AAE(CAPS, NEPH)/AAE(TAP). The average Ångström ex- A major goal of this study was to determine if the in-
ponent ratios for light extinction (EAE) and scattering (SAE) tensive optical aerosol parameters, single-scattering albedo
fall within 10 % of unity, with SOOT exhibiting large vari- and Ångström exponents for externally mixed absorbing
ances. The average Ångström exponent ratios for light ab- and non-absorbing aerosols could be measured within re-
Atmos. Meas. Tech., 15, 3279–3296, 2022 https://doi.org/10.5194/amt-15-3279-2022You can also read