Our district District profile Our financial and other general assumptions section 2a 2b - Hauraki District Council
←
→
Page content transcription
If your browser does not render page correctly, please read the page content below
Section 2
Our district
section
District profile 2a
Our financial and other general assumptions 2b
District Profile
The Hauraki District contains a diversity of land, communities and economies. Our location puts us in the ‘golden
triangle’ between Auckland, Tauranga and Hamilton, and provides for a number of potential business opportunities to
settle within our district. Due to the flow on effects of the growth pressures facing Auckland, Hamilton and Tauranga,
in the past year we have seen more people living in our district than we anticipated, and added demand for new houses.
With our active support of economic development initiatives, we are expecting our local economy to continue to
perform well and our local population to keep growing.

Our Home
Our land
Our district sits at the south of Te Tara o te Ika o Maui – the barb of the fish of Maui.
It is geographically diverse and stretches from the shelly beaches of Kaiaua and
Pūkorokoro / Miranda along the Firth of Thames in Tῑkapa Moana (the Hauraki Gulf)
to the white sandy beaches of the Pacific Ocean at Whiritoa. Between lies the rich
reclaimed dairy lands of the Hauraki Plains, the rugged beauty of the Karangahake
Gorge and Kaimai/Coromandel ranges, and the rolling farmlands of the Golden
Valley. We sit within the rohe of the iwi of Hauraki which stretches from Matakana
in the north to Matakana Island in the south.
                                                                                                                    Our total area is
The Hauraki District Council was formed in 1989 when the Hauraki Plains County,
Ohinemuri County, Paeroa Borough and Waihi Borough Councils were combined
                                                                                                                           1,269
as part of a major restructuring of local government within New Zealand. Kaiaua                                       square kilometres
and the wider Seabird Coast became part of the Hauraki District in 2010 when the
Auckland Council was formed

We are part of the Waikato region and are located within New Zealand’s economic
‘golden triangle’ being only an hour drive from the cities of Auckland, Hamilton and
Tauranga. Our total area is 1,269 square kilometres, and our estimated population
at June 2017 was 19,850.1 We may have less than 1% of New Zealand’s population,                                Estimated population
but we have a lot of natural, cultural and historic taonga to look after. The Kopuatai
Peat Dome and the Pūkorokoro / Miranda area on the Firth of Thames are                                                 19,850
recognised by the Ramsar Convention as wetlands of international importance.
                                                                                                                           At June 2017
Another area of natural beauty, the Karangahake Gorge, is visited by over 130,000
people a year who wish to experience the significant natural, cultural and historic
features of the area and ride the historic Goldfields Railway. The iconic Hauraki Rail
Trail traverses our district from Kaiaua through the Karangahake Gorge to Waihi,
and connects us to our neighbours and the towns of Thames and Te Aroha.

The clear waters of the rugged Ohinemuri River flow through the Karangahake
Gorge until Paeroa where it joins with the Waihou River. The Waihou River
originates from the Mamaku Ranges (close to Rotorua) and flows past the towns of                               The Karangahake Gorge,
Putaruru, Te Aroha and Paeroa before draining into the Firth of Thames. The Piako                                      is visited by over
River originates in the ranges west of Matamata and flows through the Hauraki
Plains, also draining into the Firth of Thames.                                                                     130,000
                                                                                                                           people a year

1 Statistics New Zealand, Hauraki District Council estimated usually resident population as at 30 June 2017.

                                                                                                                    District Profile | 2a - 1
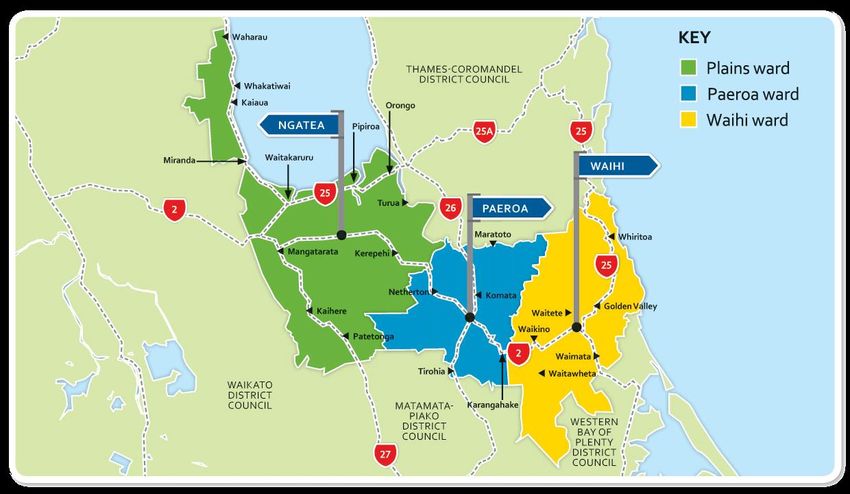
Wards
Our district is divided into three wards; Waihi, Paeroa, the Plains, with each ward made up of geographical areas called
census area units.2 These ward areas and census area units are shown on the maps. Our three most populated towns
are Paeroa, Ngatea and Waihi.

                               Waihi the ‘town with a heart of gold’ features a large open cast gold mine and adjacent
                               walking track right in the middle of town and the historic Cornish Pump House overlooks the
                               main street where the annual Beach Hop warm-up party is held. The beach village of Whiritoa
                               sits on the eastern coast of the Coromandel Peninsula.

                               Paeroa is ‘world famous in New Zealand’ as the home of the L&P soft drink and is also
                               renowned as a great place to seek out antiques with many antique and op-shops lining the
                               main street. Annual events such as the Highland Tattoo and Battle of the Streets motorcycle
                               race attract thousands of visitors each year. The Ohinemuri river flows through the Paeroa
                               ward and joins to the Waihou river north of the town.

                               The Hauraki Plains also have a unique recent history as the area was drained and cleared
                               of swamp lands through a huge land drainage programme which started in the early 1900’s.
                               Ngatea is the centre of hockey in the Thames Valley and is packed with people once a year
                               for the Ngatea garage sale. The Pūkorokoro / Miranda and Kaiaua coastline is on the western
                               side of Tikapa Moana.

A map of the Hauraki District

2   Census area units are geographic areas that Statistics New Zealand use when grouping data.

                                                                                                     District Profile | 2a - 2
Our people
At the 2013 Census people were able to note all 17 out of 20
ethnicities they identified with. 17 out of 20 people
in our population identified as European and around
people in our population
20% of people said they identified as Māori, identified as European
compared with 15% for New Zealand. Te Reo Māori was spoken by nearly 5%
of our population which is slightly higher than the national average of 3.7%.
Our district has a higher than national average percentage of European and
Māori population with less Pacific, Asian and ‘other’ ethnicities however we are
becoming more diverse as our population grows.
20% of people
in Hauraki said they
The Hauraki Iwi including Ngāti Hako, Ngāi Tai ki Tāmaki, Ngāti Hei, Ngāti identified as Māori and
Maru, Ngāti Paoa, Ngāati Porou ki Hauraki, Ngāti Pūkenga, Ngāti Rāhiri
Tumutumu, Ngāti Tamaterā, Ngāti Tara Tokanui, Ngaati Whanaunga and Te
nearly 5%
Patukirikiri have mana whenua status in our district and surrounding districts. of our population
They are collectively and individually in the process of negotiating treaty speak Te Reo Maori
settlements with the Crown. When the settlement has been agreed and
proposed as law, we will know more about the greater role our iwi will have in
governance and conservation in their rohe (area). We’ll continue to work with
Hauraki Iwi into the future for the benefit of our district.
From 2015 to 2016 the average annual income in our district was $48,970,
which was an increase of 2.7% from the previous year. Our residents’ annual 65+
income is lower compared to the national average, however it has been Almost a quarter of
growing slightly higher than the national average over the past ten years. We our population is over
have a focus on improving the economic and social wellbeing of the
community where we’re able to so our residents have jobs, liveable income
65 years
levels, and the resources needed to achieve a better standard of living. This is
important to us because at the last Census it was identified that parts of our
district are more deprived3 compared to other parts of New Zealand. Waihi and
Paeroa census area units have a deprivation value of 10 on a scale of 1-10, $48,970
which means they are in the most 10 per cent of socio-economically deprived the average annual income (2016)
areas in New Zealand.
We are considered a more affordable place to live when compared to the New 2.7%
Zealand average, taking into consideration our earnings and house prices. Average annual income
from 2015 to 2016
3 NZDep2006 and NZDep2013 Index of socio-economic deprivation, University of Otago.
District Profile | 2a - 3Our economy
The New Zealand economy grew by 2.5% from 2015 to 2016,
1,411 people employed
and our district’s economy was down 2.6%, while our total in primary industries which is
employment was up by 1.1%. We have more people employed
in our district that are self-employed (27%) than the New Zealand average
19.6% of our district
(18%).
At the last Census, just over half of the district population were in paid
employment and 38.5% of the population were not in the labour force, which 860 employed in health
is reflective of our large percentage of primary and secondary school aged
care and social assistance
children and retirees.
Gross domestic product4 (GDP) in our district measured $882 million
between 2015 and 2016 and accounted for 0.4% of national GDP in 2016. We
have advantages against the national economy in mining, dairy cattle
farming, and meat and meat product manufacturing. 633 employed in retail
and trade
Our industry
Primary industries account for the largest proportion of gross
domestic product in our district (45%), which is higher than in jobs
the national economy (7%). Among broad industries mining was the largest for 2015-2016
in our district in 2016, accounting for 26% of total GDP, with agriculture, Retail trade up 43 jobs
forestry and fishing coming in second (19%), followed by manufacturing
(6%).
construction sector up 41 jobs
accommodation and food
5
Among detailed industries , after mining, dairy cattle farming was the services up 39 jobs
second largest contributor to GDP (15%), followed by health care and social
assistance (5.6%).
Average current house value
Although a ‘broad industry’ may be growing rapidly, if it is small relative to a in our District was
region's total economy its contribution to overall GDP growth may also be
small. Taking into account their relative sizes, the broad industries that $278,397 in 2016
contributed the largest to the overall growth of our district’s economy to
March 2016 were retail trade which grew by 11% between 2015 and 2016 and
construction which grew by 0.22%.
Growth in house price was
15% between 2015 / 2016
Growth in the number of business units gives us an indication of
entrepreneurial activity. It shows we have an environment in which
entrepreneurs are prepared to take risks to start new ventures. 2,772
business units were recorded in our district in 2016, up 2.7% from a year
earlier.
Tourism has grown rapidly in New Zealand since 2000. Not only has the
number of overseas tourist arrivals increased substantially, but the level of
domestic tourism has also expanded rapidly as spending on leisure by New
114,527 cows in 2016
(down 1.9% on previous year)
Zealand residents increased. Since the opening of stage one of the Hauraki
Rail Trail cycleway in 2013 our district has seen an increase in total tourism
spend.
4 GDP is the total value of goods produced and services provided by all people and companies in the country during one year. In this
profile Gross Domestic Product for our District is estimated in constant 2010 prices by Infometrics.
5 There are 54 specific industry groups, which are grouped into 21 broad industry groups.
District Profile | 2a - 4Industry proportion of GDP
(by broad industry type)
All others Mining
18% 26%
Education and Training
3%
Construction
4%
Owner-Occupied Property
Operation
5%
Rental, Hiring and Real Agriculture, Forestry and
Estate Services Fishing
5% 19%
Health Care and Social
Assistance Unallocated
Manufacturing
6% 8%
6%
District Profile | 2a - 5Our Future
Our population6
With almost a quarter of our population over 65 years, we
have an ‘aging population’ when compared to the national
average of 15%. We will continue to have a greater number Aging population
of older people living in our district for the next 30 years, by 2048 it’s estimated that
despite the national projection that by 2045 the grandchildren of the baby
around 39% of our
boomer generation will outnumber the baby boomers themselves.
population will be over 65
With an older population it is common that the number of people living in
each household decreases. In 2006 there was an average of 2.5 people living
in each home in our district but this is expected to decrease to 2.05 people by
2048. 2.5 people on average
living in each home in
Our 2015-25 Long Term Plan was prepared on an assumption that our
population would remain relatively stable. This is no longer the case, as our
our district in 2006,
local population has grown faster than anticipated in the last three years; in expected to decrease to
2013 our population was 17,808 people and at June 2017 it was estimated to
be 19,850. This growth has mainly been driven by more people moving into
2.05 by 2048
our district than those moving out, as opposed to a natural increase (more
births than deaths) rate. The increase is likely to have occurred in part
because of high national migration, inflated property prices in nearby cities,
and our active economic development programme. The population Estimated 7.4% increase
projections show a steady increase in our population over the next thirty in population in ten years.
years. It is estimated that at 1 June 2018 our population was 20,650 and will
reach 22,300 by 2028. That’s an increase of 7.4% over the ten-year period of
the Long Term Plan.
1 June 2018 ≈ 20,650
By 2048 it is projected that our population will reach 23,695, an increase of
3,045 people from the estimated June 2018 population. Our population by 2028 ≈ 22,300
growth will start to slow after 2028, but is not projected to stop over the next
thirty years. by 2048 ≈ 23,695
Our dwellings
Due to our population growth we’ve seen an increase Additional dwellings over
in the number of building consents for new homes and
more interest in our district’s housing market. Growth
thirty years
in dwelling numbers can be driven by an increase in population and/or a Plains ward + 765
demand for holiday homes. It can also occur if more homes are needed to
house less people per dwelling e.g. because of an ageing population or higher
Paeroa ward + 945
couple separation rates. Waihi ward + 995
Over the thirty years the Paeroa Ward is projected to have 945 additional
dwellings, the Plains Ward 765 and the Waihi Ward 995. The proportion of
occupied dwellings (that means dwellings that are usually lived in and not for
example holiday homes) remains relatively stable, reducing from 88% in Occupied dwellings to
2013 to around 85% in 2048.
reduce from 88% in 2013
to 85% in 2048
6 The projection data in this section was produced by Rationale Limited for the Council.
District Profile | 2a - 6Our rating units 77% of the rating units are
Our district has various types of rating units; residential,
residential lifestyle, rural industry, commercial and
residential and residential
industrial, mineral related and ‘other’. Rating unit lifestyle properties in
growth is driven by the economy, population growth
and other changes in demographics and lifestyle patterns.
2018.
The majority of the projected increase in rating units over the next 30 years
is in the residential and residential lifestyle rating unit categories. This is 80% of the rating units
because the district’s growth in rating units closely follows the growth trend are residential and
in the number of dwellings in the district. In 2018/19 residential and residential lifestyle
residential lifestyle properties are projected to account for 77% of the district
rating units. In 2048/49 80% of the district’s rating units are projected to be properties in 2048
residential and residential lifestyle properties. However, the flow-on effect
from the high population and dwellings growth scenario also results in an
increase in commercial and industrial rating units of approximately 11 units
or 1.4% per year.
District Profile | 2a - 7Our future at a glance
For further information on our district please see the Statistics New Zealand website www.stats.govt.nz or our
Infometrics Community and Economic Profiles on our Business Hauraki web page www.hauraki-dc.govt.nz/business-
hauraki/
District Profile | 2a - 8Our financial and other general
assumptions
In developing this plan, we make assumptions about the future of the activities we provide, assets we hold, issues
that affect us, cost forecasts and our ability to deliver our services. This section sets out the significant forecasting
assumptions we’ve made and associated risks that apply to Council-wide decisions.
We’ve made these assumptions after considering known information and reasonably foreseeable trends and
directions for the 2018-48 period. We haven’t and cannot take into account the effects of international geopolitical
developments that may occur during the life of this plan. Any assumptions that need to be revised/updated as a result
of such developments will be addressed in future annual plans or long term plans.
We’ve noted the level of uncertainty we have with each assumption; either low, medium or high. If the level of
uncertainty is low this means the assumption is almost certain to occur during the life of this plan. A medium level of
uncertainty means the assumption may occur during the life of this plan and a high level of uncertainty means it is not
likely to occur during the life of this plan.
Our financial and other general assumptions | 2b - 1Level of Potential effects of that uncertainty on the financial
Topic Forecasting Assumption Risk
Uncertainty estimates provided
1. Inflation Our forecast financial information includes Medium Inflation is affected by external economic factors. That inflation will be significantly higher
provision for inflation. We have used or lower than forecast.
forecasts of price level changes prepared Our costs and the income required to fund those costs
specifically for the local government sector will change by the difference between the actual rate of
by Business and Economic Research Limited inflation and the rate of inflation used in the forecast.
(BERL) to calculate the inflation rate for each
year of this plan. We have relied on the current parameters the Reserve
Bank is required to operate under in terms of inflation
The BERL forecast inflation rates were set in being held within the range of 1% to 3%.
September 2017 and are listed in Figure 1
below. A 1% increase in inflation would increase annual
expenditure by approximately $380,000 and capital
In year one of this plan there has been no expenditure in 2018/19 by approximately $120,000.
inflation applied to operational costs (with
the exception of salaries). This is considered
appropriate given that the first year budget
has been prepared within six months of
commencement of spend.
The inflation rates used for years 11-30 in the
30-year infrastructure strategy are the
average of the rate used in this plan for that
activity over the next 10 years.
2. Interest Interest on term debt is calculated at 5% over Medium Interest rates are influenced by international economic That the interest rates will be
the ten years. This is our expected cost of factors. We will manage this through interest rate risk significantly different from those in the
borrowing and is based on market interest management instruments authorised in our liability calculations.
rate expectations taking into account the management policy for external debt, and by using
proportion of our debt that is covered by internal borrowing as much as possible.
fixed interest rate instruments.
3. New Zealand The Funding Assistance Rate (FAR) Medium A 1% reduction in the FAR subsidy rate would amount to That the rate of subsidy will be lower
Transport Agency government roading subsidy is forecast to be a reduction in subsidy income of approximately $60,000. than the rates budgeted for.
(NZTA) 60% in 2018/2019 and is forecast to remain at
this level for the following nine years of this
plan. This is based in projections supplied by
NZTA (the government funder of roading).
Our financial and other general assumptions | 2b-2Level of Potential effects of that uncertainty on the financial
Topic Forecasting Assumption Risk
Uncertainty estimates provided
4. Carbon credits It is assumed that we will not have to Medium The Government’s future direction with regard to That we will have to purchase NZUs.
and liabilities purchase carbon emission units (NZUs) under carbon tax and/or carbon credits is unclear. Given that
the New Zealand Emissions Trading Scheme. during the life of this plan there are several election
No budget for the purchase of NZUs has cycles, it can be assumed that the Government’s
been provided. approach to carbon emissions may change.
Furthermore, we assume that we will As there has been no provision for such expenditure, the
continue to replant its forestry lots which requirement to purchase NZUs would likely result in
currently earn NZUs. additional cost to us.
5. Revaluation of It is assumed that the value of our assets will Medium We periodically re-value our assets. This is set out in That the cost of construction/replacing
assets be consistent with the valuations conducted. more detail in our accounting policies and Infrastructure assets will be significantly higher or
Strategy. Land was last re-valued as at 30 June 2016. lower than forecast by the valuations.
Buildings and utility assets were last re-valued as at 1
July 2017. Roading assets were last re-valued as at 30
June 2017. The projections provide for changes in asset
valuations every three years based on capital works,
retired assets and the amount of inflation over that
period of time.
The value of our assets and subsequent depreciation
expense may change as a result of changes in valuation
methodologies or cost changes being significantly
different to those projected. This could lead to an
increase in rates.
6. Vested assets, We have forecast that we will receive a Low Vested assets can fluctuate considerably from year to That we will have more assets vested
being the assets minimal, but certain level of vested assets. year but the impact is ordinarily offset by a thereby increasing the depreciation
the Council We also assume that the impact of vested proportionate increase in rates revenue. It is highly expense in subsequent years that is not
receives and assets will be neutral, in that the costs unusual that we would enter into an arrangement with a offset by a proportionate increase in
becomes associated with the additional assets will be developer where the ongoing costs associated with the rates revenue.
responsible for. offset by a proportionate increase in rates vested assets are disproportionate to the increase in
revenue. rates revenue.
7. Funding sources Sources of funds will be obtained as detailed Low There is little risk that sources of funds will not be That we will not be able to fund our
in our revenue and financing policy. The achieved given our ability to levy rates. The main risk planned work programme.
policy also includes the sources of funds for concerns capital expenditure, as that is primarily funded
future replacement of significant assets, and through borrowing. If we aren’t able to borrow to the
both operational and capital expenditure (the levels forecast than this could affect the timing or
viability of our capital works programme.
Our financial and other general assumptions | 2b-3Level of Potential effects of that uncertainty on the financial
Topic Forecasting Assumption Risk
Uncertainty estimates provided
latter of which is primarily through
borrowing).
The Local Government Funding Agency will Low A significant amount of the capital funding is sourced That the Local Government Funding
continue to be able to raise funds from from overseas capital markets. There is a risk that access Agency no longer has access to capital
capital markets providing us access to more to these markets may become restricted. markets.
favourable loan funding.
The financial effect of the Local Government Funding
Agency not being able to access capital markets would
be less favourable loan options being available to us.
8. Capital On average, costs of major capital works will Medium in We have a higher level of confidence regarding the costs That some capital project costs are
expenditure not vary significantly from costs estimated at years one to of capital projects in the short-term but less certainty in greater or lesser than estimated
the concept stage, subject to general three of this the longer term. This is due to possible fluctuations in resulting in increased or reduced debt
inflation trends. plan but higher the economy, growth patterns, regulatory levels from those forecast.
further out. requirements, etc.
9. Asset Life It is assumed the useful lives of our assets as Medium If an asset were to fail or wear out significantly earlier Asset life is based upon estimates by
recorded in our asset management plans than its estimated life capital projects could be brought actual performance, industry standards
approximate reality. forward which would affect interest costs. Depreciation and valuers and is considered
expense may also increase. reasonably accurate. However, we are in
the process of improving our level and
accuracy of asset data for core
infrastructure recognising the current
information could be improved.
10. Development We will implement either our financial Low Revenue from financial contributions will be considered Over the next three years our District
contribution contributions policy or introduce a new on a case by case basis. Revenue from development experiences considerable growth and
and/or financial development contribution policy in the life of contributions has not been included as part of this long we do not have a financial policy that
contribution this Plan. term planning process. This would change if we decide allows for the funding of infrastructure
revenue to introduce the development contributions policy caused by growth.
within the next three years.
11. Infrastructure We have sufficient insurance to replace our Medium We manage the financial risk associated with natural The level of financial assistance that the
insurance infrastructure assets in the event of a disasters through the provision of insurance up to the Government provides to local
disaster. current replacement value. Central government authorities after a natural disaster is
currently covers anything above this amount. currently being reviewed.
A discussion paper is on hold until after
the national elections but more
Our financial and other general assumptions | 2b-4Level of Potential effects of that uncertainty on the financial
Topic Forecasting Assumption Risk
Uncertainty estimates provided
certainty is expected to be provided
while this plan is developed.
12. Population Population growth has been higher than Medium Should the population be less than expected this may There is a chance the population growth
growth anticipated in the previous three years driven have an effect on our income if this trend is coupled with projected in this plan may be lower than
predominantly by higher than expected net less rating units than projected. The financial effect anticipated. This could occur due to
migration (more people moving into our would likely mean a rise in rates due to a smaller number lower than forecast net migration or a
district than leaving). of rateable properties. lower than anticipated birth rate and
At 1 June 2018, it is projected the usually higher death rate.
resident population of the Hauraki District
will be 20,650. There is less risk that we will experience
It is projected our population will reach more growth than projected because
22,300 by 2028. That is an increase of 1,650 the net migration underpinning the
people, or a population increase of 7.4% over population projections is already
the ten-year period of this plan. The average optimistic when compared to historic
annual increase is 165 people or 0.7% growth trends.
per annum.
By 2048 (the thirty-year period of the
Infrastructure Strategy), it is projected that
the usually resident population will reach
23,695, which is an increase of 3,045 people
from the estimated June 2018 population. In
years 11-30 of our infrastructure strategy, the
population increases by an average of 70
people per year, or 0.3% per annum.
13. Household size The average household size (number of Low If the rate of household size declines faster than The decrease in household size occurs
people living in a house) has decreased from anticipated, this could result in more infrastructure costs sooner than expected or is greater than
2.5 persons in 2006 to 2.29 persons in 2018. if additional dwellings are required. However, the extra expected. This would be driven
This trend is projected to continue and costs would likely be off-set by additional rating units. predominantly by an aging population
further decrease to 2.24 persons by 2028. where it is more likely elderly people will
The average household size is projected to With less people living in each dwelling rates be living in single person households. An
continue to decline to 2.05 persons per affordability could become an issue. increase in single parent families can
household by 2048. also contribute to a declining household
size.
Our financial and other general assumptions | 2b-5Level of Potential effects of that uncertainty on the financial
Topic Forecasting Assumption Risk
Uncertainty estimates provided
14. Demographic age By 2018 it is estimated that 24% of the Low The main financial effect would likely be on rates Aging population trends continue to be
distribution for population of our district will be aged 65+ affordability. forecast by Statistics New Zealand for
our District years. Our district is likely to have an the provinces of New Zealand. There is a
increasingly ageing population with 30% of risk the age distribution of our district
the population aged 65+ by 2028 and 38% could be older than projected if a
aged 65+ by 2048. greater number of people aged 65+, and
fewer families with children, move here
The table below shows previous and than anticipated.
projected age-distribution:
There is less risk the age distribution will
Age 2006 2018 2028 2048 be younger than anticipated as the net
migration underpinning the population
0-14 22% 19% 19% 17%
projections is already optimistic when
15-39 26% 25% 22% 18% compared to historic trends.
40-64 35% 32% 29% 27%
65+ 17% 24% 30% 38%
15. Rating Unit In 2016/17 our district had 10,895 rating units Medium The main financial impacts are increased/decreased rate Rating unit growth is driven by the
Growth and it is estimated to have 11,452 rating units funding from rating units. If rating unit growth is less economy, population growth and other
by 2018/19. Over the ten-year period of this than that projected there may be a period where the changes in demographics and lifestyle
plan it is projected that the number of costs associated with certain infrastructure capital patterns.
rateable units will increase by an average of expenditure needs to be meet by less projected rateable
112 per annum, reaching 12,576 by 2028/29. units. Higher than projected rateable units could put There is a risk that the growth in the
pressure on the provision of certain infrastructure. number of rating units will be less than
The total number of rating units has been what is forecast, particularly if our
forecast for each year of this plan as follows: district experiences less population
growth than expected. This is because
2018/19 11,452 2023/24 12,132 the growth in rating units closely follows
the growth trend in the number of
2019/20 11,588 2024/25 12,243
dwellings in our district. In 2018/19
2020/21 11,724 2025/26 12,354 residential and residential lifestyle
properties account for 77% rating units
2021/22 11,860 2026/27 12,465
in our district. In 2048/49 80% of the
2022/23 11,996 2028/29 12,576 rating units are projected to be
Our financial and other general assumptions | 2b-6Level of Potential effects of that uncertainty on the financial
Topic Forecasting Assumption Risk
Uncertainty estimates provided
By 2048 it is projected that the number of residential and residential lifestyle
rating units in our district will reach 14,492. properties.
This is an average annual increase of 96
rating units per year in years 11-30 of our
infrastructure strategy.
16. Dwelling A growth in dwelling numbers can be driven Medium If growth in dwelling numbers is less than projected The growth in the number of dwellings
forecasts by an increase in population and/or a demand there may be a period where there are less connections will be less than projected, particularly if
for holiday homes. It can also occur if more to our services and less properties paying for the costs our district experiences less population
homes are needed to house less people per associated with providing those services and associated growth than expected.
dwelling e.g. because of an aging population infrastructure.
or higher couple separation rates. There is less risk that we will experience
By June 2016 the Hauraki District had 9,715 Higher than projected dwelling numbers could put higher growth in dwelling numbers than
dwellings. It is projected to have 10,320 pressure on the provision of certain infrastructure. projected when compared with our
dwellings by 2018/19. historical trends. From 2001 – 2016 our
Over the ten-year period of this plan it is district had on average 85 new
projected that the number of dwellings will residential dwellings per year.
increase by an average of 114 dwellings per
annum, reaching 11,457 by 2028/29.
It is projected that our district will have
13,024 dwellings by 2048/49. That is an
average increase of 78 dwellings per year in
years 11-30 of the Infrastructure Strategy.
17. Costs associated Services will continue to be delivered at the Medium External influences may impact on the forecast costs of That the service may not be able to be
with provision of forecast costs in this plan. the service levels in this plan. For example, inflation, delivered in the same manner, which
services legislative changes, a skilled labour shortage. could impact the cost of providing the
Alternatively, a more efficient method of delivering the same level of service.
same level of service may be implemented.
That costs are increased significantly by
If the cost to provide the forecast levels of service was to commodity prices or economic
change significantly then we would review the timing conditions putting costs above the
and amount of work programmed and undertaken. The forecast level of inflation.
financial effect is difficult to predict.
18. Range and nature Our current range and nature of services will Medium Since the 1989 reforms, councils have been required to That central government will allocate
of services remain unchanged from those detailed in this undertake additional services, some of which had responsibility for additional services to
plan and other assumptions. previously been the responsibility of central local government, and/or the Waikato
government. In recent times central government has Regional Council will allocate
been handing more social responsibility issues to responsibility for additional services or
Our financial and other general assumptions | 2b-7Level of Potential effects of that uncertainty on the financial
Topic Forecasting Assumption Risk
Uncertainty estimates provided
councils; for example; gambling, psychoactive standards to local government in the
substances, and alcohol policies. This is expected to be a Waikato Region that requires immediate
trend that continues. addressing and affects our capacity to
deliver.
The financial effect of these types of central government
requirements are hard to determine in advance, but
could be significant in terms of affecting our capacity to
deliver our services.
We usually have some lead in time to implement new
services in which case the implications for financial
estimates and our capacity to continue delivering
services can be identified and considered through an
annual planning, long term planning or long term plan
amendment process. We also use that process to
consider and respond to community-driven demand for
changes to services.
19. Resource Changes to the Resource Management Act Medium There would be time and cost implications for having to More/less changes could be required to
Management Act and central government policy will continue, carry out reviews of the district plan in terms of staff our resource management planning
reform requiring changes to our own policy including time/cost, public consultation, and administration documents and processes than
the district plan. support. The time and cost will depend on the number budgeted for.
and complexity of changes required.
20. Resource That the conditions of infrastructure resource Low This low level of uncertainty means that we have Additional new or revised legislation,
consents for consents held by us will be altered over time (discharges) confidence in the need to allocate financial resources for national policy statements, national
water discharges due to increasing water discharge quality meeting new consent conditions. Changes to environmental standards and regional
and takes standards and also because of possible wastewater discharge consent standards will result in plan changes (the development of the
increased competition for the allocation of the need for the upgrading of our wastewater treatment healthy rivers plan change programme)
water. plants, other requirements may result in the need for will require changes to activities and
more of our infrastructure to be upgraded to meet service levels not provided for in this
The Waikato Regional Council has advised higher standards. Upgrades to stormwater treatment plan. Unless otherwise noted, we do not
that water bodies in our district are already before discharge may also be required. The increase in know what changes will be initiated, and
close to over allocation and that it will be financial resources needed will impact on the Council’s of those that we do, what the changes
more difficult to obtain new resource ability to continue providing services within existing will involve.
consents required for water takes to allow for budget levels. There remains a level of uncertainty of
future growth. The potential implications the quantum and timing of some infrastructure spent. That conditions of resource consents
require higher compliance standards
Our financial and other general assumptions | 2b-8Level of Potential effects of that uncertainty on the financial
Topic Forecasting Assumption Risk
Uncertainty estimates provided
resulting from changes to allocation of water requiring the development of additional
to our district could include: infrastructure.
the amount of water we can take, Medium The financial effects of over allocation of water bodies That new water take resource consents
our ability to accommodate population (Takes) may be significant and require upgrades and/or new will be more difficult to obtain.
and industrial growth, water treatment facilities, however the potential costs
additional requirements for monitoring cannot be forecast. Additional affects could be the
and management of water allocations. potential to restrict development due to the inability to
gain additional water allocation.
21. Operating There will be no significant changes to our Medium Due to climatic variation and unforeseen natural That there will be event(s), e.g. natural
environment operating environment which have not disasters there is an increased chance of events disasters and/or legislative reform that
already been planned for. changing the operating environment in our district. significantly affect our ability to operate
However, we have faced unexpected events in the past, or change the operating environment.
and coped adequately. There are risk management plans
in place for some activities and an operative emergency
management plan.
Legislative reform is covered in a separate assumption
but can potentially cause significant changes to our
operating environment and budgets.
Medium Assets are unlikely to be lost other than through planned That there will be significant asset
end of life renewal. Therefore, the financial effect is losses.
difficult to predict, but we do carry comprehensive
insurance cover on infrastructural and community assets
(refer also to insurance assumption).
22. Waihou and The Hauraki Collective Treaty Settlement Low We will need to make additional funding commitments That the Settlement Deed does not
Piako River Deed will include provision for a co- to allow us to work with post settlement governance provide for these entities.
catchments post- governance entity responsible for developing bodies and shared responsibilities.
Treaty a strategic vision and direction for natural
settlement co- resource issues in the Waihou and Piako River We may need to make additional funding commitments That the Treaty Settlement provides for
governance catchments and the Coromandel Medium to meet additional policy/service delivery costs over a more wide ranging role for this co-
entity catchments. time. governance entity.
23. Hauraki collective These settlements will identify areas of land Low We will need to note and map these areas of land, That the Treaty settlements provide for
and individual that have particular cultural, spiritual, include the reasons for the associations and update more specific requirements.
Hauraki Iwi historical and traditional association for iwi
Our financial and other general assumptions | 2b-9Level of Potential effects of that uncertainty on the financial
Topic Forecasting Assumption Risk
Uncertainty estimates provided
Treaty and that the settlement legislation will policy protocols and consenting processes and
settlements require policy makers and consent authorities procedures.
to acknowledge these associations
and provide input from those affected iwi.
24. Asset information Performance data for assets is assumed to be Medium The forecast financial information is based on current Asset data results over-estimate or
accurate. asset management plan information. When any new under-estimate the need for renewal or
information comes to hand, forecast financial replacement and its cost.
information will be changed. The net effect overall may
not be significant.
25. Land use There is land zoned to cater for the Medium If projected residential growth does not eventuate due If we experience more population
forecasted residential property growth in our to shortage in zoned land availability and uptake, we will growth in certain areas than planned for,
district, however that land is not being made have less connections to our services and less revenue in there may not be sufficient land zoned
available now to meet the demand. Further the short term. in that particular area.
residential areas are being investigated in
Paeroa and Waihi to support sufficient land We are not yet certain on when uptake of land zoned for
being made available. development will occur and therefore when
infrastructure investment will be needed. Our financial
forecasts would change if we do not have adequate
financial or development contributions to fund this
investment.
In some areas of the district there is Low If projected industrial and commercial growth does not Economic growth and industrial growth
insufficient land zoned to accommodate eventuate due to shortage in zoned land availability and slows, resulting in less or delayed
industrial and/or commercial growth. Further uptake, we will have less connections to our services and demand for industrial and commercial
work is required to ascertain viable options to less revenue in the short term. land.
cater for growth into the future.
Alternatively, private land is zoned as
industrial or commercial use but the
owner/s do not want to subdivide and
sell it meaning we do not have capacity
for future growth.
26. Natural disaster There are no significant local natural Medium It is likely any significant natural disaster would have That a natural disaster occurs that has
events disasters during the term of this plan. impacts on the current planned expenditure within this significant impact on our infrastructure
plan. It is difficult to predict the likely financial impact of and our ability to deliver services. There
a significant natural disaster; however, we are a member are adverse effects on the population
Our financial and other general assumptions | 2b-10Level of Potential effects of that uncertainty on the financial
Topic Forecasting Assumption Risk
Uncertainty estimates provided
The district is classified as a medium risk area of the Local Authority Protection Programme Disaster and/or local economy from the adverse
for earthquakes, as outlined in the Building Fund (LAPP) which is a cash accumulation mutual pool effects of a natural disaster.
Act 2004. Therefore, there is a medium risk created by local authorities to cater for the replacement
of an earthquake affecting our district. In of underground infrastructure following catastrophic
extreme weather events there is also a risk damage by natural disaster. We also receive a large
that rainfall events and stopbank subsidy on our road and bridges.
overtopping will result in flooding and
inundation of land/property and our
infrastructure. Currently it is believed there is
a low risk that a tsunami event/tidal surge will
directly affect the coastline around the Firth
of Thames and/or Whiritoa. New tsunami
modelling is being undertaken for the Firth of
Thames.
27. Climate Change Climate change will affect our district over Medium MfE bases its climate predictions on the latest climatic That predictions on climate change as
the medium to long term in line with projections from the IPCC. In turn, the Waikato Regional provided by the International Panel on
projections provided by the Ministry for the Council has applied these predictions to their own Climate Change, the MfE and the WRC
Environment (MfE). These projections calculations. The Waikato Regional Policy Statement are over or under estimated.
include: requires our district plan to give effect to them.
1. An increase in the frequency and That the impacts of climate change for
intensity of storm events. We are increasingly design our infrastructure taking into Council activities will be more significant
2. Higher temperatures. account climate change projections and the risk of than planned for.
3. Rising sea level – for planning purposes increased climate change related weather events.
the Waikato Regional Council (WRC) has Where the impacts of climate change have a potential
recommended a 0.8m rise over the next implication for our services, options for adaptation will
100 years relative to the 1980-1999 be identified and a planned programme will be
average. The final estimate from MfE is prepared. More expenditure may be required to
awaited. maintain current levels of service as a result. At this
4. A change in rainfall patterns producing stage the financial implications of adapting to the
more extreme weather events and an effects of climate change are uncertain they will be
increase in drought events. refined in subsequent plans as investigations are
progressed.
We are required to factor these forecasts into
decision-making and will need to do so on a
continuing basis as forecasts change.
Our financial and other general assumptions | 2b-11Figure 1: BERL Forecast Inflation Adjustors % per annum change
PPI Inputs – LCI – All
PPI Inputs PPI Inputs water, CGI – salary and
Planning & Community Local Arts and sewer, Earthmoving CGI - wage rates Private Sector
Year Ending Roading Transport
Regulation Activities Government recreation drainage, and site Pipelines – Local Wages
administration services and waste work government
services sector
June 2019 0.0 0.0 0.0 0.0 0.0 0.0 0.0 0.0 0.0 1.6 0.0
June 2020 2.1 2.2 2.0 2.0 2.0 1.9 2.8 2.3 2.7 1.6 1.9
June 2021 2.1 2.2 2.1 2.1 2.0 1.9 2.4 2.4 2.5 1.7 1.8
June 2022 2.1 2.3 2.2 2.1 2.1 1.9 2.5 2.4 2.4 1.8 1.6
June 2023 2.2 2.4 2.2 2.2 2.2 2.0 2.6 2.5 2.4 1.8 1.7
June 2024 2.3 2.4 2.3 2.3 2.3 2.0 2.7 2.6 2.4 1.9 1.8
June 2025 2.3 2.5 2.4 2.3 2.3 2.1 2.8 2.7 2.4 1.9 1.8
June 2026 2.4 2.6 2.5 2.4 2.4 2.1 2.9 2.8 2.4 2.0 1.9
June 2027 2.4 2.7 2.5 2.4 2.5 2.1 3.0 2.9 2.4 2.0 1.9
June 2028 2.5 2.8 2.7 2.6 2.5 2.2 3.2 3.1 2.4 2.1 2.0
Our financial and other general assumptions | 2b-12You can also read