New estimates for the sublimation rate for ice on the Moon
←
→
Page content transcription
If your browser does not render page correctly, please read the page content below
Icarus 186 (2007) 24–30
                                                                                                                        www.elsevier.com/locate/icarus

                  New estimates for the sublimation rate for ice on the Moon
                                                               Edgar L Andreas ∗
                        U.S. Army Cold Regions Research and Engineering Laboratory, 72 Lyme Road, Hanover, NH 03755-1290, USA
                                                        Received 6 April 2006; revised 18 August 2006
                                                              Available online 27 October 2006

Abstract
   The strong hydrogen signal that the Lunar Prospector saw at the Moon’s poles suggests that water ice may be present near the surface of the
lunar regolith. A robotic mission to obtain in situ samples and to quantify the amount of this valuable resource must be designed carefully to avoid
dissipating too much heat in the regolith during coring or drilling and, thus, causing the ice to sublimate before it is processed. Here I use new
results for the saturation vapor pressure of water ice to extend previous estimates of its sublimation rate down to a temperature of 40 K, typical of
the permanently shaded craters near the lunar poles where the water ice is presumed to be trapped. I find that, for temperatures below 70 K, the
sublimation rate of an exposed ice surface is much less than one molecule of water vapor lost per square centimeter of surface per hour. But even
if a small ice sample (∼4 ng) were heated to 150 K, it could exist for over two hours without sublimating a significant fraction of its mass. Hence,
carefully designed sampling and sample handling should be able to preserve water ice obtained near the lunar poles for an accurate measurement
of its in situ concentration.
Published by Elsevier Inc.
Keywords: Ices; Meteorology; Moon; Moon, surface; Regoliths

1. Introduction                                                                  Carruba and Coradini, 1999). In fact, the neutron spectrometer
                                                                                 on the Lunar Prospector showed the highest concentration of
    The existence of water on the Moon has been debated for                      hydrogen to be within a few degrees of the lunar poles (Feldman
well over a hundred years (e.g., Coakley, 1885). There are at                    et al., 2001). Though this hydrogen signal may not have resulted
least three explanations for its origin (e.g., DesMarais et al.,                 from water ice (e.g., Eshleman and Parks, 1999; Starukhina and
1974; Arnold, 1979): The water could be primordial, existing                     Shkuratov, 2000; Campbell and Campbell, 2006), it still pro-
since the Moon formed and now trapped in the regolith; it could                  vides tantalizing motivation for mounting a robotic mission to
be deposited when icy comets strike the Moon; or it could form                   the lunar poles to seek the source of the signal (Nozette et al.,
when solar-wind protons interact with oxygen in the minerals                     2001).
near the Moon’s surface.                                                             Such robotic exploration could include drilling, coring, or
    When sunlit, for latitudes between 75◦ north and 75◦ south,                  other excavating that might dissipate heat in the regolith being
the surface of the Moon and even depths down to a meter or                       sampled (cf. Taylor et al., 2006). The ice could thus conceivably
more heat to temperatures at which water ice will sublimate                      be warmed enough to sublimate in the near-vacuum conditions
and, thus, disappear quickly on a geological time scale (Watson                  on the surface of the Moon before its concentration is deter-
et al., 1961; Hodges, 1973; Vasavada et al., 1999). Current the-                 mined. To set bounds on the kind of processing that a regolith
ories therefore suggest that any near-surface water on the Moon                  sample can endure without losing a significant fraction of its
will be trapped as ice deposits in permanently shaded craters                    water ice, I make new estimates for the sublimation rate of ice at
near the lunar poles, where temperatures may be as low as                        lunar temperatures. Earlier studies of ice on the Moon had like-
40 K (Watson et al., 1961; Arnold, 1979; Vasavada et al., 1999;                  wise estimated its sublimation rate; but Watson et al. (1961) and
                                                                                 Vasavada et al. (1999), for example, considered temperatures
 * Fax: +1 603 646 4644.                                                         down only to 100 K. The shaded polar craters, however, have
   E-mail address: eandreas@crrel.usace.army.mil.                                temperatures estimated to always be about 40 K (Arnold, 1979;
0019-1035/$ – see front matter Published by Elsevier Inc.
doi:10.1016/j.icarus.2006.08.024
Sublimation of ice on the Moon 25
Table 1
Nomenclature and constants used in the manuscript
er Saturation vapor pressure of a pure water ice surface with radius of curvature r [see Eq. (6)]
esat,i Saturation vapor pressure over a planar surface of pure water ice [see Eqs. (2)–(4)]
Lv Latent heat of sublimation of water ice
Mw (= 18.015 × 10⁻³ kg mol−1 ) Molecular weight of water
m Mass of a water ice sample [see Eq. (8)]
m0 Initial mass of a water ice sample before any sublimation
r Radius of curvature of a small water ice deposit
R (= 8.31447 J mol−1 K−1 ) Universal gas constant
rc Radius of curvature at which the sublimation rate for an ice sample is e times the sublimation rate for a planar ice surface [see Eq. (12)]
r0 Initial radius of a spherical water ice deposit
Sr For a water ice sample, the sublimation rate at a surface with radius of curvature r [see Eq. (10)]
S0 Sublimation rate for a planar surface of pure water ice [see Eq. (1)]
t Time
T Temperature in kelvins
αm Mass accommodation coefficient
ρi Density of pure water ice [see Eq. (7)]
σi (= 0.109 J m−2 ) Surface tension of a pure ice/vapor interface
Vasavada et al., 1999; Carruba and Coradini, 1999). I therefore 3. Vapor pressure of ice
update estimates of ice sublimation as a function of temperature
using a recently developed formulation for the vapor pressure of
Using Eq. (1) to estimate the sublimation rate as a func-
water ice at low temperature. I also discuss how the sublimation
tion of temperature is straightforward if we know the saturation
rate will change if the ice is “dirty”—contaminated with other
vapor pressure of ice, esat,i , as a function of temperature. The
molecules—or if microscopic ice deposits have highly curved
availability of new data and a new expression for esat,i from
surfaces.
Murphy and Koop (2005) ultimately motivated this study.
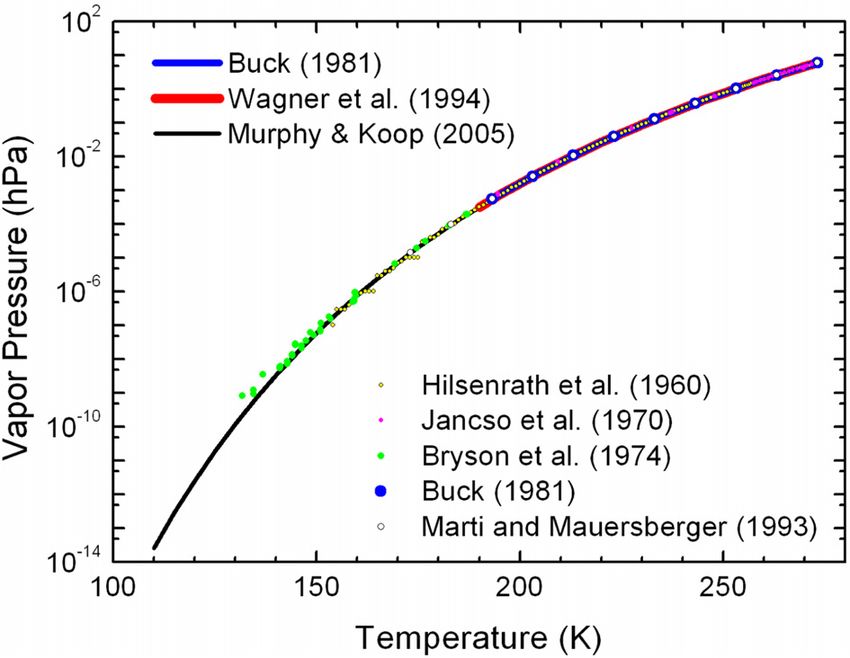
Fig. 1 summarizes our current understanding of the satura-
2. Sublimation rate of ice tion vapor pressure over a planar surface of pure water ice. It
shows five sets of measurements or reference values for the
Estermann (1955; also Bohren and Albrecht, 1998, p. 187f.) saturation vapor pressure and three expressions for esat,i . In
derives the standard equation for the evaporation or sublimation particular, the measurements from Bryson et al. (1974) extend
rate from a planar surface of pure water or ice in a vacuum. The down to almost 131 K.
derivation relies on geometrical considerations, the ideal gas At temperatures above 170 K, the five data sets are nearly
law, and the Maxwell–Boltzmann distribution for the speed of indistinguishable and, thus, provide good constraints on the
free gas molecules (e.g., Bohren and Albrecht, 1998, p. 60ff.). esat,i functions here. At lower temperatures, the values from
The resulting sublimation rate for water ice is Hilsenrath et al. (1960) show some dispersion; and at even
lower temperatures, the data from Bryson et al. (1974) tend to
Mw 1/2
S0 = esat,i (T ) . (1) drift above the curve obtained by Murphy and Koop (2005).
2πRT Murphy and Koop (2005), however, speculate that, rather
Here, S0 is a mass flux; its units are kg m−2 s−1 . Subscript 0 than observing hexagonal ice, as everybody else did, Bryson
denotes sublimation from a planar surface. Also, esat,i (T ) is the et al. (1974) may have been observing cubic or amorphous ice,
saturation vapor pressure (in pascals) for a planar ice surface which is known to be deposited from water vapor at the low
at temperature T (in kelvins), Mw is the molecular weight of range of the temperatures they studied (Hobbs, 1974, p. 44ff.).
water, and R is the universal gas constant. Table 1 collects the Had Bryson et al. allowed their samples time to anneal, the
definitions of the symbols used in Eq. (1) and elsewhere in the samples would have converted to hexagonal ice. Coincidentally,
manuscript. I infer that Vasavada et al. (1999) used the Bryson et al. data to
Equation (1) implicitly assumes that the so-called mass ac- make their estimates of sublimation rate on the Moon at 100 K.
commodation coefficient αm (Hobbs, 1974, p. 441; Bohren and Consequently, with vapor pressure biased high, their sublima-
Albrecht, 1998, p. 187f.) is one (e.g., Bryson et al., 1974). That tion rates will also be biased high.
is, from a geometrical perspective, if the volatile surface is hor- The first function in Fig. 1 is from Buck (1981), who gives
izontal, all gas molecules striking the surface from above stick
to it; the up-going flux of molecules thus results strictly from 22.542(T − 273.15)
esat,i = 6.1115 exp (2)
evaporation or sublimation—not from the reflection of down- 273.48 + (T − 273.15)
going molecules. If αm were not one, on the other hand, the
actual sublimation rate would be αm S0 . Hence, Eq. (1) gives for T in the range [193.15, 273.15 K]. The second function is
the maximum potential sublimation rate because 0 αm 1. from Wagner et al. (1994), who give26 E. L Andreas / Icarus 186 (2007) 24–30
Fig. 1. Measurements or reference data for the saturation vapor pressure over a planar surface of pure water ice from Hilsenrath et al. (1960), Jancso et al. (1970),
Bryson et al. (1974), Buck (1981), and Marti and Mauersberger (1993). The functional expressions for esat,i are from Buck (1981), Wagner et al. (1994), and
Murphy and Koop (2005) and are given in Eqs. (2)–(4). The Murphy and Koop curve is under the Buck and Wagner et al. curves in the region where they all overlap.
−1.5
T derived expressions for esat,i (T ) are well constrained by the
esat,i = 6.11657 exp −13.9281690 1 −
273.16 constants Mw and R and by evaluations of Lv (T ).
−1.25 I will tend to focus on Murphy and Koop’s (2005) new ex-
T pression for esat,i (T ) because it extends to the lowest tempera-
+ 34.7078238 1 − (3)
273.16 ture and adequately represents the existing data down to 140 K.
Although Murphy and Koop state that Eq. (4) is good for tem-
for T in [190, 273.16 K]. Recent editions of the Handbook of peratures above 110 K, they obtained Lv (T ) for use in (5) by
Chemistry and Physics (Lide, 2001, p. 6-9), for example, base integrating data for the specific heat of ice at constant pressure
their tabulations for the vapor pressure of ice on Eq. (3). The that spanned 20–273 K. Therefore, because Murphy and Koop’s
final function in Fig. 1 is from Murphy and Koop (2005), who esat,i expression is well constrained by both thermodynamics
give and data, I have some justification for extrapolating it down to
40 K, which I do in the next section. But I also extrapolate both
5723.265
esat,i = 0.01 exp 9.550426 − the Buck (1981) and Wagner et al. (1994) results down to 40 K
T
to see if the three expressions provide any consensus as to the
+ 3.53068 ln T − 0.00728332T (4) low-temperature sublimation rate of ice. Again, my justification
for these extrapolations is that the Buck and Wagner et al. re-
for T in [110, 273.15 K]. In each of these equations, esat,i is in lations are also theoretically based and thus largely constrained
hPa, and T must be in kelvins. by thermodynamics.
Fig. 1 shows that, in the temperature range where these three
equations overlap, they are indistinguishable on the scale of the 4. Results
plot. This agreement is not surprising. All expressions that I
know for the saturation vapor pressure for a planar ice surface as Using Eqs. (2)–(4) for esat,i in Eq. (1), I can make three
a function of temperature derive from the Clausius–Clapeyron distinct estimates for the sublimation rate of water ice for tem-
equation (e.g., Bohren and Albrecht, 1998, p. 192ff.). For an ice peratures typical of shaded craters near the lunar poles. Fig. 2
surface, this equation is shows the results of those calculations. The left axis gives the
sublimation rate down to 40 K as a mass flux; units here are
d ln[esat,i (T )] Mw Lv (T )
= , (5) micrograms of ice lost per square centimeter of exposed ice
dT RT 2 per hour. The right axis in Fig. 2 gives the sublimation rate
where Lv (T ) is the latent heat of sublimation of pure water ice in terms of water vapor molecules escaping from the ice per
as a function of temperature. As a result, most independently square centimeter of its exposed surface per hour.Sublimation of ice on the Moon 27
Fig. 2. The sublimation rate for a planar surface of pure ice calculated using the expressions from Buck (1981), Wagner et al. (1994), and Murphy and Koop (2005)
for esat,i in Eq. (1). The left axis gives the sublimation rate as a mass flux; its units are µg cm−2 h−1 . The right axis gives the sublimation rate as the number of
molecules of water vapor leaving a square centimeter of the ice surface per hour. The arrow shows where the sublimation rate is only 1 molecule cm−2 h−1 .
For temperatures down to about 80 K, the three estimates of 5. Other effects on sublimation rate
sublimation rate in Fig. 2 are indistinguishable on the scale of
this plot. Notice, to make estimates at 80 K, I extrapolated both 5.1. Contamination
the Buck (1981) and Wagner et al. (1994) expressions down-
ward over 100 K. The consistency among the three estimates
Ice deposits on the Moon might be “dirty”—for example,
at this point is good evidence that the functional forms used in
mixed with regolith dust, carbon dioxide, or some other con-
Eqs. (2)–(4) are well guided by theory and data.
Below 80 K, estimates for sublimation rate based on Buck’s taminant (Nozette et al., 2001). Any such contaminants will
(1981) and Murphy and Koop’s (2005) expressions for the sat- lower the saturation vapor pressure of the ice and, consequently,
uration vapor pressure are still quite close despite the large slow its sublimation rate. A simple thought experiment demon-
temperature range over which I have extrapolated them. The strates this effect. If ice is mixed with other molecules, some of
sublimation rate based on Wagner et al. (1994) is about seven these molecules must be at the surface of the sample and have,
orders of magnitude above these other two at 40 K. Neverthe- thus, displaced ice molecules here. The vapor pressure of the
less, by this point, I predict the sublimation rate to be so small ice must consequently be less than for a pure sample by a frac-
that even such seemingly large discrepancies are negligible for tion reflecting the surface area of the ice and the surface area of
estimating the mass loss for water ice during sampling of the the contaminants on the sublimating surface.
lunar regolith. This lowering of the vapor pressure in a contaminated sam-
The right axis in Fig. 2 tries to put this assessment in per- ple is essentially Raoult’s law if the ice and the contaminant are
spective. It shows that, at about 70 K, the sublimation rate is miscible (Bohren, 1987, p. 22f.; Bohren and Albrecht, 1998,
one molecule of water vapor per square centimeter per hour for p. 230ff.). If the ice and the contaminant are not miscible—for
all three curves. And the sublimation rate decreases by 25–30 example, if the contaminant is regolith dust—we can still esti-
orders of magnitude as the temperature decreases from 70 to mate the lowering of the vapor pressure by using geometry to
40 K. Hence, if a robotic or human explorer were to drill or ex- evaluate what fraction of the exposed surface is dust.
cavate a regolith sample that is originally near 40 K, essentially Because we know neither the size of lunar water ice deposits
no water ice will be lost if the sample is not heated by more nor the composition or concentration of possible contaminants,
than, say, 100 K and if the ice concentration can be measured I see little value in speculating here how much such contami-
within an hour of freeing the sample. Fig. 2 also allows evalu- nants might lower the sublimation rate of ice. Suffice it to say
ating other sampling and handling scenarios. Section 6 further that any contamination lowers the already miniscule sublima-
quantifies this assessment. tion rate of ice near the lunar poles.28 E. L Andreas / Icarus 186 (2007) 24–30
5.2. Surface curvature concave surface, the vapor pressure is lower than over a planar
surface.
If ice on the Moon does not occur in massive blocks de- According to Fig. 3, concave curvature lowers the vapor
posited by comets—and no good evidence exists that it does pressure by less than 2% for the smallest ice deposits we would
(e.g., Stacy et al., 1997; Campbell and Campbell, 2006)—it still likely find in the shaded lunar craters. Convex curvature, on
may occur in small quantities attached to regolith grains. In this the other hand, raises the vapor pressure for these smallest de-
case, the curvature of the ice surface could affect its sublima- posits by less than 2%. Consequently, sublimation rates will
tion rate. The Kelvin equation describes this effect (Pruppacher either decrease or increase accordingly. The magnitude of these
and Klett, 1997, p. 170; Bohren and Albrecht, 1998, p. 240ff.), curvature effects decreases rapidly with increasing radius of
curvature, however; it is practically zero for radii of 100 µm
er 2Mw σi
= exp . (6) and larger.
esat,i ρi rRT
Here, esat,i is again the saturation vapor pressure of a pure, pla- 6. Mass loss during sublimation
nar water ice surface, as calculated with Eqs. (2)–(4); er is the
vapor pressure of a curved ice surface with radius of curva- No evidence has appeared to suggest that water ice at
ture r; σi is the surface tension of a pure ice/vapor interface; and the lunar poles occurs in massive deposits. In fact, the rel-
ρi is the density of the water ice. Two situations are possible. If evant evidence discounts the possibility of massive deposits
the ice coats a regolith grain and thus has a convex surface, r is (Stacy et al., 1997; Margot et al., 1999; Campbell et al., 2003;
positive and the vapor pressure is increased. If the ice joins two Campbell and Campbell, 2006). Therefore, I suspect that any
grains or otherwise has a concave surface, r is negative and the lunar ice deposits are very small. Furthermore, any robotic sam-
vapor pressure is reduced. pler of water ice must work with very small samples simply
Fig. 3 shows some examples of how surface curvature could because of mission weight limitations. Consequently, in esti-
affect the vapor pressure of microscopic ice deposits on re- mating how sublimation will alter measurements of water ice
golith grains that have the size found in lunar samples (Heiken concentration in samples obtained robotically, I can assume, in
et al., 1993, p. 318). I obtained these values from Eq. (6) general, that such samples are small.
by using Hobbs’ (1974, p. 440) value for the surface tension, I want to estimate how the mass of a pure water ice sample,
0.109 J m−2 , and Pruppacher and Klett’s (1997, p. 79f.) equa- m(t), decreases as a function of time (t ) because of sublimation
tion for the density of pure ice as a function of temperature, when the ice is raised to temperature T . This problem has no
general solution, however, because each estimate will depend
ρi = 916.7 − 0.175(T − 273.15) on the geometry of the sample—in particular, on the ratio of
− 5.0 × 10⁻⁴ (T − 273.15)2 . (7) the area of exposed surface to the total volume. As the geomet-
rically simplest example, I consider a spherical ice deposit with
Here, ρi is in kg m−3and T is in kelvins. Equation (7) agrees initial radius r0 and, thus, initial mass m0 = 4πρi r03 /3. As the
to within about 1% with Hobbs’ (1974, p. 348) tabulated val- radius of this sample changes because of sublimation, the mass
ues for the density of ice for all temperatures between 13 and at any later time is
273.15 K.
4
Because er /esat,i is close to one, Fig. 3 plots er /esat,i − 1. m(t) = πρi r(t)3 , (8)
Therefore, in the figure, where er /esat,i − 1 is positive, the vapor 3
pressure over a curved surface is higher than it would be over where r(t) is the radius as a function of time.
a planar surface. Where er /esat,i − 1 is negative, as it is for a Essentially by definition, the change in radius of this ice
sphere with time at constant temperature is related to the subli-
mation rate,
dr Sr
=− . (9)
dt ρi
Here, though, because I acknowledge that the sample may be
small, Sr must include curvature effects; hence, from Eqs. (1)
and (6),
Mw 1/2 2Mw σi
Sr = esat,i (T ) exp
2πRT ρi rRT
2Mw σi
= S0 exp . (10)
ρi rRT
Consequently, from Eqs. (9) and (10), we can find the time evo-
lution of the radius:
r(t) t
Fig. 3. The saturation vapor pressure over a curved ice surface (er ) compared S0
to the saturation vapor pressure over a planar ice surface (esat,i ) for two lunar exp(−rc /r) dr = − dt, (11)
temperatures. ρi
r0 0Sublimation of ice on the Moon 29
where water ice deposit, originally at 40 K, is not heated to more than
2Mw σi 70 K, sublimation losses during robotic sampling would be in-
rc ≡ (12) significant. If a 100-µm-radius ice deposit were heated to 170 K
ρi RT
during processing, however, it would lose 10% of its original
is the radius at which curvature effects increase the sublimation mass in about an hour. If the original sample is only 1 µm in ra-
rate by 2.7 times (i.e., where Sr = e1 S0 ). dius and were heated to 170 K, it would sublimate 10% of is
The largest value of rc occurs at the lowest temperature— mass in only 32 s.
40 K in our case—where rc = 1.3 × 10⁻⁸ m. For ice deposits As I mentioned, the results shown in Fig. 4 are just ex-
of 1-µm radius or larger, I can thus approximate the exponential amples of the estimates possible with the information I have
in Eq. (11) as a Taylor series and need to keep only the first two presented. In general, though, Fig. 4 suggests that robots or
terms. Then, Eq. (11) integrates to humans who collect in situ samples of regolith near the lu-
nar poles to test for the presence of water ice will not lose
r(t) S0 t
r(t) − r0 − rc ln =− . (13) much of the water through sublimation if the excavating and
r0 ρi
testing are done quickly and the sample is not heated above,
Because we want to prevent an ice deposit from losing ap- say, 150 K. The largest ice deposit depicted in Fig. 4 has an
preciable mass—say no more than 10%—from the time it is initial radius of 100 µm. Because larger spheres have smaller
obtained until it is tested, r(t)/r0 must always be at least 0.95. surface-to-volume ratios, they would lose relatively less mass
Therefore, I can also expand the logarithm in Eq. (13) as a for the same temperature and exposure time as shown for these
Taylor series around r0 and, again, need to keep only the first 100-µm deposits. Consequently, if ice deposits are more mas-
two terms to finally obtain sive or if the sampling can accommodate larger samples, the
handling restrictions are less severe than those I describe.
r0 S0 t
r(t) = r0 − . (14)
r0 − rc ρi
7. Conclusions
Consequently, the fraction of mass remaining at time t in a
spherical ice deposit of initial radius r0 after the deposit is By surveying available data for the saturation vapor pressure
raised to temperature T is of ice and on invoking a new expression for the vapor pressure
3 as a function of temperature, I have made the first estimates for
m(t) S0 t
= 1− . (15) the sublimation rate of water ice in a vacuum down to 40 K. My
m0 ρi (r0 − rc ) estimates thus extend to temperatures 60 K lower than previous
Because Eq. (15) depends inversely on r0 , the fractional estimates by Watson et al. (1961) and Vasavada et al. (1999)
mass loss becomes more severe as the original size of the ice de- and predict sublimation rates at 40 K that are 33–39 orders of
posit decreases. Fig. 4 therefore shows m(t)/m0 for two small, magnitude smaller than their lowest predicted rates.
spherical ice deposits: one with an initial radius of 100 µm, for The explicit application for this research is for develop-
which curvature effects are negligible (see Fig. 3); and the other ing sampling and handling methods for expeditions to the
with r0 = 1 µm, for which both the small size and the curvature lunar poles to make in situ measurements of water ice con-
effects combine to speed sublimation. centration in the regolith. The results I have developed, how-
The time in Fig. 4 ranges from 1 to 1014 s, where 1014 s ever, would apply equally well for exploring Mars or Mercury
is over three million years. Thus, if a small, spherical lunar (e.g., Vasavada et al., 1999; Campbell and Campbell, 2006;
Fig. 4. The fraction of initial mass (m0 ) remaining after time t when spherical samples of pure water ice with initial radii (r0 ) of 100 µm and 1 µm (initial masses
of 3.9 ng and 3.9 fg, respectively) are exposed at the indicated temperature. The estimates are based on Eq. (15) with sublimation rates computed using Murphy and
Koop’s (2005) expression for esat,i , Eq. (4).30 E. L Andreas / Icarus 186 (2007) 24–30
Taylor et al., 2006) and for work in evacuated, low-temperature Coakley, G.W., 1885. The disappearance of the water and atmosphere of the
test chambers on Earth. In a nutshell, the sublimation rate for Moon. Papers Am. Astron. Soc. 1, 1–8.
an ice sample collected at the lunar poles, where temperature is DesMarais, D.J., Hayes, J.M., Meinschein, W.G., 1974. The distribution in
lunar soil of hydrogen released by pyrolysis. Geochim. Cosmochim. Acta
predicted to be 40–70 K, is so slow that only by careless heat- (Suppl.) 5, 1811–1822.
ing or handling would the sample lose a significant fraction of Eshleman, V.R., Parks, G.A., 1999. No ice on the Moon? Science 285, 531.
its ice in the hour after it was freed from the regolith. Estermann, I., 1955. Gases at low densities. In: Rossini, F.D. (Ed.), Ther-
Contaminants in the ice sample decrease this sublimation modynamics and Physics of Matter. Princeton Univ. Press, Princeton, NJ,
pp. 736–776.
rate. The surface curvature of microscopic ice deposits also
Feldman, W.C., Maurice, S., Lawrence, D.J., Little, R.C., Lawson, S.L., Gas-
affects their sublimation rate. For a deposit with a radius of nault, O., Wiens, R.C., Barraclough, B.L., Elphic, R.C., Prettyman, T.H.,
curvature of 1 µm, concave curvature lowers the sublimation Steinberg, J.T., Binder, A.B., 2001. Evidence for water ice near the lunar
rate by less that 2%; convex curvature raises it by less than 2%. poles. J. Geophys. Res. 106, 23231–23251.
Larger deposits experience smaller effects. Heiken, G.H., Vaniman, D.T., French, B.M., 1993. Lunar Sourcebook: A User’s
Guide to the Moon. Cambridge Univ. Press, Cambridge, UK.
On combining these new estimates of sublimation loss and
Hilsenrath, J., Beckett, C.W., Benedict, W.S., Fano, L., Hoge, H.J., Masi, J.F.,
curvature effects, I predict that a spherical lunar ice deposit of Nuttall, R.L., Touloukian, Y.S., Woolley, H.W., 1960. Tables of Thermody-
initial radius 1 µm would lose 10% of its initial mass in only namic Transport Properties of Air, Argon, Carbon Dioxide, Carbon Monox-
32 s if it were heated to 170 K. A 100-µm-radius deposit, how- ide, Hydrogen, Nitrogen, Oxygen, and Steam. Pergamon Press, Oxford,
ever, would require about an hour to lose 10% of its mass by UK.
Hobbs, P.V., 1974. Ice Physics. Clarendon Press, Oxford, UK.
sublimation if it were heated to 170 K. Larger samples suffer
Hodges Jr., R.R., 1973. Helium and hydrogen in the lunar atmosphere. J. Geo-
even smaller rates of fractional mass loss. Retaining lunar ice phys. Res. 78, 8055–8064.
samples near their original temperature of 40 K, on the other Jancso, G., Pupezin, J., Van Hook, W.A., 1970. The vapor pressure of ice be-
hand, would preserve the ice against sublimation for many mil- tween +10−2 and −10+2◦ . J. Phys. Chem. 74, 2984–2989.
lennia. Lide, D.R. (Ed.), 2001. CRC Handbook of Chemistry and Physics, 82nd ed.
CRC Press, Boca Raton, FL.
Margot, J.L., Campbell, D.B., Jurgens, R.F., Slade, M.A., 1999. Topography
Acknowledgments of lunar poles from radar interferometry: A survey of cold trap locations.
Science 284, 1658–1660.
I thank Jerome B. Johnson, Richard C. Elphic, Kris A. Marti, J., Mauersberger, K., 1993. A survey and new measurements of ice vapor
pressure at temperatures between 170 and 250 K. Geophys. Res. Lett. 20,
Zacny, and an anonymous reviewer for comments that im-
363–366.
proved the manuscript. The National Aeronautics and Space Murphy, D.M., Koop, T., 2005. Review of the vapour pressures of ice and su-
Administration supported this work through its project to percooled water for atmospheric applications. Quart. J. R. Meteor. Soc. 131,
develop a Construction and Resource Utilization eXplorer 1539–1565.
(CRUX). Nozette, S., Spudis, P.D., Robinson, M.S., Bussey, D.B.J., Lichtenberg, C.,
Bonner, R., 2001. Integration of lunar polar remote-sensing data sets:
Evidence for ice at the lunar south pole. J. Geophys. Res. 106, 23253–
References 23266.
Pruppacher, H.R., Klett, J.D., 1997. Microphysics of Clouds and Precipitation,
Arnold, J.R., 1979. Ice in the lunar polar regions. J. Geophys. Res. 84, 5659– second ed. Kluwer, Dordrecht.
5668. Stacy, N.J.S., Campbell, D.B., Ford, P.G., 1997. Arecibo radar mapping of the
Bohren, C.F., 1987. Clouds in a Glass of Beer: Simple Experiments in At- lunar poles: A search for ice deposits. Science 276, 1527–1530.
mospheric Physics. Wiley, New York. Starukhina, L.V., Shkuratov, Y.G., 2000. The lunar poles: Water ice or chemi-
Bohren, C.F., Albrecht, B.A., 1998. Atmospheric Thermodynamics. Oxford cally trapped hydrogen? Icarus 147, 585–587.
Univ. Press, New York. Taylor, P.A., Baibakov, K., Brown, S., Hecht, M.H., Hudson, T.L., Li, P.-Y.,
Bryson III, C.E., Cazcarra, V., Levenson, L.L., 1974. Sublimation rates and Lange, C.F., Prieto, L., Savelyev, S., 2006. On the sublimation of ice parti-
vapor pressures of H2 O, CO2 , N2 O, and Xe. J. Chem. Eng. Data 19, 107– cles on the surface of Mars; with applications to the 2007/8 Phoenix Scout
110. mission. Icarus 181, 375–387.
Buck, A.L., 1981. New equations for computing vapor pressure and enhance- Vasavada, A.R., Paige, D.A., Wood, S.E., 1999. Near-surface temperatures on
ment factor. J. Appl. Meteor. 20, 1527–1532. Mercury and the Moon and the stability of polar ice deposits. Icarus 141,
Campbell, B.A., Campbell, D.B., 2006. Regolith properties in the south polar 179–193.
region of the Moon from 70-cm radar polarimetry. Icarus 180, 1–7. Wagner, W., Saul, A., Pruss, A., 1994. International equations for the pressure
Campbell, B.A., Campbell, D.B., Chandler, J.F., Hine, A.A., Nolan, M.C., Per- along the melting and along the sublimation curve of ordinary water sub-
illat, P.J., 2003. Radar imaging of the lunar poles. Nature 426, 137–138. stance. J. Phys. Chem. Ref. Data 23, 515–527.
Carruba, V., Coradini, A., 1999. Lunar cold traps: Effects of double shielding. Watson, K., Murray, B.C., Brown, H., 1961. The behavior of volatiles on the
Icarus 142, 402–413. lunar surface. J. Geophys. Res. 66, 3033–3045.You can also read