Electron generation and multiplication at the initial stage of nanosecond breakdown in water
←
→
Page content transcription
If your browser does not render page correctly, please read the page content below
Electron generation and multiplication at the
initial stage of nanosecond breakdown in
water
Cite as: J. Appl. Phys. 129, 103302 (2021); https://doi.org/10.1063/5.0044415
Submitted: 15 January 2021 . Accepted: 22 February 2021 . Published Online: 09 March 2021

  Xuewei Zhang, and       Mikhail N. Shneider

J. Appl. Phys. 129, 103302 (2021); https://doi.org/10.1063/5.0044415                        129, 103302

© 2021 Author(s).
Journal of                                                                                         ARTICLE            scitation.org/journal/jap
 Applied Physics

    Electron generation and multiplication at the
    initial stage of nanosecond breakdown in water
    Cite as: J. Appl. Phys. 129, 103302 (2021); doi: 10.1063/5.0044415
    Submitted: 15 January 2021 · Accepted: 22 February 2021 ·                                                             View Online   Export Citation     CrossMark
    Published Online: 9 March 2021

    Xuewei Zhang1              and Mikhail N. Shneider2,a)

    AFFILIATIONS
    1
        Frank H. Dotterweich College of Engineering, Texas A&M University-Kingsville, Kingsville, Texas 78363, USA
    2
        Department of Mechanical and Aerospace Engineering, Princeton University, Princeton, New Jersey 08540, USA

    Note: This paper is part of the Special Topic on Plasma-Liquid Interactions.
    a)
        Author to whom correspondence should be addressed: m.n.shneider@gmail.com

    ABSTRACT
    Electrical breakdown of liquid dielectrics under nanosecond pulsed high voltage has been investigated extensively in the last decade.
    Prior studies have focused on either experimental characterization of the breakdown process and discharge plasma or formulation/verification
    of the electrostrictive cavitation mechanism of the breakdown initiation. There remain knowledge gaps toward a clear physical picture of how
    the first plasma is generated in a region saturated by nanoscale cavities created by electrostrictive forces in inhomogeneous fields at the nanosec-
    ond timescale. Initial plasma results from the multiplication of primary electrons that gain energy collisionlessly in the cavities to cause colli-
    sional ionization of water molecules on the cavity walls. This paper quantitatively discusses the possible sources of primary electrons that seed
    the plasma discharge. Electron detachment from hydroxide is shown to be the most probable and sustainable electron source. Using numerical
    modeling, this study demonstrates the plausibility of an electron multiplication mechanism involving two neighboring cavities. The drift of
    hydrated electrons from one cavity to the next is the rate-limiting step and sets the minimum electric field requirement. This work will inform
    subsequent experimental studies and have implications in various applications such as plasma sources in biomedical applications, cavitation
    study, and insulation of pulsed power equipment.

    Published under license by AIP Publishing. https://doi.org/10.1063/5.0044415

    I. INTRODUCTION                                                             breakdown field in water is about one order of magnitude lower
                                                                                than the expected value (∼3 × 10⁹ V/m) from the linear dependence
          Electrical breakdown of liquid dielectrics under nanosecond
    (ns) or sub-nanosecond (sub-ns) pulsed high voltage has been                on the ratio of field and density, (ii) Joule heating is insufficient to
    investigated extensively in the last decade.1–7 This is a relatively        cause the formation of vapor bubbles at the electrode at the ns
    new research area that is of fundamental importance to plasma               timescale (therefore the bubble mechanism does not apply), and
    sources for biomedical applications8,9 and insulation of pulsed             (iii) the existence of “dark phase” and reignition at the falling edge
    power equipment.10,11 For water in particular, the understanding of         of the pulse.14 The qualitative picture of the electrostrictive cavita-
    the mechanisms and processes of ns/sub-ns breakdown also sheds              tion breakdown process is summarized as follows.7 In a needle-
    new light on cavitation research,12,13 promising accurate determina-        plane geometry, the strong inhomogeneous field can create a nega-
    tion of cavitation threshold pressure, which has many practical             tive pressure (electrostriction) in the order of −10 MPa, and its
    implications, such as informing fluid machinery design to reduce            relaxation (via flow compensation) requires a time >10 ns. This sets
    cavitation damage and generating cavities for targeted drug                 the stage for the nucleation and growth of cavitation nanocavities
    delivery.                                                                   in water in the vicinity of the needle electrode. Inside cavities, elec-
          Previous studies have focused on either experimental charac-          trons are accelerated by the field to energies exceeding the water
    terization of the breakdown process and discharge plasma1,2 or for-         molecule ionization potential (12.6 eV) and, when hitting cavity
    mulation and verification of the electrostrictive cavitation                walls, generate more electrons, which eventually lead to breakdown.
    mechanism of the breakdown initiation.3–6 The electrostrictive cavi-               In recent years, there have been some new developments in
    tation mechanism was proposed to account for (i) the ns                     the theoretical understanding of the electrostrictive cavitation

J. Appl. Phys. 129, 103302 (2021); doi: 10.1063/5.0044415                                                                                                 129, 103302-1
Published under license by AIP Publishing.
Journal of                                                                                             ARTICLE                scitation.org/journal/jap
 Applied Physics

    mechanism. Considering a single cavity at the tip of the electrode, a        Rc , above which the cavity can sustain or expand. We have13
    study15 numerically solved the radial expansion of the cavity. The
    initial cavity radius was set as several micrometers, and the time for                                         Rc ¼ 2σ/P,                                      (2)
    significant growth was after 10 ns, both too large for the initial
    stage of ns breakdown in water. Nevertheless, an interesting conclu-
                                                                                 where σ ¼ σ 0 /(1 þ 2δ/Rc ), σ 0 ¼ 0:072 N/m is the surface tension
    sion was that the existence of nanocavities does not lead to liquid
                                                                                 of water at room temperature, and δ is the Tolman parameter to
    breakdown through the gas phase following the Meek–Loeb crite-
                                                                                 account that the actual surface tension is lower when the cavity
    ria. Two independent studies16,17 developed improved multiphysics
                                                                                 radius is comparable to the thickness of the water’s transition layer.
    modeling frameworks to simulate cavitation and subsequent pro-
                                                                                 We assume that all cavities are spherical and have one uniform size.
    cesses. Both used a gas discharge type model to simulate initial
                                                                                 In the framework of Zel’dovich–Fisher nucleation theory, the rate of
    plasma formation via ionization in the liquid phase16 or electron
                                                                                 creation of cavities with critical radius Rc per unit volume is13
    avalanche in the cavities.17 Along the same line as the latter, a new
    work18 using Geant4-DNA simulation toolkit attempted to model
    the secondary electron generation by a sequence of collisions with                                       3 kB T         4πσR2c
                                                                                                      Γc ¼            exp           ,                             (3)
    the wall of the cavity (assumed as a long tube, which seems unreal-                                    4πR3c 2πh        3kB T
    istic). In addition to the inconsistencies in mechanism(s) of elec-
    tron multiplication that results in initial plasma presented in the          where Γc is the rate of generation of cavities, kB ¼ 1:38  1023 J/K
    above works, another fundamental question remains unanswered:                is the Boltzmann constant, T is the temperature (298 K in this work),
    what might be the source(s) of primary electrons that trigger the            and h ¼ 1:05  1034 J  s is the Planck constant. As shown in
    electron multiplication process?                                             Fig. 1, with Rc in the proximity of 1 nm, Γc is between an upper
          This paper, built upon our preliminary reports at the 2019             limit of the number density of water molecules (1010 μm3 ) per
    and 2020 Gaseous Electronics Conference,19,20 presents an analysis           ns and a lower limit of 1 per μm3 per ns.
    of possible origins of primary electrons, demonstrating that                       Now even with E ¼ 109 V/m (2 to 3 times higher than the
    electron detachment from hydroxide (OH− ion) is more probable                maximum electric field in actual experimental systems), if the
    than other known sources under the experimental conditions.                  cavities, once formed, do not expand, then the energy gain of an
    Furthermore, a multi-cavity mechanism of the electron multiplica-            electron traversing the cavity is around 2 eV, much lower than the
    tion is proposed and shown to be in good agreement with both                 water molecule ionization potential (Iw ¼ 12:6 eV). To enable elec-
    basic physics and experimental results. This work bridges current            tron multiplication, the initial cavities must undergo subsonic
    knowledge gaps toward a clear physical picture of how initial                expansion at the sub-ns timescale (10–100 ps)6 and reaches an
    plasma is generated in a region saturated by nanoscale cavities at           “equilibrium radius” beyond which the resulting relief of negative
    the ns timescale.                                                            pressure will no longer support cavitation inception and develop-
                                                                                 ment. Due to the complexity of this process, it is unclear what
                                                                                 exactly is the final radius R. We estimate
    II. POSSIBLE SOURCES OF PRIMARY ELECTRONS
          Before discussing the possible sources of primary electrons, it                                                 1 Iw
    is necessary to set the stage, i.e., describing the cavitation zone                                             R*          ,                                  (4)
                                                                                                                          2 eEc
    at the initial stage of ns breakdown in water. According to the elec-
    trostrictive cavitation breakdown mechanism, under a strong, inho-
    mogeneous, fast-switched electric field, ruptures of the liquid
    continuum can be caused by the negative electrostriction pressure,7

                                PE ¼ 0:5αE εε0 E2 ,                      (1)

    where the coefficient αE ¼ 1:5 for water, ε is the relative permittiv-
    ity (80 for water), ε0 ¼ 8:85  1012 F/m is the permittivity of free
    space, and E is the intensity of the local electric field. When
    E ¼ 108  109 V/m, the corresponding jPE j ¼ 5:38  538 MPa,
    which is much higher than initial hydrostatic pressure in the ns
    breakdown experimental settings (therefore, it is neglected in this
    work) and within a range similar to that of the experimentally
    determined values (2  140 MPa) of the cavitation threshold
    pressure (i.e., tensile strength) of water.21 For simplicity, hereafter,
    we use symbol P to represent jPE j.
          Consider a spherical cavity in water with high negative pressures
    (its absolute value is much higher than the vapor saturation pressure;        FIG. 1. Dependence of the rate of creation of cavities (Γc ) on the critical cavity
                                                                                  radius Rc and the Tolman parameter δ. The dashed lines mark the range of Rc
    therefore, the cavity here can be assumed to be a vacuum). An analy-          (when δ ¼ 1:25 nm) that corresponds to physically reasonable Γc .
    sis of force balance indicates that there exists a critical cavity radius,

J. Appl. Phys. 129, 103302 (2021); doi: 10.1063/5.0044415                                                                                                   129, 103302-2
Published under license by AIP Publishing.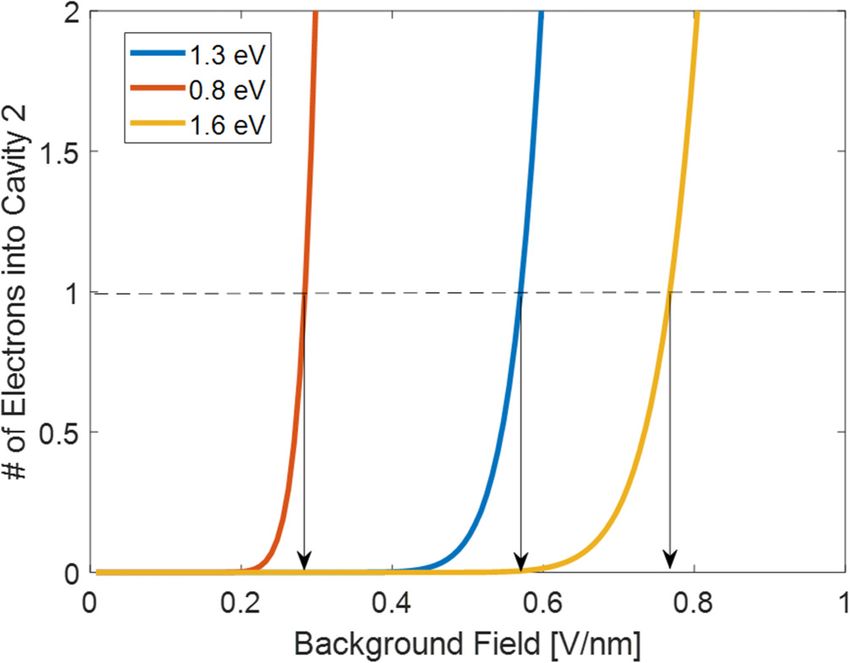
Journal of ARTICLE scitation.org/journal/jap
Applied Physics
where e ¼ 1:60 1019 C is the electron charge and Ec 1:5E is value. Interestingly, even without radiation or strong field, water
the field intensity inside a nanocavity in the water where the local has autoionization (H2 O þ H2 O O OH þH3 Oþ ):22 at atmo-
background field is E. The maximum number density of these spheric pressure and 25 °C, the equilibrium density of hydroxide
cavities, nc , can be estimated from that the pressure after relief by (OH−) and hydronium (H3O+) ion pairs is 10−1 mol/m3 or 60 per
cavities remains comparable to P,13 μm3. Detachment from OH− is the third and so far the most prob-
able source of primary electrons. The reasons are as follows: (i) The
fP electron detachment threshold of OH− on surface (in our case, the
nc ¼ , (5) cavity wall) is In ¼ 1:8 eV,23 much lower than that of OH− in bulk
Vc2s ρ
(surrounding water molecules having stabilizing effects), as well as
where V ¼ 4π3 R3 is the cavity volume, f is a factor between 0 and 1, the water molecule’s ionization potential Iw ; (ii) OH− ions tend to
ρ ¼ 103 kg/m3 is the water density, and cs ¼ 1:5 103 m/s is the concentrate near the cathode-side pole of a cavity due to drift
speed of sound in water. In Fig. 2, we plot Eqs. (4) and (5) as a under the electric field; (iii) Strong electric field, especially in the
function of E. Stronger background fields result in smaller cavities order of 1 V/nm, can significantly enhance water autoionization;24
and much higher cavity densities, consistent with the theoretical (iv) The emission of electrons from the cathode-side pole into the
analysis in Eqs. (2) and (3). cavity effectively shifts the equilibrium of water autoionization in
In our simplified physical picture of the cavitation zone, at that region rightwards (i.e., producing OH− ions), which makes
the sub-ns timescale, there are cavities that have the same radius this mechanism sustainable.
and are uniformly distributed in the water. For instance, with To quantitatively demonstrate the above points (i) and (ii), we
E ¼ 0:42 V/nm and f ¼ 0:9, the corresponding R ¼ 10 nm and first build the physical model of a simple system consisting of a
nc 1:2 104 μm3 . The total volume of cavities takes up ∼5% of single spherical cavity in water, as shown in Fig. 3(a). The govern-
the cavitation zone volume. If there are more than 20 electrons, ing equations in water are
then statistically speaking, one would be located within a cavity
@ci Y
boundary to serve as the seed for breakdown. We proceed to þ ∇ Ji ¼ k ci , (6)
examine the possible origins of primary electrons that satisfy the @t i
above condition.
The first possible source is cosmic background radiation.
Ji ¼ Di ∇ci þ zi μi Fci ε, (7)
In the air, this creates 109 ions per μm3. Although no data are
found for water, it can be accepted that natural background radia-
tion is highly unlikely to generate a greater degree of ionization in ε ¼ ∇w, (8)
water.7 Even assuming the density of cosmic radiation generated
ions is proportional to the density of the medium, one can estimate X
ε0 ∇ (ε∇w) ¼ F zc, (9)
that cosmic radiation might account for up to 106 ions per μm3 in i i i
water (with or without cavitation), which, as will be shown below,
is still a much less probable source compared to water’s autoioniza- where t is the time, ci (i ¼ H3 Oþ or OH ) represents the concen-
tion. The second possible source is field ionization of water mole- tration (unit: mol/m3) of each ion, k ¼ 1:5 108 mol1 m3 s1 is
cules, which is negligible for fields lower than 7.5 V/nm.7 The the equilibrium reaction rate constant of the water autoionization,22
maximum field in experimental settings is an order lower than this Ji is the flux of each species consisting of diffusion and drift where
the diffusion coefficients22 are DOH ¼ 5:27 109 m2 s1 and
DH3 Oþ ¼ 9:31 109 m2 s1 , and according to the Nernst–Einstein
relation, the mobility of both ions is μi ¼ Di zi e/(kB T), zi ¼ +1 is
the charge number of ions, F ¼ 96 485 C/mol is the Faraday cons-
tant, ε and w are the electric field and potential. Inside the cavity,
only electric field equations are solved (Laplace’s equation). There
is no ion flux across the cavity wall. At t ¼ 0, the field is applied,
and the initial ci ’s are the equilibrium value (104 mol/m3 ). The
model is implemented and solved in COMSOL Multiphysics 5.4
using coupled Electrostatics and Transport of Dilute Species
modules. The dimension of the simulation domain is 200 nm for
cavity radius 10 nm to ensure that the physical fields at the domain
boundary take the “unperturbed” values.
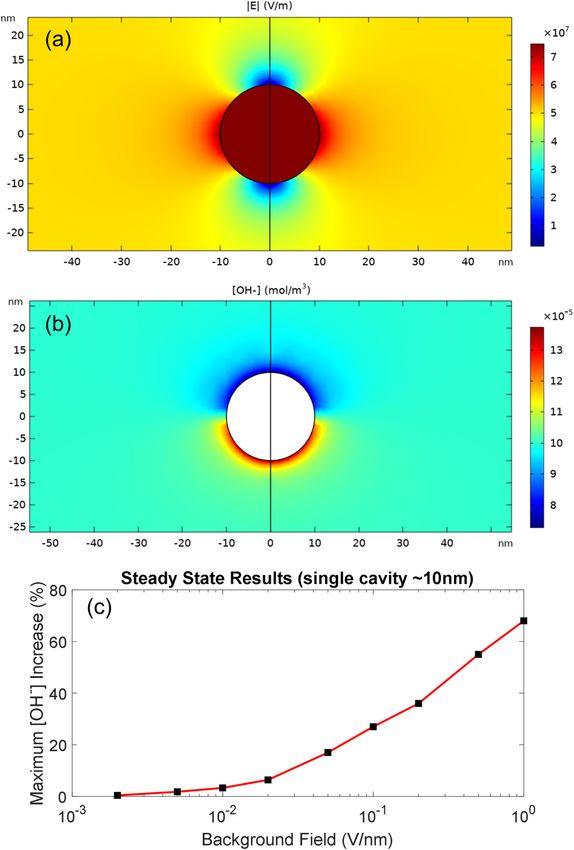
In Fig. 3(a), the electric field inside the cavity is about 1.5
times the background field. Due to the low charge density, the field
distribution is very close to the charge-free analytical solution and
does not change over time. On the other hand, Fig. 3(b) shows that
the hydroxide concentration is increased near the cathode-side pole
FIG. 2. The final cavity radius (R) and number density (nc ) as functions of the
local background field. The inset shows nc under low E.
of the cavity, which reaches a steady-state within 1 ns. By reducing
the cavity size or increasing the background field, the steady-state
J. Appl. Phys. 129, 103302 (2021); doi: 10.1063/5.0044415 129, 103302-3
Published under license by AIP Publishing.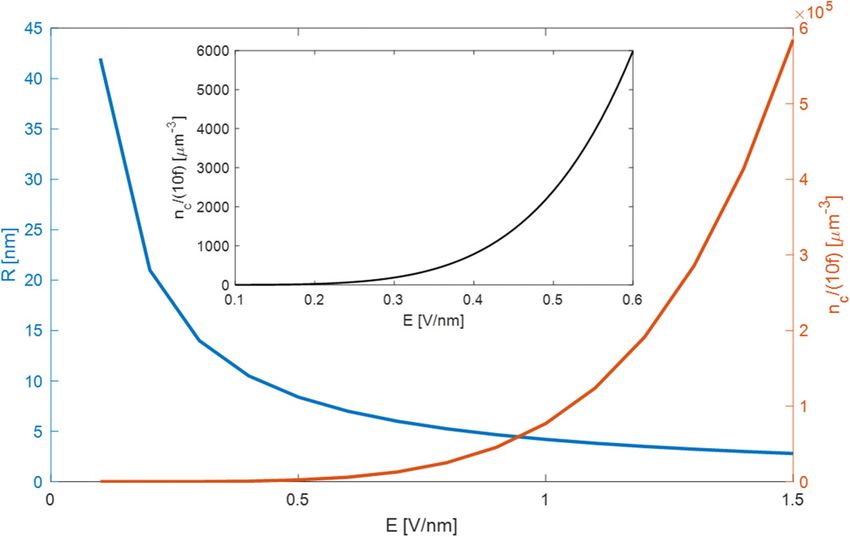
Journal of                                                                                                         ARTICLE               scitation.org/journal/jap
 Applied Physics

                                                                                                FIG. 4. Expected number density of electrons detached from hydroxide into the
                                                                                                cavities within 0.1 ns as a function of the background field.

                                                                                               where m ¼ 9:11  1031 kg is the electron mass and the coefficient
                                                                                               A  1 depends on the potential well’s shape. The number of elec-
                                                                                               trons released into cavities per μm3 during time Δτ is

                                                                                                                        ne  w(1 þ θ)nOH  Δτ,                            (11)

                                                                                               where nOH  ¼ 60 μm3 is the equilibrium hydroxide number
                                                                                               density. In the context of ns breakdown, we expect the timescale of
                                                                                               electron emission to be sub-ns. Here we choose Δτ ¼ 0:1 ns.
                                                                                               Figure 4 plots Eq. (11) under various background fields. A back-
                                                                                               ground field higher than 0.75 V/nm correspond to an ne above
                                                                                               1 per μm3. For a cavity radius of 10 nm, the background field needs
                                                                                               to exceed 0.42 V/nm for primary electrons to gain sufficient energy
                                                                                               to trigger multiplication upon hitting the cavity wall. This field
                                                                                               value corresponds to ne  106 μm3 . If the volume of the cavita-
                                                                                               tion zone is in the order of 0.1 mm3, it would be very likely that
      FIG. 3. Continuum multiphysics modeling results of a spherical cavity of radius          one or more primary electrons are generated and released into the
      10 nm in water under electrostatic fields. (a) Distribution of the electric field mag-   cavity. Using experimental techniques to determine the initial cavi-
      nitude when the background field is 0.01 V/nm. The arrow indicates the direction         tation zone profile will be crucial to test the proposed theory.
      of the background field. (b) Steady-state hydroxide concentration under a back-
      ground field of 0.2 V/nm. The steady-state is reached in less than 1 ns. (c)
      Increased hydroxide concentration at the cathode-side pole of the cavity (θ) as          III. ELECTRON MULTIPLICATION IN THE
      a function of the background field.                                                      CAVITATION ZONE
                                                                                                    The proposed electron multiplication mechanism is illustrated
                                                                                               in Fig. 5. The basic idea is that multiple cavities are involved in this
    can be reached even faster, since the change of ion distribution                           process. As mentioned earlier, within one nanoscale cavity, the
    results mainly from drift. Under different background fields, the                          primary electron is unlikely to gain sufficient energy to generate
    maximum increased amount (denoted by θ) of OH concentration                               multiple new electrons under a background field of
Journal of ARTICLE scitation.org/journal/jap
Applied Physics
FIG. 5. Illustration of the proposed primary electron generation and multiplication mechanism. (a) Electron detachment from hydroxide ions and release into cavity 1. (b)
After traverse cavity 1 collisionlessly, the electron gains sufficient energy to ionize a water molecule on the opposite wall of the cavity. The resulting two electrons enter the
layer between cavity 1 and cavity 2 and immediately become surrounded by water molecules (hydrated electrons). (c) The hydrated electrons drift toward cavity 2. (d) The
electrons freed enter cavity 2.
of travel across the layer to be at the sub-ns timescale (e.g., shielding effect. On the other hand, the cavity number density is
Δτ 0 ¼ 0:2 ns), we have related to ΔL,
ΔL 1
&Δτ 0 , (12) nc ¼ : (13)
μh Eav (ΔL þ 2R)3
where Eav is the average magnitude of field in the layer, which can Combining Eqs. (13), (5), and (1), and set R ¼ 10 nm in this
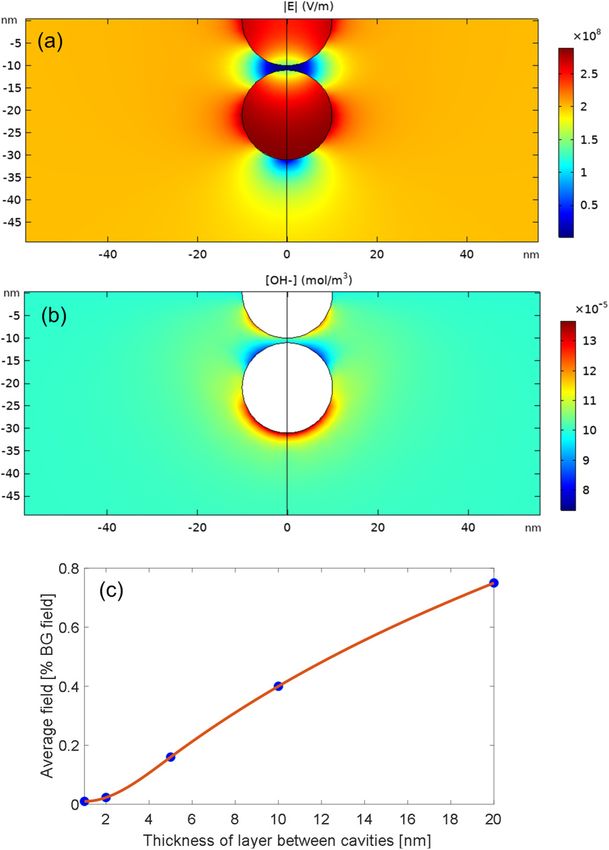
be obtained from the multiphysics modeling. Figure 6(a) presents a case, we find another minimum background field. Figure 7 shows
sample result when the layer separating the two cavities (both of that, in this case, 3–12 nm is identified as the most “feasible” range
radium 10 nm) is only 2 nm thick. In Fig. 6(c), we plot Eav of ΔL because as long as the field is high enough to create the cavi-
(expressed as a percentage of the background field) as a function of ties, the field is automatically able to make the electron drift ΔL
ΔL in this case. While ΔL does not seem to have a significant effect within time Δτ 0 . A theoretical implication is that there could be sce-
on the hydroxide concentration at the cathode-side pole of cavity 1 narios resulting only in cavitation but not electron multiplication.
[Fig. 6(b)], it affects Eav in the following way: when ΔL is smaller Finally, we discuss the release of electrons into cavity 2. Using
than the cavity radius, Eav is significantly lower than the back- the formula similar to Eqs. (10) and (11),
ground field; when ΔL becomes much larger than cavity size, each
rffiffiffiffiffiffiffiffiffiffi pffiffiffiffiffiffiffi
cavity can be treated as isolated and Eav is very close to the back- 1 4I 3/2 2m
ground field. The example in Fig. 6(a) also provides a clue regard- w0 πA2 eEc exp s , (14)
2mIs 3heEc
ing the difficulty of cavity coalescence. The substantial reduction of
field reduces the amount of negative pressure and prevents the two
cavities from being “pulled” closer. Ne0 2w0 Δτ, (15)
The physical and chemical properties of hydrated electrons may
vary greatly depending on the cluster size and the isomer type.25 For where w0 is the probability rate of the detachment of hydrated
the mobility of hydrated electron, we use 1:84 107 m2 V1 s1 electron, Is is the electron’s affinity energy, and Ne0 is the expected
(close to that of OH in water).26 To meet the condition in Eq. (12), number of electrons entering cavity 2 (from the two hydrated
the minimum background field is calculated and plotted in Fig. 7 as electrons). In the literature, Is values are found to be in a wide
a function of ΔL. As expected, when ΔL is large, the field and, there- range from 0.1 to 0.3 eV (bulk) and 0.8 (surface)27 to 1.3 eV28 and
fore, the drift velocity is proportional to ΔL. When ΔL is smaller to over 3 eV.25 In Fig. 8, we pick three values in this range and plot
than 10 nm, a higher background field is needed to counter the Ne0 as a function of the background field. With the electron affinity
J. Appl. Phys. 129, 103302 (2021); doi: 10.1063/5.0044415 129, 103302-5
Published under license by AIP Publishing.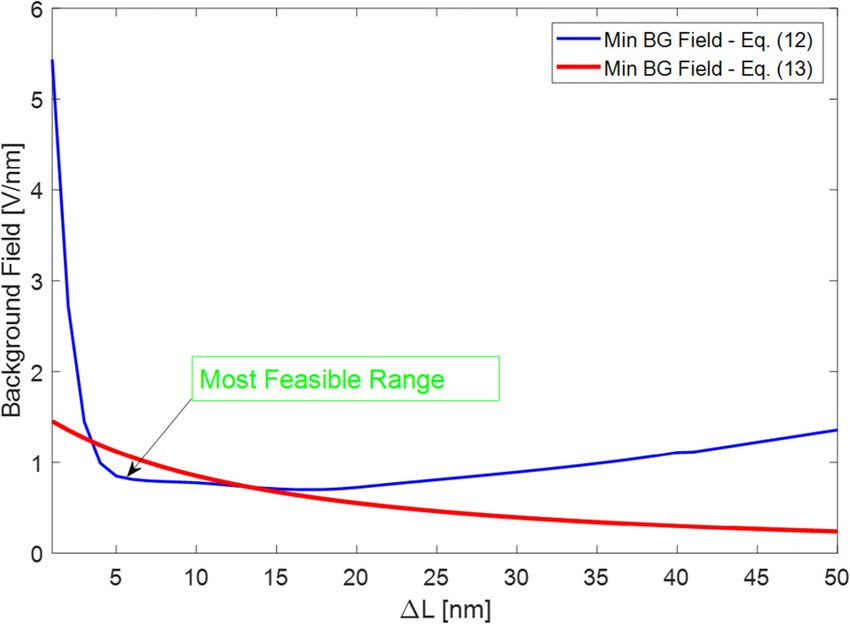
Journal of                                                                                                      ARTICLE               scitation.org/journal/jap
 Applied Physics

                                                                                            FIG. 8. The expected number of electrons entering cavity 2 via tunneling
                                                                                            detachment as functions of the background field under three values of the elec-
                                                                                            tron’s affinity energy.

                                                                                           energy in the range of 0.8–1.6 eV, the background field in the
                                                                                           experimentally realized order of magnitude can ensure that >1 elec-
                                                                                           trons are released into cavity 2. Electron multiplication will then
                                                                                           follow this “chain reaction” path.

                                                                                           IV. CONCLUSIONS
      FIG. 6. Continuum multiphysics modeling results of two spherical cavities of
      radius 10 nm in water under a background field of 0.2 V/nm. (a) Distribution of            This paper proposes a theoretical model of the generation and
      electric field magnitude. (b) Steady-state hydroxide concentration. (c) Average      multiplication of primary electrons at the early stage of electrical
      field intensity in the liquid layer between the two cavities (expressed as a per-    breakdown in water under nanosecond pulsed fields, based on a
      centage of the background field) as a function of the layer’s thickness.             simplified physical picture of the cavitation zone caused by electro-
                                                                                           striction (negative electrical pressure). Several possible sources of
                                                                                           primary electrons are identified. Even without the electric field,
                                                                                           abundant hydroxides (OH ) exist in water due to its autoioniza-
                                                                                           tion. Electrons in hydroxide have a much lower detachment energy
                                                                                           than water’s ionization energy. It has been shown that electron
                                                                                           detachment from hydroxide has the potential to be a major electron
                                                                                           source. In addition, preliminary numerical results indicate that, at
                                                                                           the ns timescale, the proposed multiplication mechanism involving
                                                                                           hydrated electrons drifting toward the next cavity works. The
                                                                                           required electric field strength and inter-cavity distance are physi-
                                                                                           cally plausible.
                                                                                                 Subsequent work may be done in three directions. First, break-
                                                                                           throughs in experimental measurements of the cavitation inception
                                                                                           and development will inform the revision and improvement of the
                                                                                           theoretical methods used to analyze cavity size and density. Second,
                                                                                           based on the proposed mechanism, new kinetic models coupled
                                                                                           with multiphase electrohydrodynamics and advanced numerical
                                                                                           simulation techniques could lead to a clearer understanding of the
                                                                                           complex processes involved. Finally, this research opens up possi-
      FIG. 7. The minimum background field required to enable the electron drift through   bilities to use ns breakdown in water as a vehicle to investigate chal-
      the inter-cavity layer within Δτ 0 and the minimum background field needed to
      achieve the cavity number density as functions of the layer’s thickness.
                                                                                           lenging problems in other fields, such as the pressure threshold for
                                                                                           cavitation and the physical properties of hydrated electrons.

J. Appl. Phys. 129, 103302 (2021); doi: 10.1063/5.0044415                                                                                                          129, 103302-6
Published under license by AIP Publishing.
Journal of                                                                                                          ARTICLE               scitation.org/journal/jap
 Applied Physics

                                                                                              11
    ACKNOWLEDGMENTS                                                                              F. A. M. Rizk and G. N. Trinh, High Voltage Engineering (CRC Press, 2014).
                                                                                              12
                                                                                                 M. N. Shneider and M. Pekker, “Cavitation in dielectric fluid in inhomoge-
         This work is partially supported by the Princeton                                    neous pulsed electric field,” J. Appl. Phys. 114, 214906 (2013).
    Collaborative Research Facility (PCRF), supported by the U.S.                             13
                                                                                                 M. Pekker and M. N. Shneider, “Initial stage of cavitation in liquids and its
    Department of Energy (DOE) under Contract No.                                             observation by Rayleigh scattering,” Fluid Dyn. Res. 49, 035503 (2017).
    DE-AC02-09CH11466. X.Z. also receives support from the U.S.                               14
                                                                                                 M. Pekker et al., “Initiation stage of nanosecond breakdown in liquid,” J. Phys.
    DOE Office of Science Award No. DE-SC0021182.                                             D: Appl. Phys. 47, 025502 (2014).
                                                                                              15
                                                                                                 D. V. Tereshonok, “Cavitation in liquid dielectric under nanosecond high-
                                                                                              voltage impulse,” J. Phys. D: Appl. Phys. 50, 015603 (2017).
    DATA AVAILABILITY                                                                         16
                                                                                                 A. C. Aghdam and T. Farouk, “Multiphysics simulation of the initial stage of
        The data that support the findings of this study are available                        plasma discharge formation in liquids,” Plasma Sources Sci. Technol. 29, 025011
    from the authors upon reasonable request.                                                 (2020).
                                                                                              17
                                                                                                 Y. Li et al., “Towards an improved understanding of nanosecond-pulse dis-
                                                                                              charge initiation in water: From cavitation to electron multiplication,” Plasma
    REFERENCES
                                                                                              Sources Sci. Technol. 29, 075005 (2020).
    1
      A. Starikovskiy, Y. Yang, Y. I. Cho, and A. Fridman, “Non-equilibrium plasma            18
                                                                                                 Z. Bonaventura, P. Bilek, J. Tungli, and M. Simek, “Fast pulsed electrical break-
    in liquid water: Dynamics of generation and quenching,” Plasma Sources Sci.               down of water: Electron multiplication in liquid ruptures,” in Virtual Gaseous
    Technol. 20, 024003 (2011).                                                               Electronics Conference, October 5–9, (American Physical Society, 2020).
    2
      A. Starikovskiy, “Pulsed nanosecond discharge development in liquids with               19
                                                                                                 X. Zhang and N. M. Shneider, “On the source of primary electrons at the initial
    various dielectric permittivity constants,” Plasma Sources Sci. Technol. 22,              stage of nanosecond breakdown in water,” in Gaseous Electronics Conference,
    012001 (2013).                                                                            October 28–November 1 (American Physical Society, College Station, TX, 2019).
    3
      M. N. Shneider, M. Pekker, and A. Fridman, “Theoretical study of the initial            20
                                                                                                 X. Zhang and M. N. Shneider, “Electron generation and multiplication at the
    stage of sub-nanosecond pulsed breakdown in liquid dielectrics,” IEEE Trans.              initial stage of nanosecond breakdown in water,” in 2020 Virtual Gaseous
    Dielectr. Electr. Insul. 19, 1579–1582 (2012).                                            Electronics Conference, October 5–9 (American Physical Society, 2020).
    4
      Y. Seepersad, M. Pekker, M. Shneider, A. Fridman, and D. Dobrynin,                      21
                                                                                                 F. Caupin and E. Herbert, “Cavitation in water: A review,” C. R. Phys. 7,
    “Investigation of positive and negative modes of nanosecond pulsed discharge in           1000–1017 (2006).
    water and electrostriction model of initiation,” J. Phys. D: Appl. Phys. 46, 355201       22
                                                                                                 P. Atkins and L. Jones, Chemical Principles: The Quest for Insight, 5th ed.
    (2013).                                                                                   (W. H. Freeman, 2010).
    5
      M. N. Shneider and M. Pekker, “Dielectric fluid in inhomogeneous pulsed elec-           23
                                                                                                 C. Petersen, J. Thøgersen, S. K. Jensen, and S. R. Keiding, “Electron detach-
    tric field,” Phys. Rev. E 87, 043004 (2013).                                              ment and relaxation of OH−(aq),” J. Phys. Chem. A 111, 11410–11420
    6
      M. N. Shneider and M. Pekker, “Pre-breakdown processes in a dielectric fluid            (2007).
    in inhomogeneous pulsed electric fields,” J. Appl. Phys. 117, 224902 (2015).              24
                                                                                                 A. M. Saitta, F. Saija, and P. V. Giaquinta, “Ab initio molecular dynamics
    7
      M. N. Shneider and M. Pekker, Liquid Dielectrics in an Inhomogeneous Pulsed             study of dissociation of water under an electric field,” Phys. Rev. Lett. 108,
    Electric Field, 2nd ed. (IOP Publishing, 2019).                                           207801 (2012).
    8
      P. J. Bruggeman et al., “Plasma-lliquid interactions: A review and roadmap,”            25
                                                                                                 J. M. Herbert and M. P. Coons, “The hydrated electron,” Annu. Rev. Phys.
    Plasma Sources Sci. Technol. 25, 053002 (2016).                                           Chem. 68, 447–472 (2017).
    9
      P. Lukes, J.-L. Brisset, and B. R. Locke, “Biological effects of electrical discharge   26
                                                                                                 K. H. Schmidt and W. L. Buck, “Mobility of the hydrated electron,” Science
    plasma in water and gas-liquid environments,” in Plasma Chemistry and                     151, 70–71 (1966).
    Catalysis in Gases and Liquids, edited by V. I. Parvulescu, M. Magureanu, and             27
                                                                                                 A. P. Gaiduk, T. A. Pham, M. Govoni, F. Paesani, and G. Galli, “Electron affin-
    P. Lukes (Wiley, 2012).                                                                   ity of liquid water,” Nat. Commun. 9, 247 (2018).
    10
       J. Lehr and P. Ron, Foundations of Pulsed Power Technology (IEEE Press,                28
                                                                                                 R. E. Ballard, “The electron affinity of water and the structure of the hydrated
    2017).                                                                                    electron,” Chem. Phys. Lett. 16, 300–301 (1972).

J. Appl. Phys. 129, 103302 (2021); doi: 10.1063/5.0044415                                                                                                               129, 103302-7
Published under license by AIP Publishing.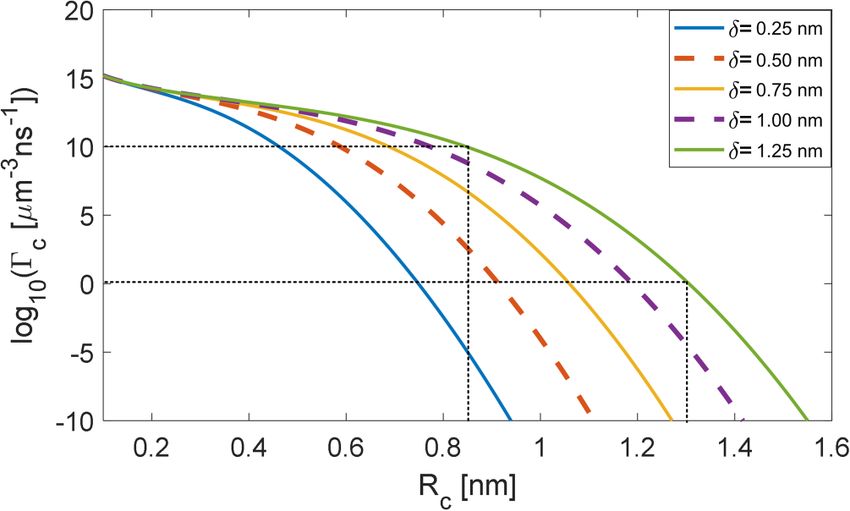
You can also read