Levelling Up - The Logic of Logistics - A report demonstrating the wider economic, social and environmental benefits of the industrial & logistics ...
←
→
Page content transcription
If your browser does not render page correctly, please read the page content below

Levelling Up - The Logic of Logistics
  A report demonstrating the wider economic, social and
 environmental benefits of the industrial & logistics sector
Levelling Up - The Logic of Logistics

Contents
Foreword                                                            3

Executive Summary                                                   4

1. Introduction                                                     8

2. An Economic Powerhouse                                           9

3. Growing Social Value Credentials                                23

4. A Green Recovery ‘Boxed’                                        31

5. Final Recommendations                                           40

Acknowledgements                                                   42

Footnotes                                                          44

Contacts                                                           45

                                             2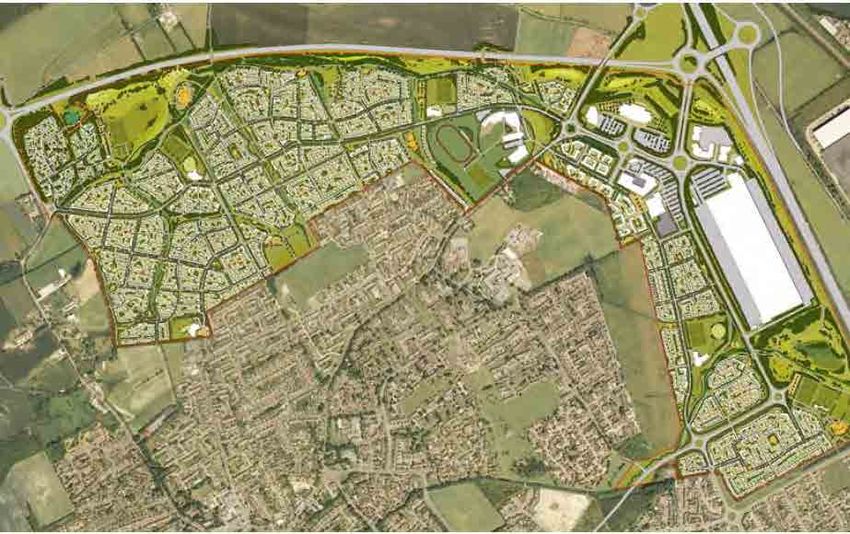
Levelling Up - The Logic of Logistics

Foreword
The Covid-19 pandemic has demonstrated that our industrial                Enabling the sector to reach its full potential is essential to the
and logistics facilities are a key part of the nation’s critical          government’s aspirations to address regional inequalities but
national infrastructure.                                                  our planning system remains a barrier and is restricting
                                                                          growth in the sector by not allocating enough land in
Alongside our supply chains, they support other important                 appropriate locations. If the industrial and logistics sector is
and growing sections of a strong economy and the way we live              to play its full part in levelling up, it is vital that we create a
our lives by ensuring we have what we need at the right time.             more agile planning system which is more responsive to the
They are as crucial as the roads, rail, airport and port facilities       sector’s needs.
needed to move goods around the country.
                                                                          This latest BPF Industrial Committee report builds on
The sector also generates significant economic benefits                   previous research publications advocating for a more
supporting increasing numbers of high-quality jobs across the             responsive planning system to the needs of the industrial and
English regions. A thriving industrial and logistics sector is            logistics sector. The report also provides a comprehensive
therefore critical to the government delivering on its                    overview of the growing economic, social value and
ambitions to ‘level up’ across the UK with over 70% of demand             environmental credentials of the sector as well as presenting
for industrial and logistics space in the North of England and            case studies from within the BPF membership to reinforce
the Midlands.                                                             these qualities.

Gwyn Stubbings
Planning Director, GLP
Chair of the BPF Industrial Committee

                                                                      3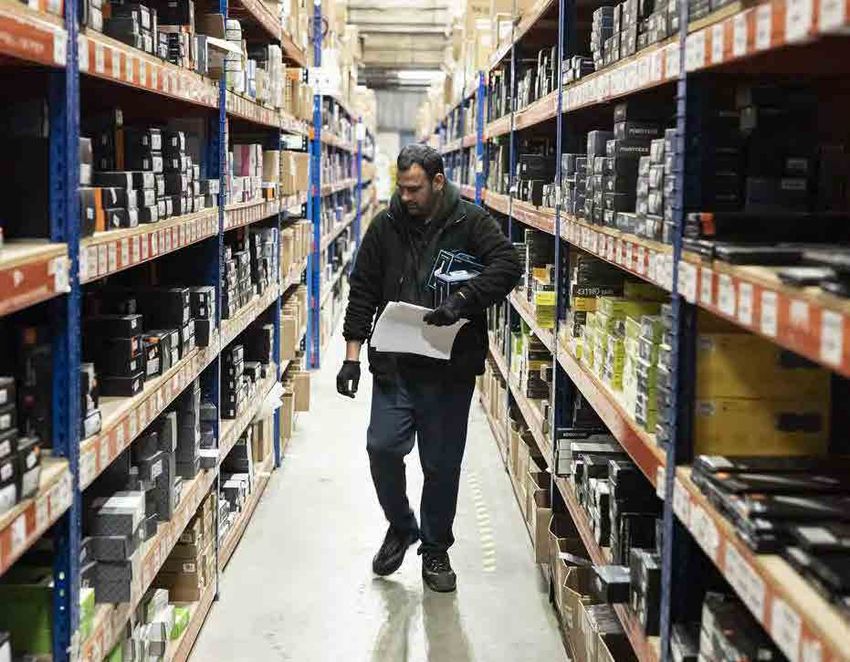
Levelling Up - The Logic of Logistics

               Executive Summary
                                    An Economic Powerhouse

                           I&L facilities are                                                  The I&L sector generates
                   Critical National Infrastructure                                         significant economic benefits

              Alongside their supply chains, they
                 support the functioning of our
                                                                                                        3.8 million
                                                                                                        jobs in I&L in England
               economy and the way we live our
                lives, by ensuring we have what
                 we need. They are as critical as
                the roads, rail, airport and port Fuel Supplies
Food Supplies
                facilities needed to move goods
                        around the country
                                                                                                        £232 billion
                                                                                                        of GVA

                                                                                                        29% productivity
                               Vaccines and                                                             increase between 2025 and 2039
                              Medical Supplies

     The I&L sector is subject to continuing                                                  …the reality is I&L jobs pay more
misconceptions about average pay and skill levels
                                                                                                     I&L sectors ■ All sectors

            …and the occupations provided are
                becoming more diverse
                                                                                           + £4.6K per year                  + £4.9K per year
                                                                                             (Manufacturing)                    (Logistics)

           Less managers and
          elementary roles and                                                                                         ■ 2010        2019     1,400,000
           more intermediate                                                                                     -8K
          and tech occupations                                                                                                                1,200,000
                                                                                                                                              1,000,000
    -226K                                                                                                                                     800,000
                                                                    +10K
                                     +174K                                                                                       +17K
                      +157K                                                                                                                   600,000
                                                    +200                                                                                      400,000

                                                                                  +21K           +48K                                         200,000
                                                                                                                                              -
Managers and       Professional     Associate   Administrative Skilled Trades    Personal      Sales &      Process, Plant     Elementary
Senior Officials   Occupations     Professional and Secretarial Occupations       Service  Customer Service and Machine        Occupations
                                  and Technical                                 Occupations Occupations      Operatives

                                                  Suppressed Demand                +29% higher
                                                  (10m sq ft per annum)
    The UK planning system                                                                    …the historic lack of supply has
    is restricting growth in                                                             restricted (‘suppressed’) demand by 29%
      the I&L sector by not                          Historic Demand                        nationally which should be provided
   allocating enough land in                       (34m sq ft per annum)                      for in the future. Future demand
       the right locations                                                                estimates should also consider housing,
                                                                                              e-commerce and freight growth

                                                                           4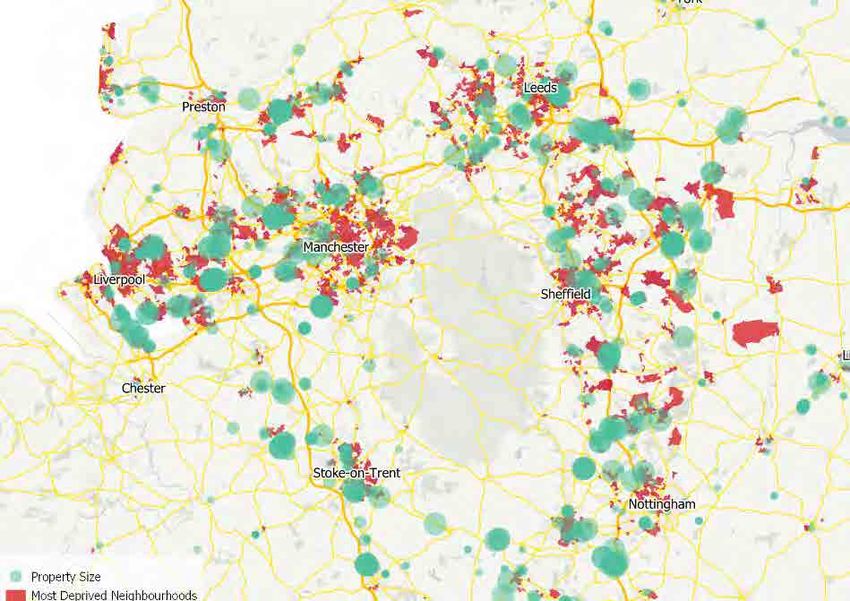
Levelling Up - The Logic of Logistics

                  Growing Social Value Credentials
I&L supply chains are far-reaching and provide significant levels of employment in addition to on-site jobs

                                                               Beside crew/drivers behind
                                                               transport, are also workers
                                                              who build or maintain the vans,
                                                                   aircrafts, trains etc.

  Most UK freight comes    Freight is handled at port                      Goods are moved mainly by HGV /             End customers
    in via ports and         / air-side sheds before                      LGV or rail to either distribution hubs     are either homes
        airports                being distributed                            (sheds) or direct to customers             or businesses

               I&L investment is helping to support the Government’s ‘Levelling Up’ Agenda

                                                                                                  Given the I&L sector’s strong
            70% of I&L demand is
                                                                                                   economic credentials and
           generated in the North
                                                                                                    growth prospects, future
              and Midlands…..
                                                                                                      I&L jobs can be crucial
                                                                                                     in bridging the GVA and
                                                                                                   productivity gap between
                                                                                                       the North and South

                                                        ide
                                                 di v
                                          ut h
                                    /So
                                r th
                           No

                                                        ….. vs only 30% in the South

                           I&L investment can aid the delivery of new housing

                                           NEW                                     NEW I&L
    I&L development                        HOUSING                                 DEVELOPMENT             NEW MOTORWAY
                                           AREA                                                            JUNCTION AND
  can contribute to the
                                                                                                           STRATEGIC LINK ROAD
 delivery of new homes                                                                                     INFRASTRUCTURE
    via the funding of                                                                                     SERVING BOTH
                                                                                                           RESIDENTIAL AND I&L
strategic infrastructure
   such as motorway
   junction upgrades
      and link roads

                                                                      5
Levelling Up - The Logic of Logistics

                          A Green Recovery ‘Boxed’
                   Carbon is present across all three phases of the property life cycle

                                                   Completion
         EMBODIED CARBON                                                                     OPERATIONAL
          and other construction                                                               CARBON
            related emissions
                                                                                        Usage of the building (heating
       Processing and transportation                                                    or cooling, lighting, appliances
             of raw materials                                                                   and equipment)

            Carbon emitted by                                                              Repair and maintenance
              construction
                                                                                                Refurbishment

                                               END OF LIFE CARBON
                                                       Demolition
                       Re
                          cyc

                                                 Disposal and transport
                             le

                                                 of materials (emissions
                                                 can be recovered if it’s
                                                   possible to recycle)
                     Demolition                                                         End of usage

               EMBODIED CARBON                                                 END OF LIFE CARBON
    I&L facilities can be built with recycled,                      Modern I&L buildings have the advantage to
          low carbon and sustainably                                be lightweight structures which are highly
                sourced materials                                        adaptable for a large range of uses

                                                               Warehouse    Temporary        Leisure/          Data         Lab
                                                                             hospital          gym            centre       space

I&L buildings are achieving outstanding results                   The steel frames used in I&L properties are
   for constructions such as net zero carbon                     much more easily recycled than concrete which
 recognition, and top EPC and BREEAM ratings                       is more common in other commercial uses

                                                           6
Levelling Up - The Logic of Logistics

          OPERATIONAL CARBON
          I&L premises are innovating to reduce carbon

                          WIND
                          TURBINES
                                                                                             GREEN ROOF
                                                             RAINWATER HARVESTING
                                     STONE WALLS
                                                                                           LED, MOTION-
                                                                                           SENSING LIGHTS
                                                                       SKYLIGHTS
                   HEDGEROWS                                                                                CO-LOCATION
                                                                                                            OF OFFICES

                                                                                                                   SMART METERS

                  POND FOR     SOLAR PVP
                  HABITAT
                  CREATION

                                                                                                                    CEMENT
                                                                                                                    ALTERNATIVES

 REGIONALLY
 SOURCED                                                                                   HGV/LGV
 PLANTING                                                                                  CHARGING POINTS
                                     OPTIMUM FACADE
                                     INSULATION
              SUSTAINABLE FACADE                                                       GEOTHERMAL
                                                                                       ENERGY
OUTDOOR GYM /
TRIM TRAIL
                                                                                   ELECTRIC CHARGING
                                                                                   STATIONS FOR CARS

                                                                                            SEATING AREA
                                              PARKING FOR
                                              ALTERNATIVE MODES
                                                                      WILDFLOWER
                                                                      MEADOW

BIRD
NESTING
BOXES
                                                                           BEEHIVES
                                                                                                                           Source: Savills

                                                                  7
Levelling Up - The Logic of Logistics

1. Introduction
The I&L sector is not only an economic powerhouse but also delivers
significant social value and is embracing innovative ways to reduce carbon

The aim of this report is to evidence the importance                      of demand. This chapter finishes by discussing a number of
of the industrial and logistics (I&L) sector to the UK, not just in       flaws in the way future demand and land needs are currently
terms of it being an ‘Economic Powerhouse’ but also in terms              assessed as part of Local Plans and how these flaws can be
of its ‘Growing Social Value Credentials’ and contribution to             addressed by using an alternative method developed by
‘A Green Recovery Boxed’. It is hoped that by reviewing the               Savills and St Modwen;
sector against economic, social and environmental
objectives, this report presents a balanced and evidential                ■ Growing Social Value Credentials discusses the
account of the sector’s future growth potential and the critical          sectors contribution to local and regional communities, the
role it can play in a post Covid and Brexit UK.                           Government’s ‘Levelling Up’ agenda and the range of jobs and
                                                                          training opportunities the sector creates as part of its wider
The intended audiences for the report are those integral to               supply chains. We also discuss how I&L developments are
the sector’s future growth and success including: national                contributing to strategic infrastructure to the benefit of new
government policy makers, local authority planners, elected               housing developments and how modern I&L premises are
members, investors and tenants, as well as those keen to                  adopting a more human-centric approach to their design; and
learn more about the sector.
                                                                          ■ A Green Recovery ‘Boxed’ outlines how the sector
The report is structured as follows:                                      is embracing sustainability via a reduction in carbon
■ An Economic Powerhouse focuses on the sector’s                          across all phases of a property’s life cycle. We discuss how
economic attributes, namely how I&L premises facilitate                   buildings are achieving net zero in construction; how carbon
modern lives and therefore should be considered as ‘Critical              can be reduced during operations through clever building
National Infrastructure,’ similar to how major roads, ports,              design solutions that improve energy supply and reduce
airports and rail freight interchanges are. We also discuss the           energy demand; and we finally consider a property’s end
sector’s contribution to the national economy and the key                 of life, exploring how I&L premises can be repurposed for
growth drivers that are underpinning record-breaking levels               other uses.

  Reader’s Note
  When we refer to the industrial and logistics (I&L) sector we mean Light Industrial (formally B1c use class now part of Class E),
  General Industry (B2 use class) and Storage and Distribution (B8 use class). Effectively the primary use classes that require
  warehouses or factories (including ancillary offices) and associated yard spaces. These use classes typically cover the diverse
  range of industrial, manufacturing and logistics companies that operate within England.

                                                                      8
Levelling Up - The Logic of Logistics
2. An Economic Powerhouse
Recent global challenges have proven that the I&L sector’s workers, stock of facilities
and distribution networks are unquestionably ‘critical national infrastructure’
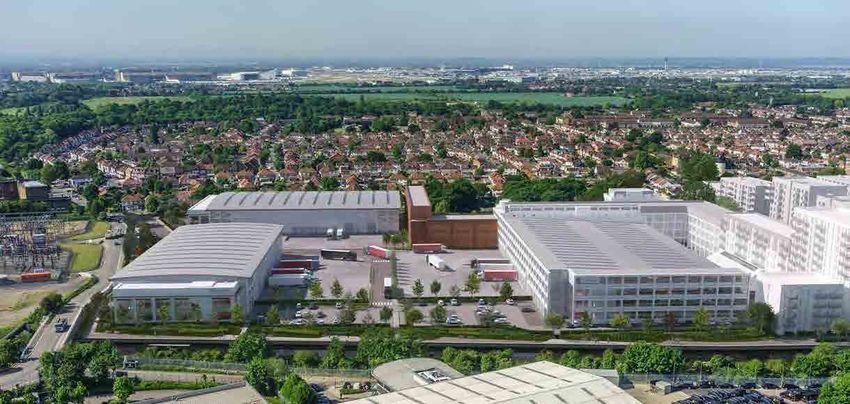
I&L facilities and their supply chains support the functioning These challenges have brought to the fore the importance
of our economy and the way we live our lives. The food we of supply chain resilience and the need for a sufficient supply
eat, the products and services we purchase, the materials of appropriately located I&L premises. For instance, during
used to build new homes and new infrastructure, even the the recent lockdowns, the I&L sector has been instrumental
vaccines that give us protection from Covid are stored, to ensure the effective delivery of medical stock in hospitals
manufactured and distributed from warehouses and factories and food supplies on supermarket shelves. As vaccines were
to ‘us’ the end customer. Without these facilities and the made available, the operation of effective distribution
increasingly efficient supply chains that link them up with networks across transport modes was fundamental to supply
suppliers and end customers, the delivery of our purchases vaccination centres while meeting stringent time frames and
would be much slower, more expensive and we would have cold-store requirements. The pandemic has indeed proven that
less choice. our daily life depends on the I&L sector. Its workers, stock of
facilities and distribution networks are unquestionably ‘critical
It can be difficult to acknowledge the critical role national infrastructure.’ The sector is also critical to the
played by the I&L sector when everything is running smoothly. Government’s ‘Levelling Up’ agenda given it is one of the few
It is much easier to understand its importance when things large sectors that invests more in the central and northern
don’t work quite as well. The six-day blockage of the Suez parts of the country rather than London and the south. We
Canal in March 2021 created a domino effect on global discuss this issue further in the ‘Growing Social Value
supply chains, which affected not only those sectors relying Credentials’ chapter.
on container shipping but also the transport sector as fuel
vessels were delayed too. The shortage of HGV drivers in The sector’s growth is critical to the UK’s
autumn 2021 led to fuel shortages in UK petrol stations future prosperity
and forced businesses to close down sites or cut product The sector is a significant employer of at least 3.8 million
lines, adding to the backlog of production caused by the people. However the true number of jobs is likely much higher
Covid pandemic. as this only relates to ‘manufacturing, transportation and
storage’1 activities. The wider supply chains of I&L businesses
9
Levelling Up - The Logic of Logistics

          Key stats: I&L sector

                                                      3.8 million                                                         £232 billion
                                                      jobs in I&L in England                                              of GVA

                                                      29% productivity                                                    14% the share of I&L in the
                                                      increase between 2025 and 2039                                      total economy in terms of GVA

                                                                                                                                              Source: ONS, Oxford Economics, Savills 2

          include other types of jobs not covered by this statistical                                 lies primarily in the different products it handles and
          classification. For instance, office based roles and professions                            distributes, I&L companies can differ greatly in terms of their
          such as product design, research & development and                                          operational characteristics and the activities conducted from
          engineering are routinely found in I&L companies but fall within                            their premises.
          the ‘professional services’ classification.
                                                                                                      Not only is the I&L sector large, at 14% of the England
          A prime example of the wider economic impacts of                                            economy, it is fast growing too. Over the last 10 years, jobs
          I&L supply chains is Amazon. In addition to the 55,000 staff3                               within the logistics part of the I&L sector have grown by
          it employs directly in the UK, the company is reported to                                   26% compared to only 14% across the economy as a whole.
          have created 175,000 jobs via the 65,000 plus small and                                     Its growth profile has been further accelerated by the Covid
          medium-sized enterprises (SMEs) who are selling                                             pandemic and Brexit as we discuss further below.
          professionally through Amazon 4. While Amazon’s diversity

               “Over the last 10 years, jobs within the logistics part of the I&L sector have grown
               by 26% compared to only 14% across the economy as a whole.”

                                          Historic Jobs Growth in England

                                                                                                                                     All jobs         Industrial      Logistics
                                    130
                                                                                                                                                                          +26%
                                    125
Indexed Growth (March 2010 = 100)

                                    120

                                                                                                                                                                          +14%
                                    115

                                    110

                                                                                                                                                                          +4%
                                    105

                                    100

                                    95

                                    90

                                          Mar   Sep   Mar   Sep   Mar   Sep   Mar   Sep   Mar   Sep    Mar   Sep   Mar   Sep   Mar    Sep       Mar    Sep    Mar     Sep     Mar
                                          10     10    11    11    12    12    13    13   14     14     15    15   16     16    17     17        18     18    19       19     20
                                                                                                                           Source: ONS, Workforce Jobs by Industry and Region, Savills

                                                                                                 10
Levelling Up - The Logic of Logistics
The sector is also highly productive with Gross Value Added ability to pay higher wages and higher tax revenues for
(GVA) 5 per job currently at £58,000, some 12% higher than the Government which can be reinvested in critical services
the average of all sectors. Its productivity is also predicted and infrastructure.
to grow at a faster pace, increasing by 29% between 2025 to
2039 compared to 18% across the UK economy as a whole 6 . The vision of the UK becoming a “high-wage, high-skill”
These are extremely important statistics given the UK’s economy was central to Prime Minister Boris Johnson’s
labour productivity currently lags many of its western Conservative Party Conference speech on the 6th October
European peers as shown in the chart below. 2021. Essential to achieving this vision will be to increase
overall labour productivity, which in turn will require further
Improving the UK’s labour productivity will become growth in the more productive parts of the economy which
increasingly important in a post Brexit world given its undoubtedly include the I&L sector.
important bearing on attracting inward investment,
Labour productivity per person employed - 2019
200.
Indexed Productivity (EU28 = 100)
180.
160.
140.
120.
100.
80.
60.
40.
m nd
B urg
Sw or m
e y
en d
Fr rk
A ce
N w ria
rla n
Ic ds
Fi d
d
(2 erm ly
te -2 y
ng )
m
M n
C alta
C hia
ov s
Po ia
Es nd
G nia
th e
ov a
rt a
om al
C nia
un ia
La ry
ul a
ria
Ki 020
Sl ru
itz wa
Li ec
ni 13 an
Sl ani
Po aki
B tvi
he e
ai
D rlan
an
an
en
R ug
H at
28 G Ita
do
N iu
a
ga
an
n
et ed
t
ga
xe ela
la
Sp
c
to
a
yp
m
us
bo
re
ro
g
el
nl
ze
u
el
Ir
S
U 0
d
Lu
EU
Source: Eurostat, Savills
11Levelling Up - The Logic of Logistics
I&L growth is being
driven by numerous factors
Not just e-commerce driving growth
While e-commerce grabs most of the headlines for driving Savills January 2022 Big Shed Briefing7 reported that 55.1
growth in the sector, there are several growth drivers at play as million sqft (gross) of warehouse space had been transacted
illustrated below. Combined, these growth drivers are resulting in 2021, setting a new annual record for take-up and being 86%
in unpreceded demand for I&L premises. above the long-term annual average.
I&L Growth Drivers
Dark Stores Housing Growth New Occupations
/Kitchens
Internet Growth in Freight
of Things
Data Centres Online Sales
Robotics &
Automation
I&L Growth Office Co-location
Stockpiling Near-shoring /
Re-shoring
Source: Savills
Growth in UK freight I&L forecasts
Freight arriving and leaving the UK
needs to be sorted, packaged and LGV Traffic Forecasts Rail Traffic Forecasts
distributed via a network of freight
handling infrastructure (i.e. ports,
airports, rail freight interchanges
and motorways) and optimally located
I&L premises in order to reach end between +74% by
customers. +25% and +108% 2043/44*
by 2050*
*from 2015 base *from 2016 base
Significant growth is forecast across
all freight modes, which will increase
demand for I&L space in the future. Global Air Freight Forecasts Port Tonnage Forecasts
I&L premises should not be seen as
separate from the infrastructure which
enables goods to be moved around the
UK, but should be considered critical
national infrastructure itself. +121% by +39% by
2039* 2050*
*from 2019 base *from 2016 base
Source: DfT, MDS Transmodal for Network Rail, Boeing, DfT, Savills
12Levelling Up - The Logic of Logistics
E-Commerce Growth
E-Commerce growth is being driven by two factors. To enable fast deliveries, stock needs to be held near the end
customer before it’s picked up for the last mile. This requires
Firstly, population growth. The UK Government has warehousing space in regional and local distribution hubs
announced a housing shortage in response to demand nearby to population centres. Large 3PLs like Amazon can
consistently outstripping supply. To address this situation, more easily fit this model within their existing operations due
the Government has set an annual housing target of 300,000 to the sheer number of deliveries that they fulfil daily and their
homes per annum in England which it is struggling to achieve huge geographic coverage. For most retailers however this
with less than 225,000 homes delivered per annum over the move will require investment in technology and upskilling of
last five years 8 . Based on current online retail spending data9 staff in addition to more warehousing space. In some cases, it
and average household size10, 300,000 homes per annum could require setting up their own delivery fleet to improve
equates to an extra £1.3 billion per annum in online retail margins, as already done by some large grocery retailers such
spending. Using the ‘warehouse to homes ratio’ discussed as Sainsbury’s, Tesco and Asda, to cope with the growing
in the BPF’s ‘What Warehouse Where?’ report 11, this level of demand for online orders.
housing growth could generate a warehouse requirement of
21 million sqft per annum on its own. Near-shoring / re-shoring
The Covid pandemic and Brexit have created major
Secondly, technological improvements coupled with disruptions for the sector’s supply chains in the form of
society’s increasing preference to purchase goods and border restrictions, lockdowns and access to labour such as
services online. Retail spending is growing faster than the rate HGV drivers. In order to minimise similar disruptions in the
of population growth (+71%12 vs +14%13 over the last 20 years). future, many UK companies are moving their operations
More of this retail spending is being conducted online, for either back to the UK or closer by. Likewise certain I&L
instance in 2006 online sales accounted for only 3% increasing activities may be re-shored to the UK as it becomes more
to 19% prior to the Covid pandemic in February 2020. The expensive to conduct business in the EU as a result of Brexit.
Covid pandemic has accelerated this growth with internet According to a survey carried out in July 2020 by the Institute
sales currently at 26%14 and forecast to grow to 37% by 202515. for Supply Management, 20% of firms are planning to or have
The growth in online shopping has significant implications on already started to near-shore or re-shore. These findings are
future I&L demand given that e-commerce requires over three corroborated by a survey carried out by Savills18 whereby over
times the logistics space compared to traditional brick-and- 80% of respondents expected the Covid pandemic to either
mortar retailers16 . ‘greatly increase’ or ‘somewhat increase’ on-shoring. This is
likely to lead to higher domestic inventory requirements,
Faster Deliveries further increasing long-term demand for I&L space.
Consumer expectations for same-day or next-day delivery
are reshaping the operating models of logistics companies.
For instance, the emergence of Zapp, Getir and Deliveroo
who deliver groceries “in minutes” while most of the major
retailers such as Boots, Next and many more deliver next day.
These trends are expected to increase demand for logistics
Definitions
space as reduced delivery times are expected to benefit Near-shoring
online retailers. Transferring a business operation to a nearby country
as opposed to a more distant one (i.e. off-shoring)
The Covid pandemic has accelerated this shift: a survey
by Bringg 17 found that since the start of the pandemic 27% Re-shoring
of retailers added same-day delivery for online orders as a Moving a business that had gone overseas back to the
fulfilment option and 1 in 3 retailers are planning to add country from which it had originally relocated
same-day delivery options in the next 6 to 12 months.
“To enable fast deliveries, stock needs to be held near the end customer before
it’s picked up for the last mile. This requires warehousing space in regional and local
distribution hubs nearby to population centres”
13Levelling Up - The Logic of Logistics
Certain I&L activities may be on-shored to the UK in
response to international supply chain disruptions
Impact of Covid-19 on supply chains and manufacturing after pandemic has passed
■ Greatly increase ■ Somewhat increase ■ No change ■ Somewhat decrease ■ Greatly decrease
80%
70%
60%
Share of countries surveyed
50%
40%
30%
20%
10%
0%
Supply chain onshoring Automation of Lean inventories
(sourcing more suppliers manufacturing (‘just in time’ production)
from the home market)
Source: Savills Research
Co-locating different business functions While the external appearance of premises occupied
As the operations of modern day I&L companies have evolved by a manufacturer may look similar to that occupied by a
via investments in automation and technology, so logistics company, their internal fit out, even a building’s
have the types of occupations found in the sector. Alongside environmental performance are increasingly tailored to
traditional roles such as factory / warehouse managers, the specific requirements of individual companies. Modern
forklift operators and delivery drivers are a diverse range of I&L premises are also found to house gyms, cafes,
new roles such as software engineers in charge of automated restaurants, game rooms, and even hairdressers and
systems, supply chain managers and data analysts. physiotherapy suites. As a result, the types of activities
undertaken, the levels of employment generated, and range
While these new and more diverse occupations are of occupations found on site are very much company specific.
the result of operational changes in the sector, these changes This diversity evident in the sector is not adequately captured
are impacting the design and composition of modern I&L via the current planning use classes or standard job densities
premises. One such change is the increased prevalence of applied to I&L developments.
office space being co-located with warehouse and
manufacturing facilities to house these new roles, but also as As detailed in our Gymshark case study below their diverse
a means of improving operational efficiency, reducing estate operations are being co-located together meaning its
costs and fostering stronger collaboration between different premises do not fit solely within either an office (E(g)(i)),
business units (see Bidfood case study). Based on Savills data research and development (E(g)(ii)), industrial processes (E(g)
tracking large units over 100,000 sqft across the UK, the (iii)), general industrial (B2) or storage and distribution (B8)
amount of office space found in I&L premises has increased use class. Nor do any of its different activities operate as
over the last five years. ancillary to one another but rather as separate components of
a collective whole.
14Levelling Up - The Logic of Logistics
Case Study: Gymshark
Gymshark is a fast growing clothing company which is production, storage, design studio, innovation and
now expanding across multiple facilities in Blythe Valley office space, meeting rooms and breakout areas.
Business Park (Solihull) to create a campus style working The building is designed to bring together these
environment. The large warehouse chosen for their new diverse uses and the people covering different roles
innovation hub provided Gymshark with the necessary to promote innovation and integration across a number
flexibility to house multiple functions, combining of functions.
Source: Gymshark
15Levelling Up - The Logic of Logistics
Case Study: Bidfood
Purpose-built for Bidfood, the 117,400 sqft premises IT, customer services and telesales personnel. The
in the Slough Trading Estate include 22,000 sqft of head remaining floorspace includes a customer presentation
office accommodation arranged across three floors suite, temperature-controlled warehouse and distribution
for marketing, commercial, quality control, finance, facility.
Source: SEGRO
Diverse and better paid occupations
The I&L sector is subject to several misconceptions Secondly, while other sectors have contracted during
about average pay levels, skills required, and types of spaces the Covid pandemic the I&L sector has continued to expand.
provided. It is not a low-paid19, low-skilled employer, in fact, Data on online job ads tracked by ONS via Adzuna indicate
the reality is very different. that job postings have increased by three times for transport &
logistics roles and two and a half times for manufacturing roles
Firstly, average pay is higher than the UK average. Data from the since the start of the pandemic 20. Two notable examples behind
Office for National Statistics (ONS) show annual wages above these statistics are the John Lewis Partnership and Amazon:
average at +£4,600 for Manufacturing and +£4,900 for Logistics.
■ The John Lewis Partnership is recruiting more than 550
I&L jobs pay more permanent full-time driver and warehouse partner roles across
its distribution centres and Waitrose.com and John Lewis.com
I&L sectors ■ All sectors customer delivery centres21; and
+ £4.6K per year + £4.9K per year
(manufacturing) (Logistics)
■ Amazon committed to recruit 20,000 temporary staff for the
busy Christmas period across its network of fulfilment centres,
sort centres and delivery stations22. These are in addition to the
7,000 permanent jobs it announced in September 202123.
“The Industrial & Logistics sector is not
a low-paid, low-skilled employer, in fact,
Source: ONS (2021) ASHE, UK Gross Annual Pay in 2020 the reality is very different”
16Levelling Up - The Logic of Logistics
I&L job adverts have increased
during the pandemic
Up to 3 x more I&L job adverts
400
Indexed Growth (February 2020 = 100)
350 Transport
& Logistics
300 X3
Manufacturing
250 X 2.5
200
150
All industries
X 1.4
100
50
0
1/30/20
2/29/30
3/31/20
4/30/20
5/31/20
6/30/20
7/31/20
8/31/20
9/30/20
10/31/20
11/30/20
12/31/20
1/31/21
2/28/21
3/31/21
4/30/21
5/31/21
6/30/21
7/31/21
8/31/21
9/30/21
10/31/21
Source: ONS (2021), Online Job Advert Estimates based on Adzuna
Thirdly, I&L jobs have become increasingly diverse over This is in response to increased automation and robotics
the last decade. At the beginning of the decade the sector in the sector and more advanced supply chain processes.
had a much more polarised distribution, with a higher share These office-based roles are increasingly co-locating
of managers at one end of the spectrum and more plant alongside production and logistics uses as it is convenient
and machinery operatives and elementary occupations at for these people to be closer to the operations they control
the other end. Today we see a higher share of Professional and analyse. This increased occupational diversity means the
and Associate Professional and Technical roles, typically I&L sector can play an important role in re-employing people
associated with higher-skilled engineering and that have lost jobs in other sectors of the economy as a result
technological professions. of the Covid pandemic.
I&L occupations are becoming more diverse
■ 2010 2019
1,400,000
-8K
1,200,000
1,000,000
-226K 800,000
+10K
+174K +17K
+157K 600,000
+200 400,000
+48K 200,000
+21K
-
Managers and Professional Associate Administrative Skilled Trades Personal Sales and Process, Plant Elementary
Senior Officials Occupations Professional and Secretarial Occupations Service Customer and Machine Occupations
and Technical Occupations Service Operatives
Occupations
Source: ONS, APS
17Levelling Up - The Logic of Logistics
Case Study: Overclockers
Overclockers is a modern British logistics and e-commerce all over the world. However, the extreme technical
success story. Initially founded in 1999 as a web retailer of personalisation service that it offers to customers –
custom ‘overclocked’ PCs, Overclockers started life trading Overclockers configures some of the world’s most powerful
from a tiny, 400 square foot warehouse in Stoke-on-Trent. personal computers – means its workforce is highly skilled,
It was, in many respects, a precursor to the personalisation with a significant proportion of the team hired as
and e-commerce boom that has transformed the way apprentices and trained on the job.
Britain likes to shop today. In 2021, following phenomenal
business performance during the pandemic, which saw Employing and nurturing a highly skilled, local workforce
record demand for high performance computers, gaming is not the only service that Overclockers provides to society.
hardware, and personalisation in the era of working-from- Some of its clientele include police forces, who require
home, Overclockers now employs 107 staff across three especially powerful computers to help them solve crimes,
areas and will soon move into a new, 100,000 square foot Formula One teams, who operate right at the cutting-edge
St. Modwen built warehouse. of technology and data, and universities, who have an
increasing need for ever-more-powerful computers to help
Overclockers is a traditional logistics business in the sense them find solutions for some of the world’s most pressing
that it receives and ships products to and from Europe, and issues, including climate change.
Source: St Modwen
18Levelling Up - The Logic of Logistics
The UK planning system is restricting growth ■ Ensuring Local Plans allocate sites in the right locations
The strong growth expected in the I&L sector, and to respond to a broad range of market needs;
the jobs, investment and productivity it will bring, will not
materialise unless sufficient land is allocated in the right ■ Modernising Employment Land Reviews to allow for the
locations. The planning system is the guardian for allocating utilisation of ‘real time’ information so that they can be kept
land, therefore it is critical the employment evidence which up to date; and
support Local Plans do a more accurate job at assessing
future demand. ■ Introducing an Employment Land Delivery Test to ensure
that a commensurate amount of employment land is brought
This issue has been central to the recommendations of other forward to counterbalance housing and that any employment
BPF publications, most recently the BPF’s Employment Land land lost to other uses is delivered in the right locations. If a
Manifesto which recommends: local planning authority failed to meet the delivery test, a
presumption in favour of sustainable logistics development
■ Introducing a Presumption in Favour of Logistics Development could be engaged.
within the NPPG when precise criteria are met. This is needed
as Local Plans can take years to be adopted and therefore are
completely out of kilter with the pace of market changes;
The attributes of an optimal I&L location
Motorway / A-road Access Ability to Serve Markets Access to a Proximity
within 2h Drive Good Workforce with to Amenities
a Range of Skills
Intermodal Facilities Good Availability of Utilities, Ability to Operate 24/7 Good, Level
Services, Broadband without Impediments Developable Site
Source: Savills
Although the National Planning Policy Framework (NPPF) ensuring I&L needs are met. As a consequence, an array
provides a clear and positive policy context to assessing future of local authority strategies are being adopted resulting, in
economic needs, the Planning Practice Guidance that most cases, too little land being allocated to meet current and
accompanies the NPPF lacks the same clarity. Economic need future market demand. This is primarily due to these strategies
plays second fiddle to housing need in the guidance, the latter being backwards looking and projecting forward historic
being subject to a standard methodology with a series of trends as a proxy for future demand. As a result, modern day
unambiguous steps set out to establish the minimum annual growth drivers are not taken into account, for example: housing
housing need for each local authority area. growth, online retailing growth, increasing UK freight volumes
and the need for larger premises, all of which generate
There is specific reference to the critical role of logistics and the increased demand for I&L land and floorspace. The main NPPG
need for market analysis and engagement with stakeholders, methods for estimating future land needs and their deficiencies
but the guidance fails to provide a clear and robust approach to are summarised below.
19Levelling Up - The Logic of Logistics
The UK planning system is restricting growth
in the I&L sector by not allocating enough
land in the right locations
Current NPPG methods are not fit for purpose
Project forward future demand based on Underestimates future need as the I&L
either historic completions or historic net sector has been supply constrained
absorption (take up) for the majority of the last decade
Consultations with relevant organisations, Not sufficient on its own, most agents don’t
studies of business trends, and take longer term view which are essential
understanding of innovative and changing to forecasting employment land need.
business models Transactional focus, not land focus
Demographically derived assessments of Housing growth at the local level has no
current and future local labour supply > relationship to I&L markets which have a
usually look at housing growth either more regional demand profile. A local focus
within LA or wider FEMA restricts need
Use 3rd party job projections such as No transparency and therefore limited
Oxford Economics, Experian, etc. and scrutiny. Do not have a land focus which is
translate into floorspace requirement the core requirement to facilitate I&L growth
Source: Savills
The inadequacies of these models and their application is Crisis (GFC). The key reason why leasing demand was higher in
evident in that supply historically has not kept pace with 2012-2014, despite the impact of the GFC, is that sufficient
demand. When demand cannot be fully satisfied occupiers available supply existed to accommodate demand, even
vie for limited available space pushing up rents. This is what though overall demand was weaker compared to the more
we have seen over the last decade with 61% rental growth24, recent period post 2015. After 2015, available supply has been
more than double the rate of inflation. well below the equilibrium rate of 8% which has suppressed
overall demand as it could not all be accommodated.
At the national level, the market equilibrium level where
supply and demand are broadly in balance and rents are more A further clear indicator of demand exceeding supply is strong
stable is around 8% availability. This benchmark rate is found rental growth. As can be seen from the bottom part of the chart
in a number of prominent publications such as the GLA’s Land real rents25 have been growing strongly since 2015 when
for Industry and Transport Supplementary Planning Guidance availability dropped below 8%. This is distinct from the period
(SPG). England’s I&L market has been below this level for over after the GFC (2012-2014) when real rental growth was either
seven years clearly demonstrating the failure of the current negative or zero, indicating there was more than enough supply
NPPG methods in estimating demand accurately. Put another to meet demand.
net absorption is a leading measure of demand, comparing
occupied space (move-ins) versus vacated space (move-outs).
This relationship between supply and demand is clearly shown
in the chart below. When available supply was higher at around
Definitions
10%-12% in 2012-2014 net absorption averaged 47 million sqft Net absorption is a leading measure of demand,
per annum (net). This is higher than the average net absorption comparing occupied space (move-ins) versus vacated
more recently from 2015-2020 at 34 million sqft (net) despite space (move-outs).
the UK only having just emerged from the Global Financial
20Levelling Up - The Logic of Logistics
Historic supply constraints have suppressed demand
Net absorption Sqft Average 2012-2014 Average 2015 onwards Availability % Rental growth %
30m 14%
Higher net absorption when
availability above 8%
25m 12%
In years of availability below
20m 8%, tighter supply has 10%
Global Financial Crisis suppressed demand
15m 8%
Sqft millions
10m 6%
5m 4%
0 2%
-5m 0%
The tight supply has resulted in
-10m strong rental growth as occupiers -2%
Negative real rental growth
when available supply is high compete for limited stock
-15m -4%
2009 Q2
2009 Q3
2009 Q4
2010 Q1
2010 Q2
2010 Q3
2010 Q4
2011 Q1
2011 Q2
2011 Q3
2011 Q4
2012 Q1
2012 Q2
2012 Q3
2012 Q4
2013 Q1
2013 Q2
2013 Q3
2013 Q4
2014 Q1
2014 Q2
2014 Q3
2014 Q4
2015 Q1
2015 Q2
2015 Q3
2015 Q4
2016 Q1
2016 Q2
2016 Q3
2016 Q4
2017 Q1
2017 Q2
2017 Q3
2017 Q4
2018 Q1
2018 Q2
2018 Q3
2018 Q4
2019 Q1
2019 Q2
2019 Q3
2019 Q4
2020 Q1
2020 Q2
2020 Q3
2020 Q4
2021 Q1
2021 Q2
2021 Q3
Source: Savills
To help address the supply / demand imbalance Savills and Next, you calculate the average of the ratio between net
St Modwen have developed a new methodology built upon absorption and available floorspace for every year over the
the principle of ‘suppressed demand’ that accounts for lookback period. This ratio is then applied specifically to the
demand that has been lost due to supply shortages. The availability uplift that was needed in those years of tight supply
calculation of suppressed demand can then be added to to reach the equilibrium rate. This provides a suppressed
historic demand projections to give a more accurate picture demand calculation for each year when actual availability was
of likely demand into the future. lower than the equilibrium rate. These are then added together
to give a total suppressed demand over the lookback period.
The high level steps in the Savills / St Modwen employment
land estimation model includes: D. Add suppressed demand to historic trend: Finally the
suppressed demand is added to the historic demand over the
A. Find a market’s equilibrium availability rate: This is lookback period. The annualised figure of this combination
around 8% at the national level but can alter slightly from can then be projected forward over the Local Plan period to
market to market. A market’s equilibrium rate is either when provide a more accurate estimate of future demand.
rents are broadly stable or when rental growth transitions
from being negative or stable to growing strongly year on year. This methodology when run at the England level estimates
future demand will be at least 29% higher than historic levels,
B. Identify those years when available floorspace was equating to a minimum of 44 million sqft per annum (net).
below the equilibrium rate: This involves identifying A useful cross reference to make here is with the BPF’s previous
previous years when availability was below the 8% report ‘What Warehouse Where?’ which estimated each home
equilibrium rate. could generate a need of 69 sqft of warehouse space or
21 million sqft per annum based on the Government’s annual
C. Calculate suppressed demand: Here you calculate how housing target of 300,000 homes. While Savills calculations
much demand the market should have had in those years of are for both warehousing and industrial demand (i.e. the entire
tight supply in order to be at the equilibrium rate. For instance, I&L sector), this comparison usefully gives an idea of the
if the equilibrium rate is 8% but the market had 5% in a given significant contribution warehouse needs from new homes
year, the 3% difference needs to be translated into floorspace. will make to overall future I&L demand (of up to 48%).
If supply improves in England, future demand p.a. (net)
will be at least 29% higher than historic levels
■ Historic Demand ■ Suppressed Demand
34 million sq ft 10 million sq ft
Source: Savills
21Levelling Up - The Logic of Logistics
Savills has tested its suppressed demand model across 19 key be planned for in the future within each market above historic
I&L markets in England. Many of these markets have historically levels. While these results are based on wider market areas
experienced leasing demand well beyond the supply of made up of a collection of local authorities, the model can be
available land and floorspace. The percentages on the table run at the national level, the individual local authority level as
indicate how much additional demand (as a minimum) should well as more bespoke market areas.
Markets Tested for Suppressed Demand in England
Supressed
Market demand
uplift %
The Humber
A1/A614 38%
Preston
Leeds
A14/A1(M) 9%
Blackburn/M65
Birmingham/M65 29%
Manchester
Blackburn/M65 30% Liverpool Sheffield/Doncaster
Corby 70% Warrington
Coventry 21%
A1/A614
Derby 30%
Nottingham/M1
Leeds 42%
Liverpool 7% Stoke/Stafford
Derby
Luton 72%
Manchester 35%
Leicester
Northampton 20%
Birmingham
Nottingham/M1 28% Coventry Corby
Preston 32% A14/A1(M)
Sheffield/Doncaster 27% Northampton
Stoke/Stafford 29%
The Humber 24% Luton
Warrington 6%
Contains OS data © Crown copyright and database right 2019
Source: Savills 2021
The above suppressed demand figures should be and future demand drivers, the key ones, as discussed
considered minimums as their focus is on correcting above, being online retailing growth and growth in freight
past trends by accounting for lost demand due to historic volumes. Savills has developed a method for calculating
supply constraints. This more accurate historic trend these factors too (please see below contact details for
should also be uplifted further to account for current day further information).
For further information on the Savills/St Modwen methodology, please contact either:
Mark Powney
Director - Economics, Savills
mark.powney@savills.com
Irene Guillet
Associate - Economics, Savills
irene.guillet@savills.com
Richard Hickman
Head of Planning – Industrial & Logistics, St Modwen
rhickman@stmodwen.co.uk
22Levelling Up - The Logic of Logistics
3. Growing Social
Value Credentials
I&L development generates direct and indirect jobs and substantial social value
in the form of training and apprenticeships
The social value of I&L supply chains
I&L developments generate significant jobs and economic delivered between their suppliers and end use customers.
benefits as part of their wider supply chains in addition to This creates the need for drivers of Heavy Goods Vehicles
on-site employment. In turn, these economic benefits create (HGVs) and Light Goods Vehicles (LGVs). LGV licences alone have
social value in the form of apprenticeships, training and increased by 83% over the last two decades26 in response to
upskilling opportunities for local people. the rise in online shopping and subsequent expansion of the
I&L sector. This increase in HGVs and LGVs creates jobs involved
I&L jobs range from entry level graduates to highly skilled in their manufacture, maintenance and repair.
engineering and management roles. This wider supply chain
employment is often overlooked in favour of the higher on-site The growth of the UK’s freight industry also creates significant
job densities for retail and office uses. However, in many cases, jobs. I&L premises are a critical link in the chain alongside the
the office and retail jobs envisaged in Local Plans are not key freight modes that allow goods to enter, leave and move
created given these uses are unviable to build in many around the country (i.e. ports, airports, rail freight interchanges
locations throughout the country. and motorways). Like warehouses and factories, these freight
handling facilities generate employment to drive the planes,
In terms of wider supply chain employment, production trains and boats, as well as jobs involved in their maintenance
plants and warehouses require goods to be transported and and repair. Jobs are also created at ports, airports and rail
freight interchanges as part of their operation.
Employment within wider I&L supply chains
Beside crew/drivers behind
transport, are also workers
who build or maintain the vans,
aircrafts, trains etc.
Most UK freight Freight is handled at port Goods are moved mainly by HGV / End customers
comes in via ports / air-side sheds before LGV or rail to either distribution hubs are either homes
and airports being distributed (sheds) or direct to customers or businesses
Source: Savills
As discussed above, the sector has also increased its share management, engineering linked to the sector’s increased
significantly of professional occupations (plus 157k) and automation, sales and marketing and even research and
associate professional and technical roles (plus 174k) over the development into future advancements such as drone
last decade. Many of these roles are involved in supply chain deliveries and autonomous driving vehicles.
23Levelling Up - The Logic of Logistics
The sector also generates significant construction and per annum27. Based on Savills research on local procurement
apprenticeship roles which will increase further as it expands benefits, we expect this construction programme to generate
into the future. As discussed earlier, Savills estimates future I&L £440 million of social value benefits for local communities28.
needs in England to be at least an additional 44 million sqft (net)
per annum. This is an uplift of 29% against the historic 10-year The I&L sector also delivers on average 41,100 apprenticeship
trend and accounts for suppressed demand (i.e. demand that starts per annum29. This is particularly important given the
has not been accommodated historically due to the lack of high levels of youth unemployment in England which currently
available supply). This future demand, if facilitated via the stands at 14.6% 30. If the sector is able to expand consistent
bringing forward of ample land supply, will give rise to a vast with Savills estimate of future demand, the number of
construction programme that will support 45,400 jobs per apprenticeships could grow to 53,000 starts annually; which is
annum. Of these, 400 construction apprenticeships will be equivalent to over half a million apprenticeships over the next
created each year, delivering a social value of over £7.8 million 10 years.
Case Study: From unemployed to full-time, permanent employee
Jehan’s journey to employment shows her determination
to seize the opportunity enabled by I&L development at
Hinckley Park and Mercia Park. Below are some excerpts
from Jehan’s story as told on winvic.co.uk.
“Back in April 2019 I was unemployed and my Jobcentre
Plus assessor told me about a jobs fair that was taking
place. I spoke to a number of different organisations and
businesses there but one offering that really caught my
attention was a training course being offered by North
Warwickshire and South Leicestershire College, IM
Properties, Winvic and a local groundworks subcontractor,
which focused on groundworks and health and safety. […]
I was accepted onto the three-week course and in June
2019 I walked into a college classroom as the only female
out of 22 attendees – I didn’t feel apprehensive about this,
but instead, I thought, prove you can do it and see what
happens. The first week focused on employability skills,
such as interview techniques, the second was all about
groundworks – and this was all on-site at Hinckley Park as
the earthworks were being undertaken there – and the last Goodhead, a position at IM Properties site, Mercia Park was
was back in the classroom for health and safety training, mentioned to me. I had an interview with my now Project
sitting exams and a job interview with a Winvic Manager Frank Hayes and HSEQ Manager David Powell,
groundworks subcontractor on the project.” I’m happy to say that I’m now an Assistant Site Manager.
I’ve now undertaken my Fire Marshal, Fire Co-ordinator,
Upon completion of the course, Jehan obtained her CSCS First Aid, IPAF, cherry picker, scissor lift and Confined Space
card, an employability certificate and a City and Guilds Management training and I’m about to undertake my
Level 1 in Health and Safety. The subcontractor she had the Temporary Works Co-ordinator Training and NEBOSH,
interview with passed on her CV to their network and in which I’m hoping to complete it over six to eight weeks via
November 2020 Jehan was invited to an interview with distance learning.
Winvic’s HSEQ Director Ian Goodhead, for a Covid Marshal
role at the fit-out project at Hinckley Park. A week later she In one way it’s still hard to believe that a three-week
was already on site to start her new job. training course through attending a jobs fair has really led
me to a complete career change, a stable job in an area I
After her Covid Marshal role ended she started to look for was interested in and that it’s with a successful and
other options. “When discussing potential options with Ian supportive company!”
Source: https://www.winvic.co.uk/news/how-laying-social-value-foundations-constructs-new-careers-meet-jehan-our-latest-assistant-site-manager/
24Levelling Up - The Logic of Logistics
Case Study: GLP Centre of Logistics Education & Research (CLEAR) at Magna Park Lutterworth
The Centre for Logistics, Education and Research (CLEAR) is based, facility based or online learning options. Delivery of
a research, innovation, education, and training facility that is training will be by North Warwickshire and South
being developed through a partnership between industry Leicestershire College (NWSLC) and Aston University,
and education in Magna Park, Lutterworth. CLEAR will provide working in partnership to ensure that CLEAR offers
skills training and professional development at all levels training pathways of progression. Together they have
across the spectrum of logistics and supply chain roles, complementary skills and expertise that allows for the
creating training pathways of progression for new entrants ‘one stop shop’ delivery of a fully integrated and holistic
and established talent alike. The centre will give students the programme of applied research, education, training and
opportunity to learn while they earn via a portfolio of work professional development.
Source: https://www.nwslc.ac.uk/, GLP
Case Study: Prologis Education Hub at DIRFT
The Education Hub is a 9,551 sqft centre
for logistics training and education that
can be used by occupiers at Daventry
International Rail Freight Terminal (DIRFT).
The building has three distinct areas, a
reception and café, three flexible training
rooms and three smaller meeting rooms.
The Hub is also home to the Prologis
Warehousing and Logistics Training
Programme (PWLTP), a digital learning
and development programme aimed at
training those leaving education and
re-skilling the unemployed by equipping
them with the knowledge needed to
pursue a career in logistics.
Source: Stephen + George 31, Prologis
25Levelling Up - The Logic of Logistics
The I&L sector can play a pivotal role as part
of the Government’s levelling up agenda
The Levelling Up Agenda over the last five years. As discussed above the sector
Traditionally, there has been a North-South divide in the provides a diverse range of jobs with higher levels of pay
UK whereby regions in the South 32 perform better across a and GVA compared to the ‘all sector’ average. These jobs
number of socio-economic indicators compared to regions will be crucial in bridging the GVA and productivity gap
in the North 33. The Government has repeatedly tried to between the North and South.
address this issue for a long time with initiatives aimed at
‘rebalancing’ the economy and a Levelling Up White Paper Another key focus is to provide better job opportunities for
due to be published in the coming months. deprived communities outside the South East. The chart
below shows that the hotspots for I&L investment over the
The I&L sector can play a pivotal role as part of the last five years are located nearby to deprived communities
Government’s levelling up agenda. In GVA terms, the South demonstrating the important role the sector can play in
accounts for 63% of England’s total GVA while the North providing access to local jobs.
accounts for only 37%. However, over the last five years I&L
demand (net absorption) in the North has accounted for The Planning System is starting to recognise the
70% of the country’s total demand. Looking at a more link between I&L jobs and helping address deprivation.
granular level, a region such as the East Midlands that For example, in a recent called-in decision 36 for an I&L
accounts for 7% of the country’s GVA, has attracted 19% development in St Helens, the Secretary of State agreed
of the country’s I&L demand in the last five years. with the Inspector that the jobs brought about by the
development “would have a tangible benefit to the local
This strong growth in I&L in the North equates to circa 113 economy and would provide an early opportunity to help
million sqft of net additional floorspace 34 or 117,000 jobs 35 address […] deprivation issues”.
I&L investment is located nearby deprived areas in the North
Recent I&L development
Contains OS data © Crown copyright and database right 2019
■ Most Deprived Neighbourhoods
Source: Savills 2021
26You can also read