Plug-in Hybrid Electric Vehicle Research Project - Phase Two Report - The ...
←
→
Page content transcription
If your browser does not render page correctly, please read the page content below
A report by the University of Vermont Transportation Research Center

 Plug-in Hybrid Electric
 Vehicle Research Project
 Phase Two Report

 Report # 10-001 | April 2010


UVM TRC Report # 10001 Plug‐in Hybrid Electric Vehicle Research Project: Phase II Report UVM Transportation Research Center March 25, 2010 Prepared by: Jonathan Dowds, Graduate Research Assistant, RSENR Paul Hines, Assistant Professor, CEMS Chris Farmer, Graduate Research Assistant, CEMS Richard Watts, Research Director, TRC Steve Letendre, Associate Professor, Green Mountain College Transportation Research Center Farrell Hall 210 Colchester Avenue Burlington, VT 05405 Phone: (802) 656‐1312 Website: www.uvm.edu/transportationcenter
UVM TRC Report # 10001 Acknowledgements The Project Team would like to acknowledge the support of Central Vermont Public Service, Green Mountain Power, Burlington Electric Department and the Vermont Department of Public Service in funding and supporting this work. Disclaimer The contents of this report reflect the views of the authors, who are responsible for the facts and the accuracy of the data presented herein. The contents do not necessarily reflect the official view or policies of the UVM Transportation Research Center. This report does not constitute a standard, specification, or regulation. i

UVM TRC Report # 10001 Table of Contents DISCLAIMER ...................................................................................................................................................................... I LIST OF FIGURES ..............................................................................................................................................................IV EXECUTIVE SUMMARY .............................................................................................................................................1 1. INTRODUCTION ..................................................................................................................................................3 1.1. ORGANIZATION OF THIS REPORT .......................................................................................................................4 1.2. OVERVIEW OF PRIOR RESEARCH .......................................................................................................................4 1.2.1. DISTRIBUTION OF PRIMARY ENERGY CONSUMPTION ...................................................................................4 1.2.2. GASOLINE DISPLACEMENT ..............................................................................................................................5 1.2.3. NET CHANGE IN GREENHOUSE GAS EMISSIONS .............................................................................................6 1.2.4. SUPPLY ADEQUACY FOR PHEV CHARGING....................................................................................................8 1.2.5. LIFETIME OPERATING COST RELATIVE TO ALTERNATIVES ........................................................................ 10 1.2.6. ECONOMIC POTENTIAL OF VEHICLETOGRID INTEGRATION ................................................................... 10 2. PHEV POLICY .................................................................................................................................................... 12 2.1. BACKGROUND.................................................................................................................................................. 12 2.2. METHODS .......................................................................................................................................................... 14 2.2.1. POLICY FRAMEWORK.................................................................................................................................... 14 2.3. ANALYSIS OF EXISTING AND PROPOSED POLICIES IMPACTING PHEV SALES ........................................... 14 2.3.1. FEDERAL POLICIES ........................................................................................................................................ 15 2.3.2. STATE POLICIES ............................................................................................................................................ 17 2.3.3. PROPOSED POLICIES IMPACTING PHEV CHARGING .................................................................................. 19 2.4. CONCLUSIONS & FURTHER RESEARCH ........................................................................................................... 20 3. PHEVS AND CAPANDTRADE ..................................................................................................................... 21 3.1. METHODS ....................................................................................................................................................... 22 ii
UVM TRC Report # 10001 3.1.1. ADDITIONAL DEMAND DUE TO PHEV CHARGING ..................................................................................... 23 3.2. RESULTS ........................................................................................................................................................... 25 3.3. DISCUSSION .................................................................................................................................................. 28 3.4. CONCLUSION .............................................................................................................................................. 28 4. MODELING THE IMPACT OF INCREASING PHEV LOADS ON THE DISTRIBUTION INFRASTRUCTURE .................................................................................................................................................. 29 4.1. POTENTIAL DISTRIBUTION SYSTEM IMPACTS .................................................................................................... 29 4.2. THE PHEV DISTRIBUTION CIRCUIT IMPACT MODEL (PDCIM) .................................................................... 31 4.2.1. STEP ONE: DEVELOPING THE BASELINE DEMAND PROFILE ....................................................................... 32 4.2.2. STEP TWO: ADDING PHEV DEMAND .......................................................................................................... 33 4.2.3. STEP THREE: POWERFLOW CALCULATIONS. ............................................................................................. 33 4.2.4. STEP FOUR: SETTING THE PHEV CHARGING PATTERNS ........................................................................... 34 4.2.5. STEP FIVE: TRANSLATING HOURLY LOADING TO EXPECTED LIFETIME ..................................................... 34 4.3. THE TEST CIRCUIT AND RESULTS ........................................................................................................................ 36 4.4. CONCLUSIONS ................................................................................................................................................. 39 5. VEHICLETOGRID OPPORTUNITIES IN VERMONT ............................................................................. 40 5.1. RECENT V2G LITERATURE REVIEW AND PROJECTS UPDATES ....................................................................... 40 5.2. V2G RESOURCE ASSESSMENT IN VERMONT ................................................................................................. 43 5.2.1. PHEV MARKET PENETRATION MODEL ...................................................................................................... 43 5.2.2. V2G RESOURCE ASSESSMENT ...................................................................................................................... 47 5.3. THE NEW ENGLAND MARKET FOR ANCILLARY SERVICES............................................................................. 51 5.3.1. NEW ENGLAND ANCILLARY SERVICES MARKET ......................................................................................... 52 5.3.2. REGULATION SERVICES ................................................................................................................................ 53 5.4. CONCLUSION ................................................................................................................................................... 57 6. REFERENCES ..................................................................................................................................................... 58 iii
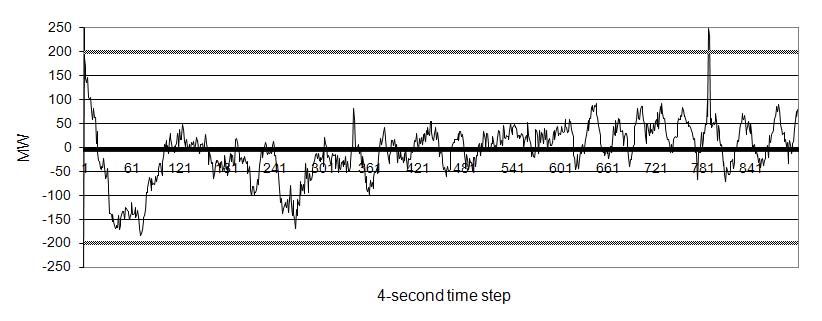
UVM TRC Report # 10001 List of Tables Table 2‐1. Anticipated release dates for several PHEVs. .............................................................................. 13 Table 2‐2. Federal PHEV Related Policies...................................................................................................... 15 Table 2‐3. State PHEV Related Policies .......................................................................................................... 18 Table 3‐1. PHEV Penetration Scenarios Modeled .......................................................................................... 24 Table 4‐1. PDCIM Inputs, Outputs, and Notation .......................................................................................... 31 Table 5‐1. Electric Range, MWP, and Annual Full Charges Assumptions ...................................................... 46 Table 5‐2. Plug Connection Assumptions and Charging Rate/V2G Power Output ........................................ 47 Table 5‐3. Estimated V2G Power Output for AEV Fleets in Vermont (MW) .................................................. 48 Table 5‐4. Hourly Contract to Dispatch Ratios for Regulation Up & Down, ISO New England ...................... 56 List of Figures Figure 1‐1. Fuel displacement from PHEVs with varying all‐electric ranges................................................... 6 Figure 1‐2. Change in GHG Emissions. ............................................................................................................ 7 Figure 1‐3. Currently supportable PHEV fleet penetration assuming optimimal charging patterns............... 9 Figure 1‐4. Estimated annaul value of V2G services from a single vehicle. .................................................. 10 Figure 3‐1. Baseline Supply Curve. ................................................................................................................ 25 Figure 3‐2. Electricity demand curves. .......................................................................................................... 26 Figure 3‐3. Estimated change in average fuel costs under various PHEV charging scenarios. ..................... 26 Figure 3‐4. Distribution of marginal fuel costs for each of the modeled PHEV charging scenarios. ............ 27 Figure 3‐5. Carbon price in $/Ton CO2 for all PHEV charging scenarios. ...................................................... 27 Figure 4‐1. Transformer Aging. ..................................................................................................................... 36 Figure 4‐2. Hourly Circuit Loading................................................................................................................. 37 Figure 4‐3. Load duration curve for the GMP test circuit. ............................................................................ 37 iv
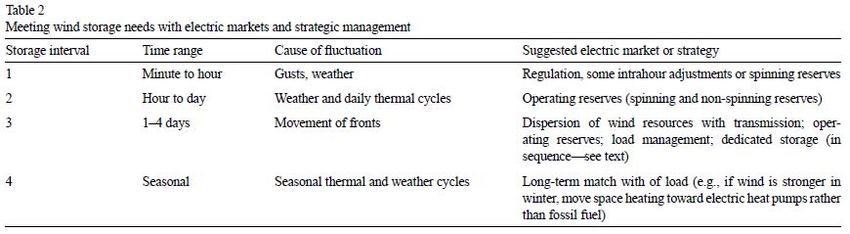
UVM TRC Report # 10001 Figure 4‐4. Load duration curves for one underground distribution cable .................................................. 37 Figure 4‐6. Percent increase in average loading for all the components ..................................................... 38 Figure 4‐5. Load duration curves for one transformer .................................................................................. 38 Figure 5‐1. Projected Number of Advanced Electric Vehicles in Vermont 2010 – 2030. ............................. 44 Figure 5‐2. Onboard Energy Storage Capacity of AEVs from 2010 – 2030 (kWh). ....................................... 45 Figure 5‐3. Total Annual Energy Consumption for AEV Charging in Vermont 2010 – 2030. ........................ 46 Figure 5‐4. Energy Storage Capacity of AEV Fleet in Vermont 2015 – 2030................................................. 48 Figure 5‐5. Time Interval for Various Fluctuations in Power Output. ........................................................... 50 Figure 5‐6. Projected SOC of V2G Fleet vs. Normalized Load Duration Curve. ............................................ 51 Figure 5‐7. Potential Annual V2G Gross Revenue Providing Ancillary Services............................................ 53 Figure 5‐8. Regulation Requirement versus Regulation Use, March 3, 2008 (7:00 a.m.)............................. 54 Figure 5‐9. Regulation Requirement versus Regulation Use, March 3, 2008 (7:00 p.m.). ........................... 55 v
UVM TRC Report # 10001 Executive Summary This report contains five substantive sections describing plugin hybrid electric vehicle (PHEV) related research conducted over an 18month period by faculty and graduate students at the University of Vermont. Funding for these separate but related projects was provided by the Transportation Research Center, electric utilities, and Vermont State Agency partners. Section 1.2 of this report presents a literature review of prior studies regarding the proportion of miles driven under gasoline and electric power respectively, the resulting gasoline displacement and net change in greenhouse gas (GHG) emissions associated with PHEV operation, the generating capacity available to charge PHEVs and vehicle lifetime ownership costs. Section 2 is an analysis of state and federal policies to enhance the economic competitiveness of PHEVs. Two models of the impact of electricity demand for PHEV charging are described in Sections 3 and 4. The first of these models looks at the impact of this additional electricity demand on carbon allowance prices and generating costs under an electricity sector only capand trade program while the second explores its impact on medium voltage distribution circuits. Section 5 estimates the economic potential for bidirectional interfacing between vehicles and the grid, a concept know as vehicletogrid or V2G, in Vermont. The key findings are listed here and in more detail following each section. Key findings State and federal policies to enhance the economic competitiveness of PHEVs (Section 2, pages 1220) A range of near term policy options are available that can make PHEVs cost competitive with other vehicles on the market. Many of these policy options have only recently been implemented or are only currently under active development. Though reducing greenhouse gas emissions from transportation is a key component of most if not all state Climate Action Plans, state level policies promoting PHEV cost competitiveness are in their infancy. Modeling the electricity demand for PHEV charging (Sections 3 & 4, pages 2139) The results in Section 3 indicate that PHEV demand would increase CO2 emissions allowance prices when the electricity sector has a GHG cap but the transportation sector does not. In this case switching energy consumption from the liquid fuels sector to the electricity sector, as occurs with PHEV deployment simultaneously reduces overall CO2 emissions and drives CO2 allowance prices up in the electricity sector. In the model described here, a 5% deployment of PHEVs would increase the price of CO2 allowances from $3.4 to $8.4, increasing electricity costs by about 1.4%. These results suggest that an electric sector only cap, such as the Regional Greenhouse Gas Initiative (RGGI), creates a perverse incentive against potentially environmental beneficial fuel switching from gasoline toward electricity. An economywide cap on CO2 emissions, which was tradable among sectors, would not have this effect. Section 4 model findings indicate that the deployment of PHEVs in a distribution circuit will have diverse effects on the distribution infrastructure. Careful modeling of these impacts can be valuable in the
UVM TRC Report # 10001 development of utility operations and maintenance plans given potential increases in demand due to PHEV or EV deployment. Economic potential for VehicletoGrid services in Vermont (Section 5, pages 4058) Vermont consumers will likely have the option to purchase a plugin vehicle within the next few years. These vehicles in aggregate represent a relatively small addition to Vermont’s total electricity load, in the range of 1 percent to 8 percent of the total energy consumed in Vermont in 2005. However, when the vehicle fleet is viewed as a V2G resource the potential is significant. By 2020, an allelectric vehicle fleet in Vermont could represent a power resource of 300 MW with the ability to store 1,000 MWh of energy. This new resource could be used in a variety of ways to enhance the reliability of the Vermont grid and to assist with the integration of intermittent sources of energy like wind and solar. Findings suggest that the use of V2G resources is best suited for the high value grid support service known as regulation. Based on analyses presented here, a V2Gequipped vehicle could potentially generate between $1,000 and $2,000 in gross revenue annually. 2
UVM TRC Report # 10001 1. Introduction Several political, economic and environmental factors are contributing to increasing interest in alternative vehicle technologies. These factors include rising global demand for oil, concomitant increases in fuel prices and anthropogenic climate change [1, 2]. Rising global demand for oil has both economic and political consequences. Increasing demand has a direct economic impact via increased commodity prices as well as a number of geopolitical implications that create political challenges for countries that rely on imported oil for economic activity. Moreover, evidence of the increasing dangers posed by climate change adds to the urgency to reduce the greenhouse gas (GHG) emissions from all sources. GHG emission from the transportation sector are growing more rapidly than from any other economic sector and accounted for 28% of total US GHG emissions in 2004 [3]. The plugin hybrid electric vehicle (PHEV) is one technology that is nearing commercial deployment and has the potential to address all three of these issues to varying degrees. PHEVs, like current hybrid electric vehicles (HEVs), are equipped with an internal combustion engine, an electric motor and a battery that can be charged both via regenerative braking and by a generator driven by the internal combustion engine. In contrast to current HEVs, however, PHEVs have much greater battery capacity and, most importantly, the capacity to charge the battery from external electricity sources, including the electrical grid [1]. The ability to charge directly from the electrical grid means that PHEVs can displace a portion of the fossil fuels used in the transportation sector. In addition to reducing the absolute volume of oil consumed, this displacement can cause a net reduction in GHG emissions, depending on the performance of the PHEV and the GHG intensity of the electric source. Most major automobile manufacturers are currently developing PHEVs and several including GM, Toyota and Ford have announced plans to bring them to market within the next two years [1, 4]. BYD, a Chinese manufacturer, has been selling the F3DM PHEV in China since December 2008. Given their nearterm deployment it is especially critical for policy makers and electricity industry members to understand the environmental, economic and grid impacts of widescale PHEV adoption will bring in order to develop strategies that allow for a smooth transition to the use of grid power to supplement traditional liquid fuels . PHEV research has or is being conducted at five national laboratories (Oak Ridge, Pacific Northwest, Argonne, Idaho, and the National Renewable Energy Laboratory) and at a number of universities, utilities and car manufacturers resulting in a growing body of information on the generating capacity available to charge PHEVs, PHEV oil displacement, life cycle emissions and operating costs. This report builds on this existing research by addressing a number of questions that have not been adequately answered in existing published literature. Specifically we address questions related to the impacts of PHEV charging on the medium voltage electric power distribution infrastructure1, and the impact of PHEV deployment on GHG capandtrade systems. This report also includes a summary of policy incentives related to PHEV cost competitiveness and the potential for using PHEVs to provide bidirectional 1The medium voltage power distribution infrastructure includes all of the equipment that connects the high voltage (generally 50kV and above) transmission system that moves power over long distances with the low voltage (
UVM TRC Report # 10001 ancillary services for the Vermont power grid, a process referred to as VehicletoGrid services (V2G). Each of these research areas comprises one of the sections in this report. Studies of PHEV impacts on the grid have focused on the capability of existing generating infrastructure to meet PHEV charging demand but relatively little attention has been given to the impact that PHEV charging will have at the distribution circuit level. Information on distribution level impacts will be vital to utilities as PHEVs use becomes more widespread. The UVM TRC created a model to assess these effects focusing on the changes in expected operating lifetime of transformers and underground cables at the distribution circuit level. In addition, the TRC modeled the impacts of PHEV charging on carbon prices under the Regional Greenhouse Gas Initiative (RGGI), a capandtrade program for CO2 from electricity generation covering the northeast United States. Both vehicle electrification and capandtrade programs are being advanced as means to minimize GHG emissions. Our analysis indicates that a capandtrade system that covers only the electricity sector could create a disincentive toward PHEV adoption by increasing the operating costs of PHEVs relative to those of conventional vehicles. Finally, this report provides a preliminary assessment of the potential market for V2G services in Vermont and an analysis of policies related to PHEV cost effectiveness at the state and federal levels. 1.1. Organization of this Report Section 1.2 of this paper presents key finding from prior studies regarding the distribution of gasoline and electricity used by PHEVs, the resulting gasoline displacement and net change in GHG emissions associated with PHEV operation, the generating capacity available to charge PHEVs and the vehicles’ lifetime ownership costs. Section 2 is an analysis of state and federal policies to enhance the economic competitiveness of PHEVs. Two models of the impact of electricity demand for PHEV charging are described in Sections 3 and 4. The first of these models looks at the impact of this additional demand for electricity on carbon prices and generating costs under an electricity sector only capandtrade program while the second explores its impact on medium voltage distribution circuits. Finally, section 5 estimates the economic potential for V2G services in Vermont. 1.2. Overview of Prior Research 1.2.1. Distribution of Primary Energy Consumption The impact of PHEVs depends heavily on the percentage of the vehicles’ power that is derived from external electricity rather than from gasoline. Since commercialized PHEVs have yet to be brought to market at a large scale, researchers must rely on performance data from computer simulations and converted HEVs to determine the distribution between gasoline and electricity powered travel. The differing modes in which a PHEV can operate and the variability in efficiency with trip length complicate this assessment [5, 6]. Factors such as a PHEV’s allelectric range (AER), battery depletion strategy, charge pattern and drive pattern, are critical determinants of the fraction of PHEV vehicle miles traveled (VMT) that are powered by electricity 4
UVM TRC Report # 10001 from the grid. The fraction of VMT that is powered by electricity, often termed the vehicle’s “utility factor”[7], drives the assessment of oil displacement, net change in GHG emissions and impact on the electrical grid. Utility factor can be calculated by: VMTe UF (1) VMTe VMTg where VMTe represent the vehicle miles traveled using electric drive and VMTg represents the gasoline powered vehicle miles traveled. The studies reviewed here use different assumptions regarding PHEV specifications, driving patterns, and charging characteristics that influence VMTe and therefore use different utility factors. The comparisons presented here do not adjust for the variations in utility factor among studies. Many existing studies rely on the Electric Power Research Institute’s (EPRI) assessments of PHEV performance from 2001 and 2002 [610]. Two studies [11, 12] generated performance data using the ADVISOR software package. One study [13] extrapolated PHEV electric efficiency from EPA fuel economy data from a single existing electric vehicle, the Toyota RAV4. Other groups, including the US Department of Energy through the Advanced Vehicle Testing Activities (AVTA) of the Idaho National Laboratory and Google’s “RechargeIT” PHEV initiative, have gathered data from conventional hybrids that that have been converted into PHEVs [5, 14]. Early tests of these conversions were conducted primarily in warm climates with relatively flat terrain. The initial AVTA road tests have been conducted in and around Phoenix, AZ and the RechargeIT tests in Mountain View, CA. 1.2.2. Gasoline Displacement Since PHEVs can be powered in part or in total by energy from the electrical grid, PHEVs are capable of displacing a portion of the gasoline used by the transportation sector. Numerous studies have examined the issue of fuel displacement and all of these studies found significant gasoline displacement from PHEVs relative to both conventional internal combustion engine vehicles (ICEVs) and HEVs [712, 1416]. The fuel displacement from replacing a nonPHEV with a PHEV is given by: f RE F f PH EV FD (2) f RE F where fREF is the fuel use of the reference vehicle and fPHEV is the fuel use of the PHEV. For all but two studies this calculation is made using the annual fuel consumption of an individual PHEV and reference vehicle. In the case of Gonder et al. [11], fuel displacement was calculated from simulated fuel use over 227 real world driving profiles. Based on the performance of a converted Prius, Kliesch and Langer [15] estimated VMTe to be one half of miles traveled within the vehicle’s AER and derived the fuel displacement from the percentage of miles traveled under electric power. As well as the PHEV’s utility factor, discussed previously, the fuel efficiency of the reference vehicle influences the calculation of fuel displacement and varies among these studies. A 2007 study conducted by EPRI in conjunction with the Natural Resources Defense Council (NRDC) [7] examined PHEVs with AERs of 10, 20 and 40 miles, and found gasoline displacement ranging from 42% to 78% relative to ICEVs and from 12% to 66% relative to HEVs. The other studies that quantified gasoline displacement found reduction values within these ranges [9, 11, 12, 15]. See Figure 11 for a summary of the 5
UVM TRC Report # 10001 fuel displacement results. Three additional studies concluded that PHEV use would lead to gas displacement but did not quantify the reduction in fuel use [8, 10, 16]. The overwhelming consensus of these studies is that PHEVs would be effective in reducing gasoline consumption in the transportation sector. As discussed previously, the exact amount of this reduction depends upon a number of factors including the PHEV utility factor and the fuel efficiency of the vehicles replaced by PHEVs. PHEV 20 PHEV 40 PHEV 10 80 70 Reference Vehicle ICEV HEV % Fuel Displaced (FD ) Eq. 2 60 50 40 30 20 10 0 EPRI [7] EPRI [7] Gonder [11] Kliesch [15] Letendre [9] Parks [12] (A) Parks [12] (B) EPRI [7] Gonder [11] Kliesch [15] Figure 11. Fuel displacement from PHEVs with varying allelectric ranges. [12] (A) assumed that the PHEV charged once per day. [12] (B) assumed that the PHEV charged whenever it was not in use. In scenario [12] (B) where the PHEV charged more frequently, a higher proportion of VMT are fuel with electricity, increasing the percent of gasoline that is displaced. 1.2.3. Net Change in Greenhouse Gas Emissions While PHEVs reduce GHG emissions at the tailpipe, drawing power from the electrical grid requires additional electricity generation and additional GHG emissions from the electrical sector. The net change in GHG emissions realized by replacing a nonPHEV with a PHEV is the difference between the GHG emissions avoided by reduced gasoline consumption and the GHG emissions caused by generating additional electricity as well as any additional GHG emitted in the construction of a PHEV rather than a HEV or ICEV [10]. The balance of emissions avoided and produced depends upon a number of factors, most importantly the GHG intensity of the electricity used to charge the PHEV, the utility factor of the PHEV, and the fuel efficiency of the vehicle that the PHEV replaces. GHG intensity is a measure of the quantity of GHG emitted to generate a unit of electricity and is determined primarily by the fuel type and plant technology [17]. Recent studies have reached a range of conclusions about the GHG implications of PHEVs depending on the assumptions that they make about each of these factors. The change in GHG emissions from a PHEV relative to a nonPHEV is calculated by: 6
UVM TRC Report # 10001 GHG REF GHG PHEV GHG (3) GHG REF where GHGREF represents the fuel cycle greenhouse gas emissions from the reference vehicle and GHGPHEV represents the fuel cycle emission of the PHEV including the fuel cycle emissions of electricity generation. Since the GHG intensity of electricity generation varies with the supply mix, the net change in GHG emissions related to PHEV adoption varies dramatically by region [8, 13, 15, 16]. All studies that compared PHEVs and ICEVs found a significant net decrease in GHG emissions with PHEVs relative to ICEVs [7, 9, 12, 13, 16]. Results for the net change in GHG emissions for a PHEV relative to an HEV, however, were more varied. Using the current national average for GHG intensity, a number of studies have found reductions in GHG emission for PHEVs ranging from 4% to 25% relative to HEVs [10, 13, 15, 16]. Looking at marginal generating capacity in the Xcel Territory in Colorado, Parks et al. [12] also found reductions in GHG emissions relative to HEVs in that generating region. The study conducted by EPRI and the NRDC [7] compared PHEVs to ICEVs and HEVs using specific generating technologies rather than national or regional averages and concluded the PHEVs would result in a net increase of GHG emission relative to HEVs when charged exclusively from coal fired plants but a net decrease when charged using natural gas power plants. See Figure 12 for a summary of findings on net change in GHG emissions with current generating technologies and mixes. It is important to note that only one of the studies discussed above [10] considered GHG emissions from the vehicle manufacturing process. This study concluded that lithiumion battery manufacturing for PHEVs contributed anywhere from 2 to 5% of the total life cycle GHG emissions associated with the vehicles. Studies that do not account for these emissions are likely to overstate the GHG benefit of PHEVs. 55 Reference Vehicle % Change in GHG Emissions (ΔGHG) Eq. 3 45 ICEV HEV 35 25 15 5 -5 EPRI [7] (A) EPRI [7] (B) Kintner-Meyer Kliesch [15] (A) Samaras [10] Stephan [13] Kliesch [15] (B) Letendre [9] [18] -15 Figure 12. Change in GHG Emissions. [7] (A) assumed charging with electricity generated from coal power plants while [7] (B) assumed that the electricity was generated from combined cycle natutal gas. [18], [15] (A),[ 10] and [13] all used the national average generating mix while [15] (B) & [9] used regional averages for CA and New England respectively. 7
UVM TRC Report # 10001 Understanding the GHG impact of PHEVs in the future requires projecting the GHG intensity of future electricity generation. Hadley and Tsvetkova [8] as well as EPRI [7] used models of the electricity generation system to project the GHG intensity of electricity to 2030 and 2050 respectively with strikingly different results. Working from the Energy Information Administration’s assessments of future electricity generation and modeling the additional emissions caused by the electricity demand due to projected PHEV use, Hadley and Tsvetkova [8] determined that, in most scenarios, PHEVs would cause a net increase in GHG emissions when compared to a 40 mpg HEV. The results of this study varied considerably with time of charging and region, as mentioned previously. For example, in both their 2020 and 2030 assessments, nighttime charging in New England, when additional demand would be met by relatively clean combined cycle generation, resulted in a net decrease in GHG emissions. The electricity generated for evening charging in New England, however, would rely more on oil and coal generation and increase overall GHG emissions. In the MidAmerican Interconnect Network, GHG emissions were higher in both evening and nighttime scenarios in 2020 and 2030. The EPRI study [7], in contrast, assumed that some form of carbon restriction or pricing measures would be implemented in the near future. As a result of this assumption, all of the scenarios that EPRI modeled going forward had a lower GHG intensity than the current national average. Consequently, PHEV use always resulted in a net reduction in GHG emission relative to 46 mpg HEV. Samaras and Miesterling [10] also considered three different hypothetical GHG intensity scenarios. In the two scenarios at or below the current national average for GHG intensity, PHEVs had lower GHG emissions than comparison HEVs. In their high GHG intensity scenario, however, PHEVs increased total GHG emissions relative to HEVs. 1.2.4. Supply Adequacy for PHEV Charging On average, U.S. power plants operate at approximately 60% of their nominal capacity and experience their lowest utilization during overnight periods [6]. Controlled PHEV charging during periods of minimum demand would increase utilization of base load generating capacity, flatten the overall load curve and decrease plant cycling, potentially decreasing the cost of electricity generation [6]. Numerous studies have examined current capacity to charge PHEVs during offpeak hours and concluded that current generating capacity could support a large fleet of PHEVs without increasing peak demand [6, 8, 9, 12, 13, 18]. These studies have taken two basic approaches to determining the current generating capacity available to support PHEV charging. The first, used by KintnerMyer et al. [18] and Stephan and Sullivan [13], is a valley filling approach in which the idle daily generating capacity is derived from representative load curves and allocated to PHEV charging in an optimal manner for maximum load leveling. This approach represents the maximum PHEV penetration prior to increasing peak demand. The second approach is a scenario building approach in which the additional electrical demand from varying levels of PHEV penetration is added to the load curve. Since a limited number of scenarios are modeled, this approach does not yield an absolute maximum supportable level of PHEV penetration. As with fuel displacement and net change in GHGs, the utility factor of the PHEVs impacts the number of vehicles that can be charged and varies among the cited studies. Based on average daily load curves from summer and winter, KintnerMeyer et al. [18] used a valleyfilling approach to estimate the unused generating capacity that is available to charge PHEVs. They calculated that the current system has the capacity to fuel 73% of all light duty vehicles in the United States on a daily basis. If charging was restricted to between 6 pm and 6 am, this number falls to 43% of the light duty fleet. While these estimates represent a theoretical maximum charging capacity for each time period, the authors did note that operating the electric power system at this high continuous load might not be sustainable and 8
UVM TRC Report # 10001 that planned outages for maintenance purposed would be more frequent and more difficult to schedule. Moreover, as Gaines et al. [19] noted, regulatory caps on SO2 and NOx emissions would precluded running existing power plants at maximum capacity without additional investment in emissions controls. Stephan and Sullivan [13] used a similar approach to calculate nighttime charging capacity but limited charging to “maximum economic capacity” which they defined as 90% of peak capacity. Using this method, they calculated that available capacity between 10 pm and 8 am could charge 34% of the light duty vehicle fleet. 80 70 PHEV Fleet Penetration (%) 60 50 40 30 20 10 0 Denholm [6] Hadley [8] Kintner-Meyer [18] (A) [18] (B) Letendre [9] Parks [12] Stephan [13] Figure 13. Currently supportable PHEV fleet penetration assuming optimimal charging patterns. [18] (A) assumed optimized day and night charging. [18] (B) assumed optimized night charging only. Using the scenario building approach and assuming optimal charging patterns, Denholm and Short [6] concluded that current national generating capacity could support 50% PHEV fleet penetration. Assuming delayed charging beginning at 10 pm, a separate study [8] concluded that 25% PHEV penetration of the light duty vehicle fleet would not increase peak demand. Two regional studies, also assuming optimal charging patterns, found that generating capacity in Vermont [9] and the Xcel territory in Colorado[12] could support 30% PHEV penetration. Several of the scenario building studies also examined a variety of uncontrolled charging scenarios [8, 9, 12, 20]. Each of these studies found that uncontrolled charging of PHEVs was likely to increase peak demand. In their comprehensive study of the impact of PHEVs on the electrical grid, Hadley and Tsvetkova [8], concluded that large numbers of PHEVs charging at or near peak hours would necessitate constructing new generating capacity in 10 of the 13 regions studied. Even offpeak charging, however, may have an impact on the service life and maintenance costs of the distribution circuits. Transmission lines, generators, phase correcting capacitors, and transformers will all experience increased loading if PHEVs come into widespread use. The possible impact of increased loading on medium voltage distribution systems is examined in more detail in Section 4. 9
UVM TRC Report # 10001 1.2.5. Lifetime operating cost relative to alternatives All studies that examined fuel costs for PHEVs determined that, per mile traveled, electricity was a cheaper source of energy than gasoline [8, 9, 12, 16, 21]. Consequently, operating costs for PHEVs are generally assumed to be lower than those of ICEVs or HEVs, though this will also depend on as yet unknown repair costs and battery lifespan. The purchase price of PHEVs, on the other hand, is expected to be significantly higher than for comparable ICEVs or HEVs due primarily to the high costs of the battery systems [15]. Several studies have concluded that in most circumstances the vehicle’s lower operating costs do not offset the high purchase price of the vehicle over the vehicle’s lifetime [13, 15, 21]. Depending on future oil and electricity prices and reductions in battery costs, PHEVs may eventually become more affordable than conventional vehicles [20]. The balance between higher upfront costs and lower operating costs could also be shifted by government incentives or by creating a revenue stream from V2G services. The role of government policy in PHEV cost competitiveness is investigated in Section 2. Section 1.2.6. provides background on the economic potential of V2G while section 5 explores the V2G in greater depth with a particular focus on its potential in Vermont. 1.2.6. Economic Potential of VehicletoGrid Integration V2G describes the two way integration of EVs, including PHEVs, into the electrical grid. With V2G, vehicles are able feed electricity back into the grid as well as drawing electricity from it. Vehicle batteries are idle for 96% of the time [22]. V2G technology has the potential to make use of this idle capacity and thus provide substantial value to the electricity sector. Using various assumptions about vehicle owner preferences regarding V2G, market prices for the different generation types, battery capacity, cost of providing V2G services and electric line capacity, the value of V2G services from one vehicle has been estimated at as high as $7,738/year [23]. Figure 14 provides a range of these findings [2328]. A selection of V2G studies and demonstration projects are explored in greater depth in Section 5. 7800 Range of Estimates Lowest Estimate 6800 5800 Value (Dollars) 4800 7383 3800 589 788 4000 2800 0 0 1800 2573 2554 2370 2497 1270 197 800 920 870 1000 247 595 311 75 -200 -170 Kempton [23] Kempton [23] Kempton [23] Kempton [24] Kempton [25] Letendre [26] Letendre [26] Tomic [27] Tomic [27] Brooks [28] (A) (B) (C) (A) (B) Figure 14. Estimated annaul value of V2G services from a single vehicle. (A) indicates V2G for regulation, (B) for spinning reserves and (C) for peak power. 10
UVM TRC Report # 10001 In the US there are 176 million light duty vehicles, which have a total capacity of 19.5 TW of mechanical power [22]. In comparison, the capacity of electrical power plants in the US is approximately 900 GW [22]. At 20% conversion efficiency the vehicle fleet could produce 3840 GW, over four times the US generating capacity. Assuming contracted regulation of 1.5% of peak demand [26] and that each V2Genabled vehicle could supply 10kW of regulation, 0.8% of the light duty vehicle fleet could meet all regulation requirements. Even doubling this number to ensure that enough vehicles are plugged in at any given time to provide a reliable source of regulation would require only 1.6% of the vehicle fleet [22]. The advantages of V2G to provide ancillary service are valuable but the value is not infinitely scalable. A separate benefit of V2G is that using the vehicles for electrical storage could facilitate higher penetration rates for intermittent renewable energy sources such as solar and wind. Currently, bulk energy storage options, such as thermal storage, pumped hydro, compressed air, and battery systems, are expensive. V2G may provide a cost effective way to provide energy storage and backup for these intermittent sources. Many solar photovoltaic (PV) sites are adopting an energy buffer that can supply the full capacity of the station for a short period of time. The minimum buffer storage requirement (MBSR) is length of time that a PV station must be able to supply power without light. In California a PV plant is considered to have a firm capacity rating if it has an MBSR of 0.751 hour [22]. If 1/5th of the country’s generation was from PV, it would take 26% of the light duty vehicle fleet to meet this required MBSR [22]. Wind generation is less predictable than PV and consequently may need reserves to cover a longer interval than is required for PV [22]. For large scale dispersed wind generation, estimates of required reserves range from 11% 20% of capacity [22]. Using the lower estimate, Kempton and Tomic [22] calculated that if half of US power came from wind, 38% of the light duty vehicle fleet would be needed to provide adequate reserves. 11
UVM TRC Report # 10001 2. PHEV Policy President Obama established a goal of having one million PHEVs on the streets by 2015 [29]. As described in Section 1.2, research into PHEVs has consistently found that they use less liquid fuel than either ICEVs or HEVs [7, 11, 12]. Moreover, including the GHG emissions associated with electricity generation, they emit less GHG than ICEVs and, depending on the electricity source, they can emit less GHG than HEVs [7, 10, 13]. Concerns about oil prices and dependence on foreign oil as well as accelerating global climate change make these desirable vehicle characteristics. Both consumer acceptance and cost competitiveness of PHEVs, however, mean that achieving the rapid rate of PHEV deployment inherent in the President’s plan is unlikely to be achieved without policy incentives [21, 30]. This section of the report examines estimates of the policy incentives necessary to make PHEVs economically competitive with other vehicles on a lifetime ownership basis and provides a framework for categorizing policies geared toward increasing the rate of PHEV adoption, as well as an overview of existing and pending policies at both the state and federal level. The analysis of state level policies focuses on New England and California. Finally, since widespread PHEV adoption has the potential to impact the grid, policies related to PHEV infrastructure development and charging patterns are examined. 2.1. Background Vehicle purchase price and operating costs are major determinants of vehicle purchasing decisions, and, due primarily to high battery costs, PHEVs are projected to be significantly more expensive than comparable ICEVs and HEVs. Estimates of the PHEV battery costs range from $250 $2,000 per kWh of battery capacity [21]. Using Samaras et al.’s best estimate of $1,000 per kWh, this translate into a premium of $16,000 on a vehicle like the Chevy Volt which has a 16 kWh battery and an AER of 40 miles. The higher upfront costs for PHEVs are partially offset by lower operating costs; per mile traveled, operating a PHEV on electricity from the grid is substantially cheaper than operating a ICEV on gasoline. In most circumstances however, the lower operating costs of a PHEV over the vehicle’s operational lifetime are not sufficient to offset the higher purchase price [13, 15, 21, 30]. The incentive levels required to make PHEVs cost competitive with currently available vehicles depends upon the net present value of the operating cost savings over the vehicles’ lifetime relative to the upfront price premium. A number of interrelated factors influence this relationship, including battery costs, electricity and gasoline prices, and individual driving patterns. Battery costs determine the purchase premium of the PHEV, while the proportion of vehicle miles traveled on electric power and the relative prices of gasoline and electricity determine the operating cost savings of the vehicle. Both the upfront cost of the vehicle and the operating cost savings are related to the vehicle’s battery capacity; large batteries cost more than smaller batteries but are also capable of using electric power for a higher proportion of vehicle miles traveled thus generating greater operational savings. Selecting a battery capacity that aligns with individual driving patterns would therefore enable individual consumers to minimize the lifetime ownership costs of a PHEV [21, 30]. For example, drivers who routinely drive short trips and have frequent opportunities to charge their vehicle would realize the greatest economic benefit by purchasing a vehicle with a smaller battery. It is currently unclear, however, how large a variety of battery sizes, and consequently electric ranges, will be available in commercial PHEVs. The Chevy Volt, 12
UVM TRC Report # 10001 for example, is expected to have a 40 mile AER while the plugin Toyota is currently reported to have an AER of less than ten miles. BYD’s F3DM, now selling in China, has an AER of 60 miles. Table 21. Anticipated release dates for several PHEVs. Manufacturer Vehicle (All Electric Range) Anticipated Release Date BYD F3DM (60 miles) Released Late 2008 Toyota Plugin Prius (10 miles) Late 2009 General Motors Chevy Volt (40 miles) 2010 Chrysler Jeep Wrangler (40 miles) 2010 Fisker Karma (50 miles) 2010 Ford Escape (40 miles) 2012 In the absence of fixed figures for AER, and for electricity and gasoline prices, Samaras et al. calculated the required subsidy to make PHEVs cost competitive under a range of scenarios [21]. Using “best estimate” scenarios, the researchers found that only a PHEV10 would be cost competitive over its operational lifetime. PHEV30s would require a subsidy with a net present value of approximately $5,500 and a PHEV50 nearly $13,000. The results of this analysis, however, were found to be highly sensitive to battery costs, battery size, and gasoline prices. The required level of support could be much higher if, for example, battery prices per kWh remain closer to $2000 than the $1000 estimate used in the analysis. Lemoine et al. approached the economics of PHEV operations by estimating the battery cost levels that would result in a equal net present value for the upfront premium and operating cost savings [20]. They estimated that depending on the price of electricity, battery costs would have to drop to between $162 and $479 per kWh to be cost competitive with ICEVs at gasoline prices of $3 per gallon. The analyses of both Samaras et al. and Lemoine et al. focus on establishing price parity between PHEVs and other vehicles on the market. Each acknowledges that noneconomic factors play into consumer preferences. For some segment of the car buying population, therefore, the difference in lifetime operating costs would not need to be completely eliminated to make the PHEV a desirable purchase. 13
UVM TRC Report # 10001 2.2. Methods Researchers estimated the price premium on PHEVs and, consequently, of the financial incentives necessary to overcome this premium, based on existing literature. Current and pending policies were drawn from government documents, media reports, advocacy groups and academic journals. At the state level, the researchers examined state Climate Action Plans and contacted officials in state departments of energy, transportation and public utility commissions in New England. These policies were then categorized according to a policy framework developed by Theodore Lowi which is described below. 2.2.1. Policy Framework A number of different policy approaches could be implemented to achieve the goal of accelerated PHEV sales. In fact, a wide range of policies from research and development funding to tax credits to feebates to manufacturing quotas and fuel standards either have already been implemented or are under consideration at different levels of government. One useful framework for categorizing these policy options is the policies matrix laid out by Theodore Lowi which characterizes policies as distributive, redistributive or regulatory in nature [31]. By imposing costs and/or benefits to different groups or individuals, all three of these policy approaches can change incentive structures and the economic viability of different production and consumption decisions. The particular characteristics of each of the approaches vary considerably. Distributive policies provide benefits to individuals or businesses without imposing costs on other specific sets of individuals. The policies can be very narrowly targeted, and, since the costs are widespread, do not create direct confrontation between policy beneficiaries and policy funders [31]. Redistributive policies, in contrast, directly influence the relationship between categories of individuals by providing one group with a benefit directly funded by the second group [31]. Finally, regulatory policies limit the decision making ability of the regulated parties, by requiring a certain action or sets of actions, and are generally applied along sectoral lines. Using the Lowi framework, research and development funding and tax credits are characterized as distributive policies. These policies allocate benefits to particular interest groups, potential PHEV buyers and manufacturers, but the costs of the policies are diffused across all tax payers. In contrast, feebates, the practice of assessing a fee on one purchase type to underwrite a rebate for a competing purchase type, are a redistributive policy. There is a clear and unidirectional relationship between the fee paying and rebate receiving groups. Redistributive policies offer both an incentive for one action as well as a disincentive for another action so they may be more effective at changing behavior than distributive policies, which do not offer the same disincentives. In addition, redistributive policies can be designed to be revenue neutral, with the rebate and fee portions of the program offsetting one another [32]. Distributive policies, however, may be easier to enact legislatively as they do not face opposition from a concentrated interest group [31]. Production quotas and fuel standards represent regulatory policy as they impose statutory requirements that limit the decision making ability of automobile manufactures. 2.3. Analysis of Existing and Proposed Policies Impacting PHEV Sales There are three primary means of improving the economic competitiveness of PHEVs for the consumer. The first of these is to subsidize the vehicle purchase price either through distributive or redistributive policies. Tax incentives, rebates and feebates could all be used to bring down the price paid by the consumer to the 14
UVM TRC Report # 10001 point that PHEVs would be cost competitive with ICEVs. The second option is to decrease the costs associated with PHEV production. Lower costs would then be passed onto the consumer, eliminating the need to subsidize purchases. In the short term, decreasing production cost could be achieved through tax breaks for the manufacturers and, in the longer term, by technological innovations. The final method would be to set up a framework that allows the consumer to capitalize on any environmental cobenefits, reduced life cycle GHG emissions for example, derived from PHEV purchases. This approach would require a regulatory framework that allows these positive externalities to be priced and valued. Creating additional value for the PHEV would help to offset its higher upfront costs. Each of these approaches is being considered to varying degrees at both the state and federal levels. Table 22. Federal PHEV Related Policies Cost Primarily Policy Impact on PHEVs Status Born By Distributive and Redistributive Federal Policies Potential reduction in Ongoing Alternative Research and battery costs would Tax payers at Vehicle funding expanded Development Funding decrease PHEV price large under ARRA premium Tax Credits for PHEV Reduction in PHEV price Tax payers at Created under EESA, purchases premium large expanded under ARRA Regulatory Federal Policies Fuel efficient PHEVs may Automobile benefit from stricter fuel manufacturers economy standards which and purchasers CAFE Standards cause the automobile Strengthened by EISA of vehicles with manufactures to adjust lower fuel pricing engage in mix efficiency shifting 2.3.1. Federal Policies Distributive and Redistributive Policies Tax Credits Tax credits are one straightforward method of underwriting vehicle purchases. This method was widely used on both the state and federal level when HEVs were first introduced [32]. The Federal government also recently began applying this strategy to PHEVs. The U.S. Emergency Economic Stabilization Act of 2008 (EESA) included provisions for tax credits of up to up to $7,500 on the first 250,000 PHEVs sold between 2009 and 2014 [33]. More recently, the provisions have been expanded under the American Recovery and 15
You can also read