Investor Presentation - November 2021 - cloudfront.net
←
→
Page content transcription
If your browser does not render page correctly, please read the page content below
Investor Presentation
November 2021

Forward Looking Statements & Non-GAAP Financial Measures
This presentation includes “forward-looking statements” for purposes of the safe harbor provisions of the Private Securities Litigation Reform Act of 1995, Section 27A of the Securities Act of 1933, as amended, and Section 21E of the Securities Exchange
Act of 1934. Forward-looking statements are statements other than statements of historical fact. They include statements regarding Gulfport’s current expectations, management's outlook guidance or forecasts of future events, projected cash flow and
liquidity, share repurchases, its ability to enhance cash flow and financial flexibility, future production and commodity mix, plans and objectives for future operations, the ability of our employees, portfolio strength and operational leadership to create long-
term value, the rejection of certain midstream contracts and the assumptions on which such statements are based. Gulfport believes the expectations and forecasts reflected in the forward-looking statements are reasonable, Gulfport can give no assurance
they will prove to have been correct. They can be affected by inaccurate or changed assumptions or by known or unknown risks and uncertainties. Important risks, assumptions and other important factors that could cause future results to differ materially
from those expressed in the forward-looking statements are described under "Risk Factors" in Item 1A of Gulfport’s annual report on Form 10-K for the year ended December 31, 2020 and any updates to those factors set forth in Gulfport's subsequent
quarterly reports on Form 10-Q or current reports on Form 8-K (available at https://www.ir.gulfportenergy.com/all-sec-filings). Gulfport undertakes no obligation to release publicly any revisions to any forward-looking statements, to report events or to
report the occurrence of unanticipated events.

Gulfport's proved reserves and adjusted proved reserves are those quantities of natural gas, oil, and natural gas liquids, which, by analysis of geoscience and engineering data, can be estimated with reasonable certainty to be economically producible—from a
given date forward, from known reservoirs, and under existing economic conditions, operating methods, and government regulations—prior to the time at which contracts providing the right to operate expire, unless evidence indicates that renewal is
reasonably certain, regardless of whether deterministic or probabilistic methods are used for the estimation.

Gulfport's estimate of its total proved reserves is based on reports prepared by Netherland, Sewell Associates, Inc., independent petroleum engineers, and internal estimates. Factors affecting ultimate recovery include the scope of Gulfport’s ongoing drilling
program, which will be directly affected by the availability of capital, drilling and production costs, availability of drilling services and equipment, drilling results, lease expirations, transportation constraints, regulatory approvals, actual drilling results, including
geological and mechanical factors affecting recovery rates, and other factors. Estimates may change significantly as development of Gulfport’s natural gas, oil and natural gas liquids assets provide additional data. Gulfport’s production forecasts and
expectations for future periods are dependent upon many assumptions, including estimates of production decline rates from existing wells and the undertaking and outcome of future drilling activity, which may be affected by significant commodity price
declines or drilling cost increases.

Gulfport’s management uses certain non-GAAP financial measures for planning, forecasting and evaluating business and financial performance, and believes that they are useful tool to assess Gulfport’s operating results. Although these are not measures of
performance calculated in accordance with generally accepted accounting principles (GAAP), management believes that these financial measures are useful to an investor in evaluating Gulfport because (i) analysts utilize these metrics when evaluating company
performance and have requested this information as of a recent practicable date, (ii) these metrics are widely used to evaluate a company’s operating performance, and (iii) we want to provide updated information to investors. Investors should not view these
metrics as a substitute for measures of performance that are calculated in accordance with GAAP. In addition, because all companies do not calculate these measures identically, these measures may not be comparable to similarly titled measures of other
companies. These non-GAAP financial measures include Adjusted EBITDA, Free Cash Flow, and Recurring General and Administrative Expense. A reconciliation of each financial measure to its most directly comparable GAAP financial measure is included as
part of this presentation. These non-GAAP measure should be considered in addition to, but not instead of, the financial statements prepared in accordance with GAAP.

Investors should note that Gulfport announces financial information in SEC filings, press releases and public conference calls Gulfport may use the Investors section of its website (www.gulfportenergy.com) to communicate with investors. It is possible that
the financial and other information posted there could be deemed to be material information. The information on Gulfport’s website is not part of this presentation.

                                                                                                                                                                                                                                                                   GPOR | 2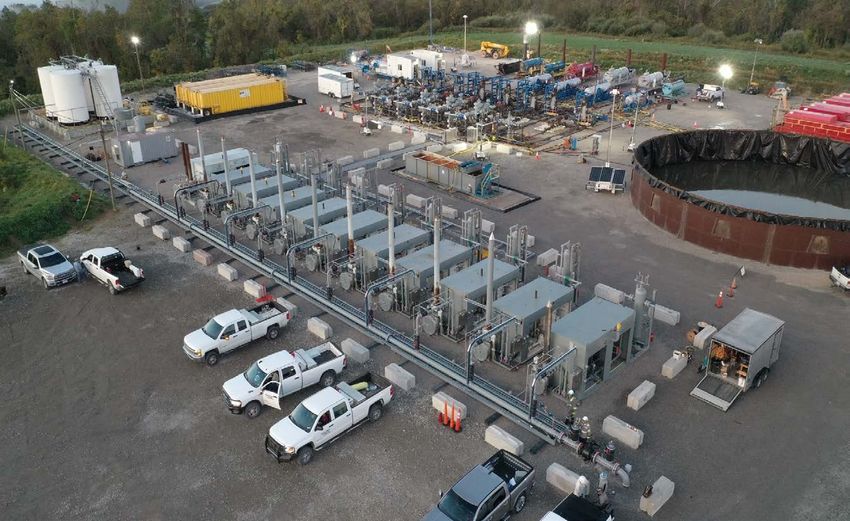
Creating Value for Shareholders

                                                                                       • High quality, contiguous acreage position located in the core of the Utica and SCOOP
   High Quality Natural Gas Assets                                                     • Cost structure materially improved with right-sized firm transportation portfolio

                                                                                       • Safety of employees, contractors and communities is our highest priority
   Focused on ESG Excellence                                                           • Commitment to clean and efficient operations
                                                                                       • Task force engaged to measurably reduce GHG and methane emissions

                                                                                       • Peer-leading free cash flow(1) yield
   Substantial Free Cash Flow                                                          • Immediate opportunity to reduce debt
                                                                                       • Free cash flow(1) supports recently approved $100 million stock repurchase program

                                                                                       • Low leverage provides financial and operational flexibility
   Conservative Balance Sheet                                                          • High priority to maintain strong balance sheet with target leverage below 1.0x
                                                                                       • Hedging program reduces commodity risk and secures future cash flows

                                                                                       • Targeting best in class cost measures with additional opportunities identified
   Continuous Improvement Mindset                                                      • LOE, G&A and D&C efficiencies remain a daily focus
                                                                                       • Subsurface development plan focused on value optimization

       1.   Free Cash Flow is a non-GAAP financial measure; see supplemental slides.

                                                                                                                                                                          GPOR | 3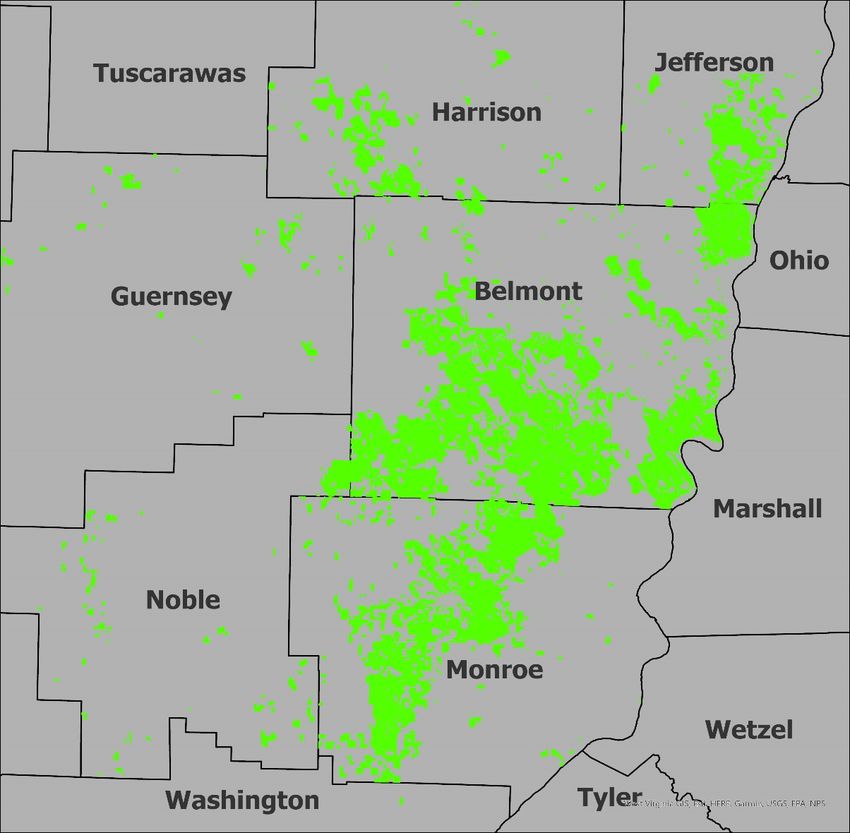
Gulfport Energy Overview
Key Highlights
NYSE: GPOR
Utica
~193,000 Net Acres Market Cap(1): $1.7 Billion
3Q2021 Net Production: ~700 MMcfe/d Enterprise Value(2): $2.5 Billion
YE20 Proved Reserves: 1.7 Net Tcfe Liquidity(3): $388 Million
Leverage(4): 1.2x
2021E Total Capital: $290 - $310 Million
2021E Total Net Production: 980 – 1,000 MMcfepd
90% Natural Gas, 7% NGL, 3% Oil
2021E Free Cash Flow(5): $345 - $365 Million
2021E Free Cash Flow Yield(5): ~21%
Total Net Reservoir Acres(6): ~266,000 acres
~500 gross
Remaining Inventory:
operated locations
SCOOP 2021E Activity
~73,000 Net Reservoir Acres(6) 2021E Capital Program 2021E Production Mix
3Q2021 Net Production: ~275 MMcfe/d 5%
23%
YE20 Proved Reserves: 0.9 Net Tcfe 30%
65% 77%
Utica Shale SCOOP Land Utica Shale SCOOP
1. Market capitalization calculated as of the close of the market on 11/1/21 at a price of $82.35 per share using shares outstanding from the Company’s 3Q2021 financial statements.
2. Enterprise value calculated as of the close of the market on 11/1/21 at a price of $82.35 per share using shares outstanding, short-term debt, long-term debt, preferred stock and cash and cash equivalents from the Company’s 3Q2021 financial statements.
3. As of 9/30/21 and pro forma for the October 14, 2021 amendment of the Company’s credit facility. Comprised of cash and cash equivalents and available borrowing capacity under the Company’s new revolving credit facility.
4. As of 9/30/21 using net debt to LTM Adjusted EBITDA. Net debt is a non-GAAP measure. It is defined as total long-term debt minus cash and cash equivalents. GPOR | 4
5. Free Cash Flow is a non-GAAP financial measure; see supplemental slides. Free cash flow yield is calculated using Free Cash Flow divided by current market capitalization 11/1/2021 using shares outstanding from the Company’s 3Q2021 financial statements.
6. SCOOP acreage includes ~40,000 Woodford and 33,000 Springer net reservoir acres.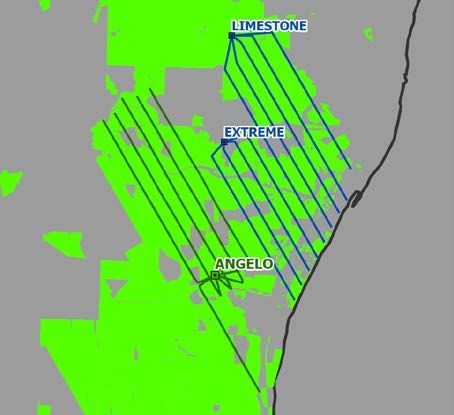
Focused on ESG Excellence
                                                     Environmental
    •   Deployed task force to measurably reduce GHG and methane emissions                                                                2020 Methane Intensity(1)
    •   Established collaboration with The Environmental Partnership to accelerate
        emission reduction efforts                                                                                                                   40% YoY
    •   Minimized freshwater use by recycling produced water across our operations
                                                              Social
                                                                                                                                       2020 Greenhouse Gas Intensity(2)
   •    The safety of our employees, contractors and communities remains our
        highest priority
                                                                                                                                                     50% YoY
   •    Implemented strategy for increasing diversity and inclusion
   •    Continued to provide community support in our operating areas through
        foundation partnerships
                                 Governance                                                                                          2020 Total Recordable Incidents Rate
   •    Established Nominating, Environmental, Social & Governance Committee
        to oversee ESG policies and initiatives                                                                                                      20% YoY
   •    Created an integrated internal ESG Steering Committee
   •    Established an Enterprise Risk Management Program

         Note: More details on our ESG initiatives can be found on the Gulfport website: www.gulfportenergy.com
         1.  Metric tons methane / gross annual production (MBoe)
         2.  Greenhouse gases (GHGs): methane, carbon dioxide and nitrous oxide. Metric tons GHGs / gross annual production (MBoe)
                                                                                                                                                                      GPOR | 5
Delivered Strong Third Quarter Results

               Total                                         Incurred                                              Per Unit                   Free                    Current
                                                                                                                                                                      Leverage
           Net Production                              Capital Expenditures                                     Operating Cost(3)         Cash Flow(1,3)
                                                                                                                                                               (Net Debt(4) to EBITDA(3))
3Q 2021

          973 MMcfepd                                         $81 Million                                    $1.22 per Mcfe             $70 Million                      1.2x

           Total net production                               Expect to invest                                                         Forecast to generate              On track
                                                                                                                Inclusive of LOE,
            range narrowed to                              $290 – $310 million                                                         $345 – $365 million             to exit 2021
                                                                                                                    GP&T and
          980 – 1,000 MMcfepd                              across our asset base                                                        of free cash flow(1)               below
                                                                                                             Taxes other than income
                 for 2021                                      during 2021                                                                    in 2021                 1.2x(2) levered

               1.   Free Cash Flow is a non-GAAP financial measure; see supplemental slides.
               2.   Year-end 2021E net debt to 2021E adjusted EBITDA at strip pricing as of 9/30/2021.
               3.   Assumes rejection of Rover firm transportation agreement.                                                                                                       GPOR | 6
               4.   Net debt is a non-GAAP measure. It is defined as total long-term debt minus cash and cash equivalents.
Updated 2021 Full Year Guidance

                                   Total Net Production                                                                     Incurred Capital Expenditures
                                   980 – 1,000 MMcfepd                                                                           $290 - $310 Million
                   Narrowing full year guidance range driven by                                                                       Reaffirm 2021 capital budget
           strong reservoir performance and Utica Angelo development                                                               staying disciplined to previous plan
                      turned-to-sales earlier than forecasted

         Free                                     $345 - $365                                                            Recurring Cash G&A Expense(1)
     Cash Flow(1,2)                                 Million                                                                     $42 - $44 Million

        Increased full year free cash flow(1,2)                                                           Reduced 2021 full year recurring cash G&A expense to be in line
       by approximately $55 million, or 18%                                                                 with target of $0.12 per Mcfe and expected 2022 run rate

      1.    Free Cash Flow and Recurring Cash G&A Expense are non-GAAP financial measures; see supplemental slides.
      2.    Assumes rejection of Rover firm transportation agreement.
                                                                                                                                                                            GPOR | 7
2021E Capital Program and Outlook
             Capital Program                                                                                                       Production
             • Prioritizing free cash flow(1) generation with capital discipline focused                                           • Executing maintenance level program
               on high-return projects                                                                                             • Narrowing production guidance range to 980 – 1,000 MMcfepd
             • Investing $290 – $310 million during 2021                                                                           • Production supported by strong development program results
             • Capital efficiencies offsetting inflationary effects

                                   Total Capital Expenditures                                                                                          Total Net Production

         $100                                                                                                                1,000

             $75                                                                                                                  750

                                                                                                                        MMcfepd
$ Millions

             $50                                                                                                                  500

             $25                                                                                                                  250

              $0                                                                                                                    0
                      1Q2021A                 2Q2021A                         3Q2021E                         4Q2021E                     1Q2021A           2Q2021A        3Q2021E        4Q2021E

                              Utica            SCOOP                   Land              3Q2021 Actuals                                             Utica        SCOOP         3Q2021 Actuals

                              1.   Free Cash Flow is a non-GAAP financial measure; see supplemental slides.

                                                                                                                                                                                                GPOR | 8
Sustainable Free Cash Flow Generation
Gulfport’s go-forward
2022E Free Cash Flow(1,2,3)
development plan targeting:
$500
Total Net
~1.0 Bcfepd $400
Production
$300
Capital
$ Millions
~$300 Million
Expenditures $200
At $3.50 gas / $70 oil plan generates: $100
Free $-
> $350 Million
Cash Flow(1,2,3)
(4)
$3.00 gas / $60 oil $3.50 gas / $70 oil Current Strip
1. Includes current hedge position as of 11/1/2021.
2. Free Cash Flow is a non-GAAP financial measure; see supplemental slides.
3. Assumes rejection of Rover firm transportation agreements. GPOR | 9
4. Based upon current forward pricing at 9/30/2021 and basis marks.Operational Update
Drilling & Completion Efficiencies
                                               Lateral Lengths                                                                                        Drilling Days(1)                                       Completed Stages(2)

                                                                                                                 Spud-to-Rig Release (Days)
        Drilled Lateral Length

                                                                                            17,026'                                                                                                                                                9.1
                                                                             15,581'                                                           21.0

                                                                                                                                                                                    Stages per Day
                                                12,195'                                                                                                  19.7                                                                6.5          6.7
                                                                                                                                                                                                      5.6       5.9
                                 10,299'                       10,106'
Utica                                                                                                                                                             18.7
                                                                                                                                                                           17.8

                                   2018           2019          2020           YTD          Angelo                                             2018      2019     2020   YTD 2021                     2018     2019          2020     YTD         Angelo
                                                                               2021          Pad                                                                                                                                      2021         Pad

                                                        Continuous improvement mindset across all operations

                                                                                                                  Spud-to-Rig Release (Days)
        Drilled Lateral Length

                                                                                           9,731'                                              63.4
                                                                        9,515'                                                                                                                                                                    5.8

                                                                                                                                                                                     Stages per Day
                                                                                                                                                         54.8
                                   7,891'             8,076'                                                                                                                                                                        4.9

                                                                                                                                                                           38.2
SCOOP                                                                                                                                                             35.5                                  3.3
                                                                                                                                                                                                                      3.7

                                    2018              2019               2020           YTD 2021                                               2018      2019     2020   YTD 2021                      2018           2019          2020        YTD 2021

                           1.    Drilling days are normalized to a 10,000' lateral in the Utica and 7,500' lateral in the SCOOP.
                           2.    Stages per day is a pad average, calculated as: total stages on pad / days on pad.
                                                                                                                                                                                                                                                 GPOR | 11
Utica 2021 Development Plan
Key Highlights
• Utica net production totaled ~700 MMcfepd during 3Q2021(1)
• 2021 turn-in-line program concluded with 17 gross wells
Angelo Pad
• Shannon, Hendershot, Morris and Gehrig Pads all outperforming forecast (6 Wells)
• Angelo pad completed using simul-frac technology and turned online ahead
of plan
2021 Development Program Production Morris Pad
(2 Wells)
Actual Forecast
Gross 2-Stream Volume (MMcfepd)
2021 turn-in-lines
outperforming Gehrig Pad
400
expectations (2 Wells)
300
200
100 Shannon Pad
(4 Wells)
-
Jan Feb Mar Apr May Jun Jul Aug Sep Oct Nov Dec Legend Hendershot Pad
Shannon Hendershot Morris Gehrig Angelo Actuals Gulfport Acreage (3 Wells)
1. During the three months ended September 30, 2021.
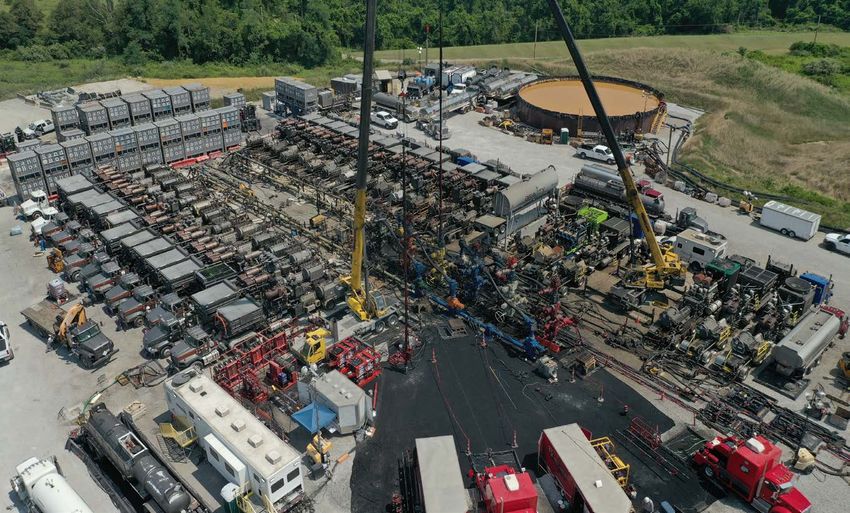
GPOR | 12Angelo Pad Development – Fracture Stimulation
Industry leading Ohio Utica development
with simul-frac technology
• Achieved 9.1 stages per day on average
compared to 6.5 stages per day in 2020,
with individual days as high as 16 stages in
a 24-hour period
• Frac intensity of 60 bbl/ft of fluid and
2,400 lbs/ft proppant
• 243.5 million lbs of sand placed with
97% efficiency
• Simul-frac accelerated production by
30 days compared to standard frac
Angelo Completions EHS Highlights
• Zero OSHA recordable incidents
• Zero agency reportable spills
• 100% water reused from Gulfport
operations and water sharing
GPOR | 13Angelo Pad Development – Drill-Out Operations
Drill out with dual standalone
snubbing units
• Achieved 5,075’ feet/day per snubbing
unit
• Dual rig drill-out accelerated
production by 10 days
Angelo pad average lateral length of
17,026’ and Angelo 2A well set
record of longest lateral drilled to
date by Gulfport in the play
Lateral Lengths
Drilled Lateral Length
19,413'
17,026'
10,106'
2020 Angelo Pad Angelo 2A Well
GPOR | 14Angelo Pad Development – Flowback & Production
Angelo pad brought online mid-October
and flowing above the combined gross
target rate of 235 MMcfepd
• Currently flowing at a peak 250 MMcfepd
Operating control center provides 24/7
surveillance and automation of wells and
facilities
• Translates to lower LOE and higher uptime
Facility equipment recycled and
refurbished from prior developments
Angelo Pad Production
300
Gross 2-Stream Volume
(MMcfepd)
200
100
0
Oct Nov Dec
Angelo Forecast Actuals
GPOR | 15Angelo Pad Development
Utica Total Well Cost Per Foot(1) Key Highlights
$1,248
Identified opportunities to further reduce costs
$ / Foot of Lateral
$1,102
$897 • Dual fuel utilization for drilling rig and frac spreads
~$750
• Top hole program and completion operation design allows
for even more efficient cycle time
2018 2019 2020 Angelo Pad • Optimized drilling equipment for lateral lengths exceeding
15,000’
• Applying lessons learned with strategic vendor partnerships
Average to increase efficiency and mitigate execution risk
Pad
Lateral Length
Upcoming 2022 program to replicate successful Utica
Angelo 17,026’
developments in 2021
Limestone 17,039’ • Offset acreage to Angelo pad allows for continued
2022
optimization of lateral length, well spacing, and stimulation
Extreme 13,866’ intensity
• Lessons learned will be applied to Limestone and Extreme
1. Gulfport’s total well cost represents a fully burdened incurred total well cost, including infrastructure and facility costs. Publicly reported peer well costs may only include drilling and completion costs and can differ for
comparison purposes.
GPOR | 16Utica Recent Performance – Shannon & Hendershot Pads
Performance Observations Reduced Pressure Decline
8,000
• 2021 development outperforming historical tighter spaced Historical wells typically start
development production decline at 1,000-2,000 PSI
• Shannon and Hendershot 7-well development at 1,450’ average occurring between 120 to 180 days
spacing and 8,050’ average lateral length continues to experience 6,000
Shannon and Hendershot wells
extended flat time and reduced pressure declines trending above historical average
• Recently tested higher flow rates on both pads and did not
Avg. FTP (PSI)
experience material degradation in pressure declines, forecasting 4,000
the wells to remain on trend to exceed historical development
Flat Production Profile
30
Gross 2-Stream Volume
2,000
20
(MMcfed)
10 Average Field Line Pressure (1,000 PSI)
- 0
0 50 100 150 200 250 300 0 50 100 150 200 250 300 350 400
Producing Days
Producing Days
Shannon 1B Shannon 2A Shannon 3B Shannon 4A
Historical Development Avg. FTP (PSI) Shannon & Hendershot Avg. FTP (PSI)
Hendershot 1A Hendershot 2B Hendershot 4B
GPOR | 17Utica Recent Performance – Monroe County
Performance Observations Angelo Pad
(6 Wells)
Reduced Pressure Decline
8,000
• Morris and Gehrig 4-well development at Morris Pad
1,750’ average spacing and 13,400’ average (2 Wells)
Expecting additional 2 months of
lateral length also experiencing extended Gehrig Pad
(2 Wells)
flat production compared to
flat time and reduced pressure declines historical average
6,000
• Development spacing aligned with
regional OGIP Shannon Pad
(4 Wells)
Avg. FTP (PSI)
• Preliminary average EUR estimate of Hendershot Pad
1.8 Bcfe/1,000ft (3 Wells) 4,000
Flat Production Profile
Gross 2-Stream Volume
30
2,000
(MMcfed)
20
10
Average Field Line Pressure (500 – 750 PSI)
- 0
0 50 100 150 200 250 300 0 50 100 150 200 250 300 350 400
Producing Days
Producing Days
Morris 1A Morris 2A Gehrig 1A Gehrig 2A Historical Development Avg. FTP (PSI) Morris & Gehrig Avg. FTP (PSI)
GPOR | 18SCOOP 2021 Development Plan & Recent Performance
Performance Observations
Frick Pad
(3 Wells) • SCOOP net production totaled ~275 MMcfepd during 3Q2021(1)
Angela Pad
• ~69% natural gas, 22% NGL and 9% oil(1)
(3 Wells)
• 2021 turn-in-line program concluded with 11 gross wells
• 2021 development performing above legacy well average
Legend Hale Pad
Gulfport Acreage (5 Wells) • Development also benefitting from lower development costs
2021 Development Program Production Cumulative Production
300 300 240
2021 turn-in-lines 2021 TIL
Gross 2-Stream Volume (MMcfed)
outperforming 2021 TIL Average
Cumulative Mcfe / ft of Lateral
Actual Forecast Legacy Well
expectations 180
200 200 Legacy Well Average
120
100 100
60
- - 0
Jan Feb Mar Apr May Jun Jul Aug Sep Oct Nov Dec 0 10 20 30 40 50 60 70 80 90 100 110 120
Angela Hale Frick Actuals Producing Days
1. During the three months ended September 30, 2021.
GPOR | 19Substantial Improvement in Cost Structure
Total Cost Per Unit ($/Mcfe)
• Targeting best in class cost metrics with
additional opportunities identified Total
$1.88
• Annual interest expense reduced by nearly
Total
$90 million $1.44
• Midstream gathering, processing and
transportation expense reduced by more
than $100 million on an annual basis ~23%
Reduction
Y-o-Y
• Operations control center and SCADA
technology leading LOE towards best in class
• Continuous improvement mindset driving
operational optimization and
enhanced margins 2020 2021E (1,2)
Interest Midstream GP&T Taxes Other Than Income G&A LOE
1. Utilizes midpoint of 2021E guidance.
2. 2021E midstream GP&T per unit cost assumes rejection of Rover firm transportation agreements.
GPOR | 20Targeting Top Quartile Corporate Overhead
Significantly reduced G&A expense Annual Recurring Cash G&A Expense(2,3)
• Decreased officer headcount by 30%
Decrease of
$80
• Flatter organization with leaner structure ~32% from 2019
• Lowered employee headcount by 25% $63
• Implemented rigorous G&A review and enhanced $60
budgeting process $52
• Retained technical, operating and business expertise
$43
$ Millions
Continued focus on reducing costs Updated
$40
full year 2021E
• Streamlined IT Systems guidance of
$42 - $44 million
• Reduced corporate office footprint
• Optimized use of outside services $20
Targeting top quartile G&A expense $0
of $0.12/Mcfe 2019 2020 2021E (1)
1. Beginning in June 2021, the corporate headquarters is now leased, increasing G&A expense by ~$2 million per year beginning in 2021.
2. Recurring Cash G&A Expense is a non-GAAP financial measure; see supplemental slides.
3. Recurring Cash G&A Expense includes capitalization. It excludes non-cash stock compensation and expenses related to certain legal, restructuring, financial advisory and consulting charges associated GPOR | 21
with corporate restructuring.Financial Update
Compelling Value for Shareholders
         Best-in-Class EBITDA Margins                                                                                                                                                           Lowest EV / EBITDA Multiple
            2021E Adjusted EBITDA / Mcfe(1,3,4)                                                                                                                                                      EV / 2021E Adjusted EBITDA(1,3,4,5)

$1.94        $1.91                                                                                                                                                                                                                                                                                                      7.8x
                                         $1.52                       $1.42                       $1.40                                                                                                                                                          5.3x                        5.5x
                                                                                                                             $1.27                                                                     4.8x                        5.0x
                                                                                                                                                                           3.6x

GPOR       Peer 1                      Peer 2                       Peer 3                      Peer 4                      Peer 5                                       GPOR                        Peer 1                      Peer 2                      Peer 3                       Peer 4                      Peer 5

        Peer-Leading Free Cash Flow Yield                                                                                                                                                      Peer-Leading Leverage Profile
                 2021E Free Cash Flow Yield(2,3,4)                                                                                                                                                           Net Debt / 2021E EBITDA(1,3,4)

                                                                                                                                                                                                                                                                 2.2x                        2.2x                        2.3x
 21%
                                                                                                                                                                                                                                     1.9x
               15%
                                           14%
                                                                       12%                                                                                                  1.2x                         1.2x
                                                                                                    9%                          9%

GPOR        Peer 1                      Peer 2                      Peer 3                      Peer 4                       Peer 5                                        GPOR                       Peer 1                      Peer 2                       Peer 3                      Peer 4                      Peer 5
           Note: GPOR estimates based on public guidance and internal forecast. Peer estimates sourced from public guidance or FactSet as of 10/20/2021.
           1.    2021E peer Adjusted EBITDA is sourced from FactSet as of 10/20/2021.
           2.    2021E peer free cash flow is sourced 2021E estimates from FactSet and calculated using 2021 estimates for adjusted EBITDA, less incurred capital expenditures, less interest. Free cash flow yield is calculated using free cash flow divided by current market capitalization 10/20/2021. GPOR free cash flow is
                 calculated using the same methodology.
           3.
           4.
                 Peers include AR, CNX, EQT, RRC and SWN.
                 Assumes rejection of Rover firm transportation agreement.
                                                                                                                                                                                                                                                                                                                      GPOR | 23
           5.    Enterprise value sourced from FactSet as of 10/20/2021.
Credit Facility Amendment Overview
Elected Commitments • $700 million Credit Facility(1)
Borrowing Base • $850 million
Redeterminations • Semi-annual, beginning May 1, 2022
Increase in Significant increase
elected commitments in liquidity
Maturity Date • October 2025
$700
• Reduced price grid by 25 basis points $388
Pricing at each level of utilization $580
• Eliminated 100-basis point floor
$228
• Leverage Ratio: < 3.25x
Financial Covenants
• Current Ratio: > 1.00x
• Ability to make restricted payments Prior Current Prior Current
Restricted Payments
from Available Free Cash Flow(2)
• Eliminated $40 million availability
Availability Blocker blocker imposed under previous
Accelerates ability to return capital to shareholders
credit agreement through dividends or share repurchases
1. As of 9/30/21 and pro forma for the October 14, 2021 amendment of the Company’s credit facility. Liquidity comprised of cash and cash equivalents and available borrowing capacity
under the Company’s prior exit facility compared to its current new credit facility.
2. Available Free Cash Flow as defined in the Credit Agreement. GPOR | 24Capital Structure and Financial Profile
Third Quarter 2021 Overview As of September 30, 2021(2)
• $4 million of cash equivalents $700
$700
Cash and Liquidity
• ~$388 million of liquidity(1,2) No Significant
$600 Maturities $550
• $200 million of borrowings
$500
Until 2025
Debt • $115 million of L/Cs
($ Millions)
• $550 million of senior notes $400
$315 Coupon
• Common Stock: 20.6 million shares $300 8.000%
Equity • Preferred Stock: 57.9 thousand shares
• Dividend: 10% cash / 15% PIK $200
$100 Maturity Maturity
Hedge Snapshot(3) Oct. 2025 May 2026
$-
FY’22 FY’23 2021 2022 2023 2024 2025 2026
Total Elected Commitments Borrowings
Gas Swaps & Collars / day 547,486 64,932
Outstanding L/Cs Senior Notes
Hedged % of Net Production ~60% ~7%
Weighted Avg. Floor $2.65 $3.39 Forecast leverage below 1.2x(4) by YE21
1. Liquidity defined as cash plus borrowing base availability.
2. Pro forma for the Amendment and as of September 30, 2021.
3. Excludes fixed priced calls sold. Counterparty has option to call. GPOR | 25
4. Year-end 2021E net debt to 2021E Adjusted EBITDA at strip pricing as of 9/30/2021. Net debt is a non-GAAP measure. It is defined as total long-term debt minus cash and cash equivalents.Appendix
Updated 2021E Guidance
                                                                                                                       FY 2021E                                                                                                                                                            FY 2021E
                                                                                                                       Guidance                                                                                                                                                            Guidance

Production                                                                         PREVIOUS                            UPDATED                             Incurred Capital Expenditures                                                           PREVIOUS                           UPDATED

                                                                                                                                                                 D&C - $ millions                                                                $270           $290                  $270 $290
   Average Net Daily Gas Equivalent – MMcfe/d                                    975             1,000                 980            1,000
                                                                                                                                                                 Leasehold and Land - $ millions                                                        ~$20                                ~$20
   % Gas                                                                                 ~90%                                ~90%
                                                                                                                                                           Total Incurred Capital Expenditures –                                                 $290           $310                  $290 $310
                                         (1,2)
Realizations (before hedges)                                                                                                                               $ millions

   Natural Gas (Differential to NYMEX) - $/Mcf                                ($0.10)          ($0.20)             ($0.10) ($0.20)
                                                                                                                                                           Free Cash Flow(3) - $ millions                                                        $290           $310                  $345 $365
   NGL (% of WTI)                                                                45%              50%                  55%             60%
   Oil (Differential to NYMEX WTI) - $/Bbl                                    ($3.00)          ($4.00)             ($3.00) ($4.00)

Operating Costs

   Lease Operating Expense - $/Mcfe                                            $0.13             $0.15               $0.13            $0.15
   Taxes Other Than Income - $/Mcfe                                            $0.11             $0.13               $0.11            $0.13
   GP&T(2) - $/Mcfe                                                            $0.92             $0.96               $0.92            $0.96
   Recurring Cash G&A Expense(3) - $ millions                                    $45              $47                  $42             $44

                      Note: Guidance for the year ending 12/31/21 is based on multiple assumptions and certain analyses made by the Company based on its experience and perception of historical trends and current conditions and may change due to future developments. Actual results
                      may not conform to the Company’s expectations and predictions. Please refer to page 2 for more detail of forward-looking statements.
                      1.    Based upon current forward pricing at 9/30/2021 and basis marks.
                      2.    Assumes rejection of Rover firm transportation agreement.                                                                                                                                                                                                        GPOR | 27
                      3.    Free Cash Flow and Recurring Cash G&A Expense are non-GAAP financial measures; see supplemental slides.
2021E Development Plan Overview
2021E Development Plan(2) Average Lateral Length(1)
Capital Expenditures ~$195 Million(3) ~15,000'
12,550’
Well Count Lateral Length 11,350'
9,750'
Utica Spuds 21 Gross (20.0 Net) 15,100' 7,700' 8,000'
Completions 17 Gross (17.0 Net) 12,550'
Turn-to-Sales 17 Gross (17.0 Net) 12,550'
2017 2018 2019 2020 2021 2022E+
2021E Development Plan(2) Average Lateral Length(1)
Capital Expenditures ~$85 Million(3) ~10,000'
9,450’
Well Count Lateral Length 7,750' 7,900'
6,800' 6,500'
SCOOP Spuds 6 Gross (5.7 Net) 9,900'
Completions 11 Gross (9.3 Net) 9,450'
Turn-to-Sales 11 Gross (9.3 Net) 9,450'
2017 2018 2019 2020 2021 2022E+
1. Represents wells turned-to-sales in each time period.
2. As of 11/1/2021.
3. Utilizes midpoint of guidance range. GPOR | 28Advantaged Firm Portfolio Provides Access to Diverse Markets
• Right-sized and diversified takeaway capacity
• 725 MDth/d(1,2) of firm takeaway from the Utica
• 175 MDth/d(1) of firm takeaway from the SCOOP
• Upstream connectivity provides multiple outlets
• Optionality provides opportunity to capture highest price
• Access to numerous takeaway options out the basin Midwest
MidCon
SCOOP Basin Utica Basin+
Oct – Dec Utica Basin
Basis Region Exposure(1,2) 2022E(3)
2021E(3)
Midwest 550,000 Dth/d firm takeaway 50% 55%
Gulf 175,000 Dth/d firm takeaway 20% 20%
Utica
Utica Basin+ Premium to in-basin 20% 15%
Utica Basin In-basin 10% 10% Gulf
100% 100%
MidCon 175,000 Dth/d firm takeaway 75% 70%
SCOOP
SCOOP Basin In-basin 25% 30%
100% 100%
1. Primary reservation volume only. Excludes zero-leg and secondary-leg reservation volume. Assumes run-rate gross reservation volume on a MDth/d basis.
2. Assumes rejection of Rover firm transportation agreements.
3. Percentages represent approximate exposure to basin regions. GPOR | 29Hedged Production
Hedge Book(1)
Natural Gas Oil Propane
Swaps Collars Calls Sold Swaps Collars Swaps
Volume Avg. Price Volume Avg. Put Avg. Call Volume Avg. Call Volume Avg. Price Volume Avg. Put Avg. Call Volume Avg. Price
MMBtu/d $/MMBtu MMBtu/d $/MMBtu $/MMBtu MMBtu/d $/MMBtu Bbl/d $/Bbl Bbl/d $/Bbl $/Bbl Bbl/d $/Bbl
Bal 2021(2) 198,000 $2.85 610,000 $2.59 $3.02 - - 3,000 $57.67 - - - 3,100 $27.80
1Q 2022 - - 535,000 $2.78 $3.31 152,675 $2.90 1,400 $66.58 1,500 $55.00 $60.00 3,000 $33.18
2Q 2022 150,000 $2.84 381,500 $2.48 $2.72 152,675 $2.90 2,000 $66.27 1,500 $55.00 $60.00 3,000 $33.18
3Q 2022 150,000 $2.84 363,500 $2.48 $2.72 152,675 $2.90 2,000 $66.27 1,500 $55.00 $60.00 3,500 $36.55
4Q 2022 260,000 $2.92 349,500 $2.48 $2.73 152,675 $2.90 3,000 $66.03 1,500 $55.00 $60.00 4,000 $36.62
FY 2022 140,740 $2.88 406,747 $2.58 $2.91 152,675 $2.90 2,104 $66.23 1,500 $55.00 $60.00 3,378 $35.09
1Q 2023 80,000 $3.34 - - - 627,675 $2.90 - - - - - - -
2Q 2023 60,000 $3.42 - - - 627,675 $2.90 - - - - - - -
3Q 2023 60,000 $3.42 - - - 627,675 $2.90 - - - - - - -
4Q 2023 60,000 $3.42 - - - 627,675 $2.90 - - - - - - -
FY 2023 64,932 $3.39 - - - 627,675 $2.90 - - - - - - -
Note: The Company has 100,000 MMBtu/d of REX Zone 3 Basis Swaps at ($0.10)/MMBtu for the balance 2021 and 1Q2022; 20,000 MMBtu/d of OGT Basis Swaps at $0.50/MMBtu for the balance of 2021
and 20,000 MMBtu/d of OGT Basis Swaps at $0.50/MMBtu for 1Q2022.
1. As of 11/1/21. GPOR | 30
2. 11/1/2021 – 12/31/2021.Adjusted EBITDA
Adjusted EBITDA is a non-GAAP financial measure equal to net (loss) income, the most directly comparable GAAP financial measure, plus interest expense, income tax expense,
depreciation, depletion and amortization and impairment of oil and gas properties, property and equipment, non-cash derivative loss, non-recurring general and administrative expenses,
restructuring and liability management expenses, loss from equity method investments and other items which include rig termination fees, stock-based compensation and other non-
material expenses.
Below is a reconciliation of net income (loss) (a GAAP measure) to Adjusted EBITDA. This non-GAAP measure should be considered by the reader in addition to, but not instead of,
the financial statements prepared in accordance with GAAP.
(In thousands)
(Unaudited)
Successor Predecessor
Three Months Ended September 30, 2021 Three Months Ended September 30, 2020
Net (loss) income (GAAP) $ (461,313) $ (380,963)
Adjustments:
Interest expense 16,351 34,321
Income tax expense 650 -
DD&A and impairment 63,061 323,199
Non-cash derivative loss 529,590 83,955
Non-recurring general and administrative expenses 9,554 12,742
Restructuring and liability management expenses 2,858 8,984
Loss from equity method investments - 153
Other, net 9,930 464
Adjusted EBITDA (Non-GAAP) $ 170,681 $ 82,855
GPOR | 31Free Cash Flow
Free Cash Flow is a non-GAAP measure defined as adjusted EBITDA plus certain non-cash items that are included in net cash provided by (used in) operating activities but excluded from
adjusted EBITDA less interest expense, capital expenses incurred, accrued capital expenditures. Gulfport includes a Free Cash Flow estimate for 2021. We are unable, however, to provide
a quantitative reconciliation of the forward-looking non-GAAP measure to its most directly comparable forward-looking GAAP measure because management cannot reliably quantify
certain of the necessary components of such forward-looking GAAP measure.
Below is a reconciliation of net cash provided by (used in) operating activities (the most comparable GAAP measure) to Free Cash Flow. This non-GAAP measure should be considered by
the reader in addition to, but not instead of, the financial statements prepared in accordance with GAAP.
(In thousands)
(Unaudited)
Successor Predecessor
Three Months Ended September 30, 2021 Three Months Ended September 30, 2020
Net cash provided by operating activity (GAAP) $ 126,272 $ (47,221)
Adjustments:
Interest expense 16,351 34,321
Current Income tax benefit 650 -
Non-recurring general and administrative expenses 9,554 12,742
Restructuring and liability management expenses 2,858 8,984
Other, net 8,532 (1,671)
Changes in operating assets and liabilities, net 6,464 75,700
Adjusted EBITDA (non-GAAP) $ 170,681 $ 82,855
Interest expense (16,351) (34,321)
Capitalized expenses incurred(1) (3,706) (6,380)
Capital expenditures incurred(2) (80,914) (47,650)
Free Cash Flow (Non-GAAP) $ 69,710 $ (5,496)
1. Includes capitalized general and administrative expense incurred and capitalized interest expenses incurred.
2. Incurred capital expenditures and cash capital expenditures may vary from period to period due to the cash payment cycle.
GPOR | 32Recurring General and Administrative (G&A) Expense
Recurring General and Administrative Expense is a non-GAAP financial measure equal to general and administrative expense (GAAP) plus capitalized general and administrative expense,
less non-recurring general and administrative expense, which includes expenses related to certain legal and restructuring charges. Gulfport includes a Recurring Cash General and
Administrative Expense estimate for 2021. We are unable, however, to provide a quantitative reconciliation of the forward-looking non-GAAP measure to its most directly comparable
forward-looking GAAP measure because management cannot reliably quantify certain of the necessary components of such forward-looking GAAP measure.
Below is a reconciliation of general and administrative expense (the most comparable GAAP measure) to Recurring General and Administrative Expense. This non-GAAP measure should
be considered by the reader in addition to, but not instead of, the financial statements prepared in accordance with GAAP.
(In thousands)
(Unaudited)
Successor Predecessor
Three Months Ended Three Months Ended
September 30, 2021 September 30, 2020
Cash Non-Cash Total Cash Non-Cash Total
General and administrative expense (GAAP) $ 15,792 $ 899 $ 16,691 $ 19,956 $ 375 $ 20,331
Capitalized general and administrative expense 3,590 484 4,074 5,885 299 6,184
Non-recurring general and administrative expense(1) (9,554) - (9,554) (12,742) - (12,742)
Recurring General and Administrative Expense (Non-GAAP) $ 9,828 $ 1,383 $ 11,211 $ 13,099 $ 674 $ 13,773
1. Includes non-recurring general and administrative expenses related to certain legal and restructuring charges.
GPOR | 33Thank You. Investor Relations 405.252.4550 investor_relations@gulfportenergy.com www.gulfportenergy.com
You can also read