INVESTOR PRESENTATION - February 2021 - Western Forest Products

Page created by Laura Mcguire
 
CONTINUE READING
INVESTOR PRESENTATION - February 2021 - Western Forest Products
INVESTOR PRESENTATION
February 2021

                        TSX:WEF
INVESTOR PRESENTATION - February 2021 - Western Forest Products
Forward Looking Statements and Non-GAAP
Financial Measures
All financial references are expressed in C$ unless otherwise noted.
This presentation contains statements and estimates that may constitute forward-looking
statements under the applicable securities laws. Readers are cautioned against placing
undue reliance on forward-looking statements. All statements herein, other than
statements of historical fact, may be forward-looking statements and can be identified by
the use of words such as “will”, “estimate”, “commit”, ”anticipate”, “expect”, “should”,
“may”, “pursue”, “explore” and similar references to future periods.
Forward-looking statements in this presentation include, but are not limited to, statements
relating to our current intent, belief or expectation with respect to: domestic and
international market conditions, demands and growth; economic conditions; our
acquisition, growth, marketing, product, wholesale, operational and capital allocation
plans and strategies including, but not limited to, our dividend plan and share repurchase
plan; our expected operating results; our competitive position and expectations regarding
future competition; fibre availability and regulatory developments; the impact of the
COVID-19 pandemic; the anticipated closing of the transaction with Huumiis Ventures
Limited Partnership and the sale of additional incremental ownership interest in TFL 44
LP in the future.
Although such statements reflect management’s current reasonable beliefs, expectations
and assumptions regarding the future of our business, future plans and strategies,
projections, anticipated events and trends, the economy and other future conditions, there
can be no assurance that forward-looking statements are accurate, and actual results and
performance may materially vary. Many factors could cause our actual results or
performance to be materially different including: economic and financial conditions,
demand for forest products, competition and selling prices, international trade disputes,
changes in foreign currency exchange rates, labour disputes and disruptions, natural
disasters, relations with First Nations groups, the availability of fibre and allowable annual
cut, developments and changes in laws and regulations affecting the Company or the
forestry industry, changes in the price of key materials for our products, changes in
opportunities, existence of a public health crisis (including future developments in the
COVID-19 pandemic) and other factors discussed in the Company’s annual MD&A, which
is available on our website at www.westernforest.com. The foregoing list is not
exhaustive, as other factors could adversely affect our actual results and performance.
Forward-looking statements are based only on information currently available to us and
refer only as of the date hereof. Except as required by law, we undertake no obligation to
update forward-looking statements.
During the course of this presentation, certain non-GAAP financial information will be
presented. Definitions and reconciliation of terms can be found in the Company’s annual
and quarterly MD&A for Western Forest Products Inc. (the “Company”).

                                                                                                 1
INVESTOR PRESENTATION - February 2021 - Western Forest Products
Western At A Glance
A Sustainable, Specialty Wood Products Company
INVESTOR PRESENTATION - February 2021 - Western Forest Products
Western At a Glance

Sustainable               $1+ Billion           $150+ Million                  39%               $625 Million
    Products and         In Historical Annual    In Historical Annual   Of Historical Sales to   Market Capitalization
      Practices          Revenue Achieved         EBITDA Achieved       International Markets    and Listed on the TSX

     Strong                1+ Billion                 Four              6 Million m3                  2,100+
Environmental, Social,   Board Feet of Annual    Remanufacturing        Of Allowable Annual           Employees
& Governance (“ESG”)      Lumber Capacity        Facilities and One     Cut From Our B.C.
Practices and Policies      at 8 Sawmills        Distribution Centre        Timberlands

                         A Global Leader In Specialty Lumber Products                                                    3
INVESTOR PRESENTATION - February 2021 - Western Forest Products
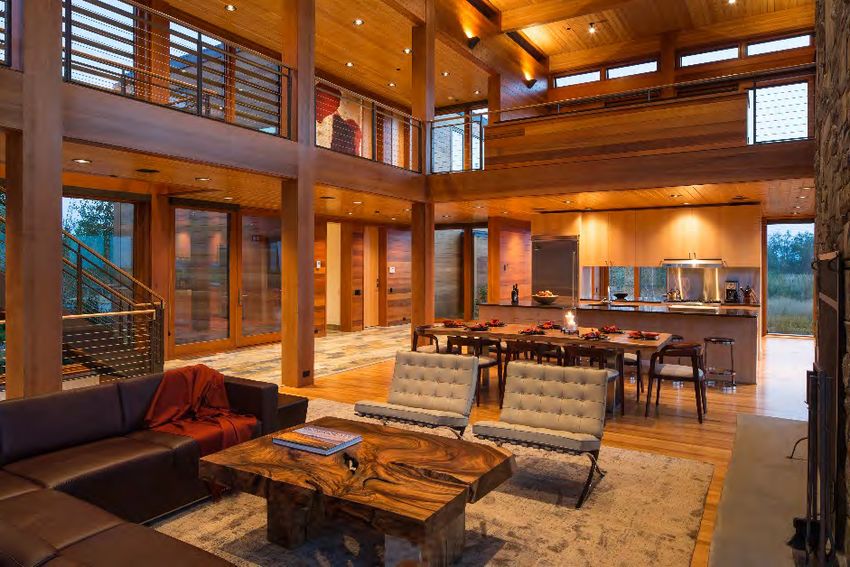
Western’s Lumber Products Are Used In Multiple
Sustainable End Uses Around The World

Outdoor Living        Home Components              Millwork           Non-Residential                 Industrial

                        Timbers, Siding,                                                          Cross & Transmission
                                              Door, Window, Stair
Outdoor Structures,      Paneling, Trim                               Architectural Fixtures,   Arms, Mat Stock, Bridges,
                                             Components, Moulding,
 Decking, Fencing      & Soffits, Japanese                             Lamstock, Timbers         Docks & Railway Ties,
                                              Furniture, Decorative
                        Housing, Framing                                                           Packaging & Crating

Western’s Products Come From The World’s Most Sustainable Building Material                                            4
INVESTOR PRESENTATION - February 2021 - Western Forest Products
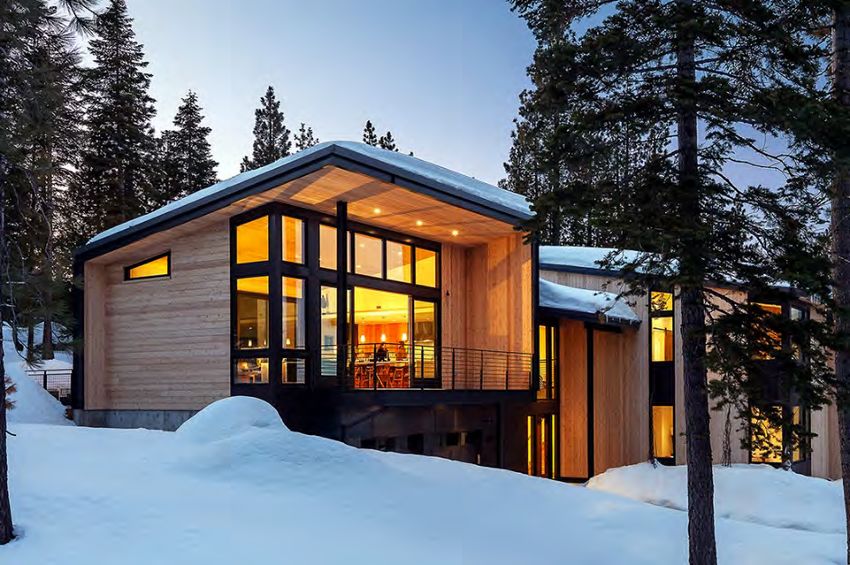
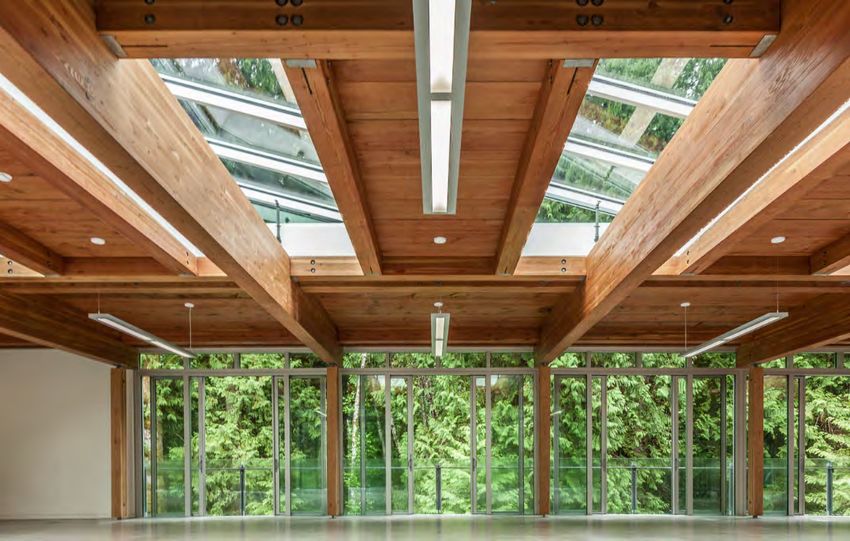
Wood Is Sustainable, Durable and Naturally Beautiful

                                                       5
INVESTOR PRESENTATION - February 2021 - Western Forest Products
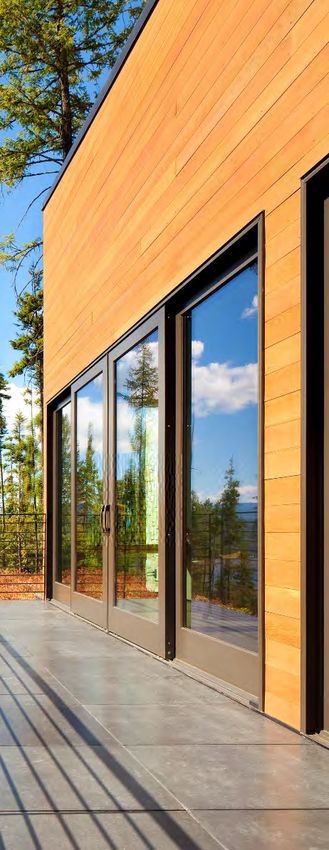
Wood Is The World’s Most Sustainable Building Material

                       Wood is the only major building material                                                    Sustainability of Wood vs. Steel vs. Concrete(1)
                       that is renewable                                                                                      Total Energy Use               Greenhouse Gases
                                                                                                                                   +140%

                                                                                                                                                 +70%                               +81%
                                                                                                                                                                      +45%
                       Wood is recyclable and biodegradable and
                       comes from sustainably managed forests

                                                                                                                       Wood         Steel      Concrete   Wood         Steel       Concrete

                       Wood products play an important role in
                                                                                                                               Air Pollution                      Solid Waste
                       mitigating climate change                                                                                                                                   +96%
                                                                                                                                                +67%
                                                                                                                                   +42%                               +36%

                       Wood products helps reduce greenhouse
                       gases and has the lowest impact of all
                       building materials on air and water quality
                                                                                                                       Wood        Steel       Concrete   Wood        Steel     Concrete

                                                                                                                       Ecological Resource Use                   Water Pollution
                       Wood products require less energy to
                                                                                                                                                                     +1,900%
                       produce than concrete and steel                                                                                          +97%
                                                                                                                                                                                   +97%
                                                                                                                                   +16%

                       Wood products result in less solid waste
                       than concrete and steel
                                                                                                                       Wood        Steel       Concrete   Wood        Steel     Concrete

(1) Source: ATHENA™ Sustainable Materials Institute life-cycle research via the Western Red Cedar Lumber Association

  Wood Products Outperform Steel And Concrete From A Sustainability Perspective                                                                                                               6
INVESTOR PRESENTATION - February 2021 - Western Forest Products
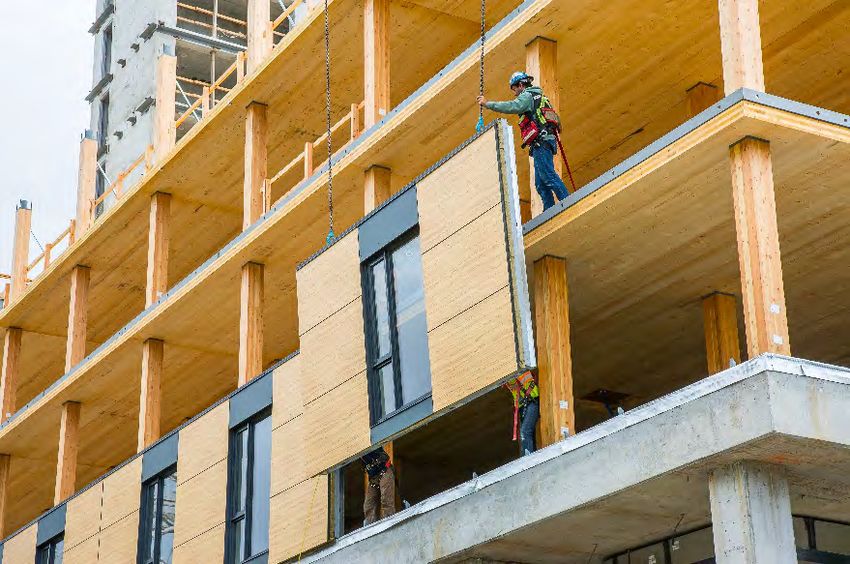
Mass Timber Buildings Further Support The Growth Of
      Wood As A Sustainable Building Product

            Increase use of wood in buildings
                – Potential for 4 to 7 billion board feet in
                  incremental lumber demand(1) by 2035
            Building code changes supporting the
             growth of wood use
            Climate change benefits
                   Maximizing wood use in
                     both residential and                                   www.naturallywood.com

                   commercial construction
                  could remove an estimated

                    21 Million                = 4.4  Million
                  Tons of CO2 Annually           Cars Taken Off
                                                  The Road Annually(2)

            Links to additional industry resources
             and information

(1)   RBC research                                                           www.naturallywood.com
(2)   Source: Think Wood

                 A Sustainable Opportunity To Grow The Demand For Wood Products                      7
INVESTOR PRESENTATION - February 2021 - Western Forest Products
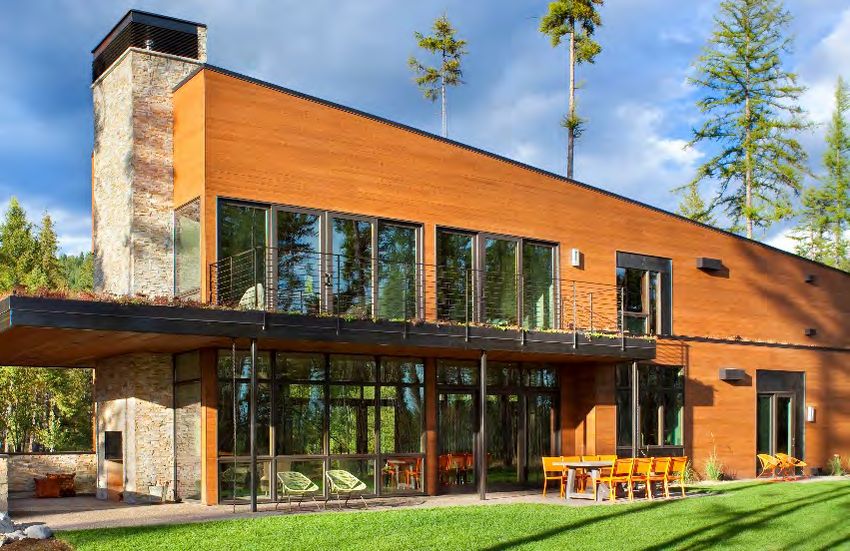
Wood Products Play An Important Role in Mitigating
Climate Change

                             Growing trees absorb
                            carbon from the air and
           New trees are
                                release oxygen
          planted and the
          cycle of carbon
        removal continues

                               As trees mature the
    When trees are
                                  rate of carbon
 harvested, the carbon
                               removal decreases
   remains stored in
    wood products
                                                      8
INVESTOR PRESENTATION - February 2021 - Western Forest Products
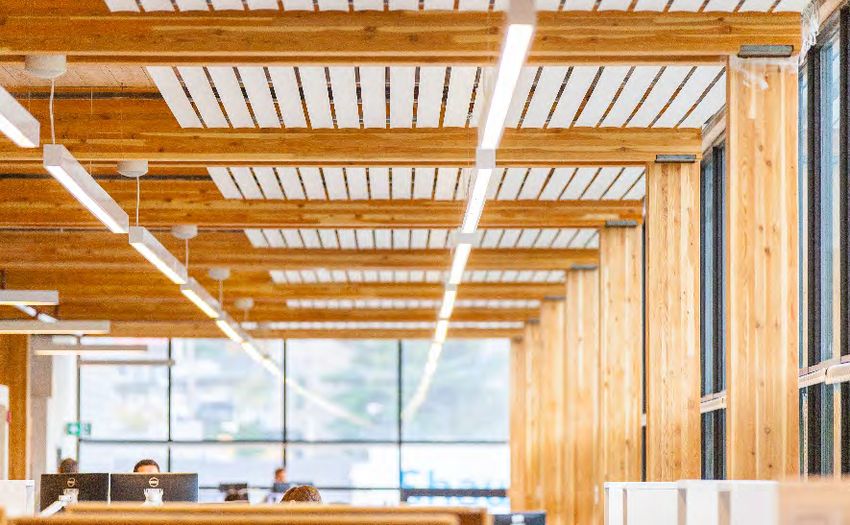
Western’s Commitment To ESG

                                                     2019 Sustainability Report
          Environment Stewardship
          Sustainable Forestry Practices,
          Sustainable Products, Climate
               Change, Biodiversity

             Social Responsibility
            Health & Safety, People &
           Culture, Diversity, Stakeholder
            & Community Engagement

            Corporate Governance
               Best Practices, Board
             Composition and Diversity,
             Executive Compensation,
                 Ethics, Integrity
                                             Report Link: 2019 Sustainability Report

     Western Is Committed To Defining A Higher Standard® On ESG                        9
Western’s ESG Highlights

          Environmental Stewardship                                        Social Responsibility

                                20+ Million                               Goal of a                         38%
                             seedlings planted
                                                                      zero-incident                  Women executive &
                            over the last 3 Years                                                     corporate officers
                                                                         workplace
        100%
   of our managed                     Over 1,500 wildlife                                          Ongoing
      tenures are                      habitats protected       Promote diversity
                                                                                                 stakeholder
      certified by                                                 at all levels
                                                                                                 engagement
                          Consider climate change
                           in our forest planning                        Advancing mutually beneficial relationships and
                                                                         reconciliation with First Nations

                 Over 275,000 hectares protected for
                                                                          Corporate Governance
                   wildlife and biodiversity features

                                                                            Top                             38%
                                                                        governance                      Women board
  Maximize utilization of
                                                                       score from ISS                    directors
harvested logs to limit waste
                                              Reforest
                                            every hectare          88%                           Comprehensive
         Manage biodiversity and             we harvest                                           policies and
                                                                Independent
         other environmental values                                                                  ethical
                                            No deforestation   board members
          to maintain forest health                                                                standards

                                                                                                                           10
ESG – Environmental Stewardship
                    100% of our managed tenures            Only forestry company in British
                     are certified                           Columbia to operate a seed
                                                             orchard and tree nursery
                    Sustainably manage and
                     harvest the entire forest profile      Planted over 20 million
                     over generations                        seedlings over the last 3 years

Sustainability      Reforest every hectare we              Limit wood waste in our
                     harvest                                 operations

                    Forests play a key role in the         Implement energy reduction /
                     global carbon balance and               efficiency initiatives in our
                     sequestering carbon                     sawmills

                    Consider climate change in our         In 2019 we replaced a
                     forest planning                         significant portion of our forklift
                                                             fleet with new fuel-efficient
   Climate          Manage fertilization to improve         models, reducing annual fuel
   Change            soil nutrient to increase carbon        consumption by 15%
                     sequestration in coastal forests

                    Manage biodiversity and other          First forestry company in British
                     environmental values to                 Columbia to issue a policy on
                     maintain forest health                  “Big Trees”

                    Standards in place that protect        Manage for water quality and
                     both species and habitat                quantity, community
                                                             watersheds and streams /
Biodiversity                                                 riparian areas

         Western Is Committed To The Strongest Environmental Practices                             11
ESG – Social Responsibility
                   Our goal is a zero-incident             Comprehensive hands-on, job-
                    workplace                                specific training

                   Annual safety training for all          Independent audits and inspections
                    employees and contractors
                                                            Environmental, Health and Safety
                   ISNetworld certification process         Board committee
   Health           for contractors
  & Safety                                                  Comprehensive Health and Safety
                                                             Management System

                   Provide equal opportunity and           Invest in our people through annual
                    promote diversity at all levels          training and education

                   Total rewards approach to               Women represent 38% of our
                    compensation to attract, retain          executive and corporate officers
                    and motivate employees                   (industry average of 23%)

  People           Support freedom of association          Indigenous employment is an
 & Culture          and collective bargaining                important component for the
                                                             diversity of our workforce

                   Committed to advancing                  Engage with a broad range of
                    mutually beneficial relationships        stakeholders
                    and reconciliation with First
                    Nations                                 Stakeholders have provided
                                                             feedback to our ESG progress and
                   Positive working relationships           reporting
                    with First Nations through
First Nations       information sharing, timber             Focus on supporting initiatives that
                    harvesting, silviculture, planning       promote culture, recreation,
& Community         and other mutually beneficial            education and sustainability
                    arrangements

      Western Is Committed To Our People, Communities And Stakeholders                              12
Reconciliation With First Nations: Western and
Huu-ay-aht First Nations, A Success Story
       Building a Mutually Beneficial Relationship
       with Huu-ay-aht First Nations
2017      Established a relationship
             – Sale and purchase of three properties
             – Long-term lease back of a dry land sort in Sarita Bay, B.C.
             – Market log harvesting agreement for 200,000 m3

          Employment and training agreement to increase the number
           of Huu-ay-aht citizens participating in the forest sector

2018      Signed a Reconciliation Protocol Agreement
          Continued to explore potential alternative ownership
           structures in Huu-ay-aht’s traditional territories

2019      Completion of Huu-ay-aht’s purchase of a 7% ownership
           interest in a newly formed limited partnership (TFL 44 LP),
           consisting of certain assets in Western’s Port Alberni Forest
           Operations, including Tree Farm Licence 44

2020      Announced Huu-ay-aht’s purchase of an incremental
           ownership interest in TFL 44 LP from Western

                       Developing Mutually Beneficial Relationships
                       To Advance Reconciliation With First Nations          13
ESG – Corporate Governance
                  Top governance score from ISS                     Majority voting for director election

                  Independent Board Chair                           Whistleblower hotline

                  Annual elections                                  Comprehensive and transparent disclosure

    Best          Annual director assessments                       Shareholder engagement
  Practices       Annual say-on-pay voting                          Diversity and inclusion policy

                  88% of directors are independent                  Average director tenure of
Why Own Western

   Manufacturer of sustainable wood products

         Strong ESG practices and policies

                Business of scale and leader in our key markets

                     Superior timber asset base and secure fibre supply

                     High-value, diverse products serving global markets

                Specialty product focus provides greater earnings stability

         Margin-focused strategy with exposure to growing lumber demand

   Balanced approach to capital allocation with a quarterly dividend

        Western Is The Premier Wood Products Company To Own                   15
Company Snapshot
Sustainably Growing and Creating Long-term Shareholder Value
Who We Are:
Our Mission, Vision and Values

    Our Vision:
    To provide the most sustainable
    building materials on the planet

    Our Mission:
    We safely produce high margin, targeted
    specialty building materials for our selected global
    customers in a value for service relationship

    Our Values:
    Our values guide us in Defining a Higher
    Standard® in what we do:
     We are committed to personal safety,
       sustainable management and environmental
       stewardship
     We behave with integrity, passion and
       transparency
     We seek mutually beneficial relationships
     We are dedicated to a culture of accountability
       and continuous improvement

                             Defining a Higher Standard®   17
What We Do:
Margin-Focused, Specialty Lumber Company

   Leading cedar lumber, timbers
    and Japan square manufacturer
    in North America

   Offer a range of appearance,
    structural and industrial wood
    products

   Our products are used in various
    outdoor living, home components,
    millwork, non-residential and
    industrial applications

   Diverse species mix, offering
    cedar, hemlock, balsam and
    Douglas fir products

   Global customer base

       Western Is A Leading Global Supplier Of Specialty Wood Products   18
Where Do We Do It:
      Serve Global Markets From Coastal B.C. and Washington

                                                                                                       6 Million
                                                                                                  Cubic Metres In Allowable
                                                                                                    Annual Cut From Our
                                                           Coastal B.C.                           Coastal B.C. Timberlands
                                                                 7 Sawmills
                                                                 2 Remanufacturing Facilities
                                                                 Timberlands                         1+ Billion
                                                                 Seedling Nursery               Board Feet of Annual Lumber
                                                                                                   Capacity at 8 Sawmills

                                                           Arlington, Washington                          Four
                                                                 Distribution Centre             Remanufacturing Facilities
                                                                 Remanufacturing                and One Distribution Centre

                                                           Vancouver, Washington                       Flexible
                                                           (Columbia Vista)                         Operating Platform
                                                                  Sawmill                        That Can Target a Variety
                                                                  Remanufacturing Facility          of Global Markets
See Appendix for detailed listing of sawmills and remanufacturing facilities

               Strategically Located Manufacturing Locations With Secure Fibre Supply                                         19
How We Have Performed:
      Financial Snapshot

                            $1+ Billion                                         Annual Sales by Product(1)                                                      59%
                                                                                                                                                              Specialty
                             In Historical Annual                                                                                       5%                     Lumber
                             Revenue Achieved                                       Specialty Lumber
                                                                                                                                19%
                                                                                    Commodity Lumber
                       $150+ Million                                                                                                   $1.1
                             In Historical Annual                                   Logs                                                billion         59%
                              EBITDA Achieved                                                                                   17%
                                                                                    By-products

                                      12%
                          Net Debt / Book Cap at
                            the end of Q4/20
                                                                                Annual Sales by Geography(1)                                                   39%
                                                                                                                                                          International
                         $178 Million                                                Canada                                                       17%
                              Available Liquidity                                                                               25%
                             at the end of Q4/20                                     United States
                                                                                     China                                             $1.1             13%

                                                                                     Japan                                              billion
                         $625 Million                                                                                                                7%
                          Market Capitalization(2)                                   Other                                                          2%
                                                                                                       Final destination of a
                                                                                                        portion of Canadian           36%
                                                                                     Europe                 sales are to
                                                                                                       international markets
(1) Annual average from 2015 to 2020, including strike impacted 2019 and 2020
(2) Based on closing share price of $1.67 on February 25, 2021

                     Strong Financial Performance And Well Capitalized Balance Sheet                                                                                20
What Are Our Priorities:
Sustainably Execute On Our Long-term Priorities

                             Explore Opportunities
                              Pursue margin-focused business opportunities
                              Grow our wholesale lumber and branded products business
                              Specialty products acquisitions

                 Grow the Base
                  Optimize operations to improve margins
                  Targeted, high-margin products of scale to selected customers
                  Non-capital margin improvement and growth initiatives

       Strengthen the Foundation
       Strategic capital investments
       Invest in our people and systems
       Mutually beneficial relationships with First Nations

              Focus On Growing Long-term Shareholder Value                               21
Company Updates
Sustainably Executing On Our Strategic Priorities
Re-Establishing Our Business Post The USW Strike,
      Despite COVID-19 Uncertainty
                                                                            Quarterly EBITDA – Last 8 Quarters
         Robust COVID-19 health and                                        ($ millions)
          safety protocols in place                                                                                                               Post Strike
                                                                                                                                                                       (1)
                                                                                                                                                                  $40
                                                                                                                                                        $34
         Re-established earnings                                                                                                          $30
                                                                                 $18       $15
          capabilities of the business                                                                       Strike Impacted

             – Three quarters of strong
               results post the USW strike,                                                          ($17)         ($18)       ($17)

               despite COVID-19                                                 Q1/19      Q2/19     Q3/19         Q4/19       Q1/20     Q2/20        Q3/20      Q4/20

             – Post strike average quarterly                                Net Debt – Last 3 Quarters                                 Quarterly EBITDA
                                                                            ($ millions)                                               ($ millions)
               EBITDA above pre-strike
                                                                                                             55%
               levels                                                            $152
                                                                                                         decline                            $33                  $34

                                                                                             $119
         Significant reduction in debt
                                                                                                             $69
             – Net debt to book capitalization
               of 12% at end of Q4/20
(1)   Excludes duty recovery of $31.6 million in Q4/20                           Q2/20       Q3/20       Q4/20                           Pre-Strike           Post Strike
(2)   Quarterly average of Q2 to Q4 EBITDA from 2015 to 2019 (pre-strike)                                                                 Average (2)          Average (1) (3)
(3)   Quarterly average of Q2/20, Q3/20 and Q4/20 EBITDA

                               Success In Re-Establishing Our Business Post The Strike                                                                                           23
Leveraging Our Flexible Operating Platform To
      Capitalize On Changing Lumber Markets

           Utilize our flexible operating                                        Commodity Lumber Shipments
                                                                                  (% of Total Commodity Lumber Shipments)
            platform
           Allows for redirection between                                                       67%
                                                                                                                                  42%               Export

            products and markets                                                                               Significant
                                                                                                                 shift in
                                                                                                                                  58%
                                                                                                                                                    North
               – During Q3/20, redirected
                                                                                                               commodity
                                                                                                 33%            volumes                            America
                 lumber production to focus on
                                                                                      5-Year Historical Average                  Q4/20
                 North American markets (vs.
                 export)
                                                                                  Commodity Lumber Prices                                                Divergence

               – Capitalize on the dramatic                                       (US$ per mfbm)                                                          in prices

                 increase in North American
                                                                                  $1,000
                 lumber prices
                                                                                   $800

           Flexibility to adjust production                                       $600

            based on market demand and                                             $400

            prices                                                                 $200
                                                                                           '16         '17            '18         '19              '20         '21
                                                                                                                      (1)                    (2)
(1)   Hemlock Lumber 2x4 (40x90) Metric RG Utility, c.i.f. destination Shanghai                              Export          North America
(2)   Coast KD Hem-Fir #2 & Btr 2x4, net f.o.b. mill

            Flexible Operating Platform Gives Western The Opportunity To Redirect
           Volume Between Different Markets, Leading To Greater Earnings Stability                                                                                    24
Reduction In Softwood Lumber Duties Will Benefit
      Specialty Lumber Manufacturers

           Effective December 2020                                 U.S. Countervailing & Anti-Dumping Duty Rates
                                                                    (All Others Duty Rate %)

           56% reduction in Western’s total                                        20.23%
                                                                                                                        56%
                                                                                                                       decline
            duty deposit rate
                                                                                                                       8.99%
           Duties on deposit of $124 million
            (US$95 million)(1)
                                                                                 Previous                           Current
               – Equates to 20% of Western’s
                 market capitalization(2)                           Illustrative Duties Savings of Revised Duty Rates(3)
                                                                    (US$ per mfbm)

               – Only $37 million included on                                                         Specialty Lumber Products
                                                                                               $202
                 Western’s balance sheet(1)
                                                                                                                $137
           Average duties savings per                                                                                            $108

            board foot greater on specialty                                $42
            lumber vs. commodity lumber
                                                                        Commodity      Western Red Cedar Western Red Cedar Western Red Cedar
(1)   As of December 31, 2020                                            Lumber           6x6 Timber          Decking        Boards / Trim
(2)   Based on market capitalization as of February 25, 2021
(3)   Based on Random Lengths average benchmark prices since 2017

               Western Will Benefit From The Reduction In Softwood Lumber Duties                                                               25
Balance Sheet Is Well Capitalized, Providing Western
With Significant Financial Flexibility

   Success in reducing leverage           Net Debt | Net Debt / Net Book Capitalization
                                           ($ millions | %)
    to below pre-strike levels                                           Strike Period
                                                                                                 $152
                                                                                         $137

     – Net debt and net debt to book                     $114                                            $119
                                                                 $107        $111
                                                                                                 25%
       capitalization declining               $72
                                                                                         23%
                                                                                                         20%     $69
                                                                             19%
                                                         17%     17%

   $250 million credit facility              11%                                                                12%

     – Matures August 2022                   Q1/19       Q2/19   Q3/19      Q4/19        Q1/20   Q2/20   Q3/20   Q4/20

                                          Available Liquidity
     – Available liquidity of $178        ($ millions)
       million at the end of Q4/20
                                               $176                      Strike Period
                                                                                                                  $178

   Additional liquidity available                        $134
                                                                  $141        $137
                                                                                                          $128
                                                                                          $114
    from asset sales                                                                              $95

                                              Q1/19      Q2/19   Q3/19       Q4/19       Q1/20   Q2/20   Q3/20   Q4/20

     Significant Financial Flexibility Available To Pursue Strategic Initiatives                                         26
Capital Allocation: Reinstatement Of A Quarterly
      Dividend And Maintaining Financial Flexibility

             Announced reinstatement of a quarterly dividend of $0.01 per share in
              February 2021
                 – Implied annual dividend of $0.04 per share; implied yield of 2.4%(1)

             Maintain financial flexibility for strategic capex and growth opportunities
                 – Projects and jurisdictions that create the opportunity to grow long-term
                   shareholder value

                 – Need to achieve desired internal return hurdles

             May complement the dividend with share repurchases to return additional
              capital to shareholders
                 – Renewed our NCIB in August 2020, allowing for repurchase of up to 18.8 million
                   shares

             Approximately $30 to $40 million per year in annual maintenance of
              business and road capex
(1) Based on closing share price of $1.67 on February 25, 2021

                       Remain Committed To A Balanced Approach To Capital Allocation                27
Strengthen the Foundation: Strategic Partnerships
      With Huu-ay-aht First Nations In TFL 44

             Sale of Western’s ownership interest in TFL 44 LP to HVLP(1) to occur in phases
                 –      TFL 44 LP consists of certain Western assets and liabilities in its Port Alberni Forest
                        Operation, including Tree Farm Licence (“TFL”) 44

                 –      Long-term log agreement to continue to supply Western’s coastal manufacturing operations

                 –      Western may sell to other area First Nations up to a further 26% ownership interest in TFL
                        44 LP at the end of Phase 3

                 –      Closing of each phase is subject to various customary closing conditions

                                                      Phase 1                                Phase 2                        Phase 3         Westcoast of Vancouver Island
                                                     (completed)                              (pending)                      (pending)

                                                                                                                                                  TFL 44
       Purchase Price                            $7.3 million                           $22.4 million                     $12.8 million                               Port Alberni

    HVLP(1) Incremental
                                                      + 7%                                   + 28%                           + 16%                                           Alberni Pacific
    Ownership Interest                                                                                                                                       TFL 44         Division Sawmill

                                                            93%                                      65%                            49%
  TFL 44 LP Ownership
   Interest At Closing                           HVLP(1) : 7%                           HVLP(1) : 35%                     HVLP(1) : 51%
                                                                                                                                              Ucluelet
                                                                                                                                                                          TFL 44
                                                                                                                                                  Bamfield
                                                                                          Anticipated                      Anticipated
          Closing Date                           March 2019
                                                                                           in Q2/21                         in Q1/23
                                                                                                                                          TFL 44 LP Allowable Annual Cut: 782,482 m3

(1) Huumiis Ventures Limited Partnership (“HVLP”), a limited partnership beneficially owned by Huu-ay-aht First Nations

                Building Mutually Beneficial Relationships In Support Of Reconciliation                                                                                                        28
Growing The Business:
 Sales and Marketing Initiatives and Growth

          Wholesale Lumber Growth                          Strategic Marketing Initiatives

 Form strategic agreements with global             Increase our access to North American Home
  suppliers to offer an expanded product line        Centre and Pro-Dealer sales channels
  that delivers greater value to our customers
                                                      – Estimate that 40% of cedar is consumed in the
                                                        Home Centre segment
 New products will originate in the U.S., Asia,
  Europe and Canada                                 Greater access to the growing repair and
                                                     remodelling lumber segment
 Leverage our Arlington centralized
  warehousing and distribution centre to            Working with our customers and investing in
  effectively service our selected U.S.              marketing to drive demand
  customers
                                                    Courses targeted at educating architects on
 Japanese                                           utilizing our sustainable products
  Cedar
  fencing                                           New product branding
  opportunity
  launched
  in Q3/20

                             Opportunities To Grow Our Business                                         29
Growing the Business:
New Cedar Branding Initiatives To Drive Growth

                   An exclusive Home Centre
                    brand covering all products

                   Targeting end-users and
                    contractors

                   Appearance grade
                    residential products (decking,
                    siding, outdoor living)

                   Targeting end-users through
                    the distribution and pro-
                    dealer channels

                   4x6 and larger products
                    marketed to residential and
                    industrial markets

                   Targeting industrial and
                    distribution customers

  Growth Opportunity For Targeted Specialty Products For Our Customers   30
Growing The Business: Strategic Acquisitions To
     Geographically Diversify and Grow the Business

                                                      Arlington Distribution and Processing Centre (2018 / 20191)
                                                      Arlington, Washington
                                                       Overview                                     Strategic Rationale
                                                        18-acre distribution                        Centralized warehousing
                                                         and processing facility                      and distribution near the
                                                        170,000 square feet                          high value U.S. west
                                                         covered storage                              coast corridor
                                                        Rail spur on site                           Increase production of
                                                         serviced by BNSF                             targeted specialty
        Western Forest                                                                                products and expanded
           Products                                     Remanufacturing
                                                                                                      finishing capacity
        B.C. Operations                                  (Kilns, Planer)

                                                      Columbia Vista (2019)
                                                      Vancouver, Washington

                                                        Overview                                    Strategic Rationale
                                                         Sawmill                                    Increases production of
                                                         Remanufacturing                             Douglas fir specialty
                                                          (Kilns, Planer)                             products for Japanese
                                                                                                      and U.S. markets
                                                                                                     Complements our B.C.
                                                                                                      hemlock business into
                                                                                                      Japan
(1) Acquired in 2018; site improvements completed in Q2/18; equipment upgrades completed in Q1/19

                                   Growing Our Operations In The U.S. Pacific Northwest                                           31
Company Overview
Sustainable Product Lifecycle, From Forest To Customer
Margin Strategy / Fibre and Processing Flow Chart
      Standing Timber                                          Log Availability        Margin Decision         Market Segments

                                                                                                                   Log Markets

                                                                                                                    Domestic Log
                                                                                                                      Markets

                                                                                          External Log               Export Log
                                                                      Allowable              Sales                    Markets
                                                                     Annual Cut(2)
       Diverse and Unique Species Mix

                                         Hemlock /                 (AAC) For Logs                                     Pulp Log
                                          Balsam                                        ~34% of Logs Sold             Markets
                                                                    ~6.0 million m3
                                                                                          (by volume)(1)

                                                                                                                Lumber Segments

                                        Western Red                                                                 Western Red
                                          Cedar                          Log                                          Cedar
                                                                     Purchases(1)
                                        Douglas Fir                (~1.0 million m3)                               Japan Specialty
                                                                                          Internal Log
                                                                                         Consumption
                                          Yellow
                                          Cedar                                                                        Niche

                                                                                          ~66% of Logs
                                          Spruce                                                                     Commodity
                                                                                        Processed at WFP
                                                                                       sawmills and custom
                                                                                           cut division(1)
                                                      Raw Inputs
                                                                                                                    Finished
(1) Annual average from 2015 to 2020, including strike impacted 2019 and 2020                                    Products / Sales
(2) As of December 31, 2020

                                                   Timber Resource Is Directed To Highest Margin Opportunity                         33
Log Markets Determine Margin Decision

                                                                                                                                         Primary Target                                 Logs by Value
                                  Log End Market                                            Description
                                                                                                                                          Geographies                                Historical Average(1)
                                                                                                                                                                                                                         29%
                                                                         Western’s sawlogs consumed by                                                                                                                External
                                                                          internal manufacturing operations                                                                                                              Log
                                         WFP                                                                                                                                                             19%            Sales
                                                                         Internal log supply supplemented by
                                       Sawmills                           open market purchases to maximize
                                                                                                                                                                                                                3%
                                                                          margin
                                                                                                                                                                                    71%
                                                                                                                                                                                               $623              7%
                                                                                                                                                                                              million(2)
                                                                         Includes sawlogs, peelers (for
                                                                          engineered wood applications) and
                                       Domestic                           shingle logs sold through contractual
                                                                          commitments and open market
                                                                          transactions
External Log Sales

                                                                                                                                                                                       Logs by Volume
                                                                         Volumes committed under long-term                                                                           Historical Average(1)
                                                                          fibre supply agreements                                                                                                                        34%
                                      Pulp Logs                                                                                                                                                                        External
                                                                         Commitments met through internal log
                                                                                                                                                                                                                         Log
                                                                          supply, supply contracts and open
                                                                                                                                                                                                          19%           Sales
                                                                          market pulp log purchases

                                                                         Represents log sorts produced in                                                                          66%
                                                                                                                                                                                                  5.2             8%
                                                                          excess of internal mill requirements                                                                                million   m3
                                                                                                                                                                                                                 7%
                                         Export                          Historically commanded premium
                                                                          prices due to strong demand
                                                                         Transportation optimization

                      (1) Annual average from 2015 to 2020; based on total external log sales and internal log consumption, including purchased logs. Internal transfer values based on Vancouver Log Market prices
                      (2) Net of freight and fee in lieu

                                            Directing Log Volume To The Highest Margin Opportunity                                                                                                                        34
Manufacturing and Sales

                 Log                  Marketing             Manufacturing                Sales
                Supply                Strategy                Strategy                  Strategy

                     Log diameter and margin determines lumber products manufactured

 Log Cutting
  Patterns

Log Dimension             5 – 11”        11 - 18”        16 - 22”       20 - 30”                   24”+

   Product                Narrow          Wide                                                 Grade &
                                                         Squares        Timbers
                         Dimension      Dimension                                             Appearance
    Group

   Lumber                              Commodity /                       Niche /               Niche /
 Product Type            Commodity                        Japan
                                     Western Red Cedar              Western Red Cedar     Western Red Cedar

 Flexible Manufacturing Platform Presents Unique Opportunity To Create Margin                                 35
Diversified Lumber Product Offering

                                                                               Primary Target     Lumber by Value
                           Lumber Products             Description                                Historical Average(1)
                                                                                Geographies

                                              Consumer-orientated products
                              Western                                                               22%
                                              Premier softwood for external
                                Red
                                               applications
                               Cedar                                            Global                    $805       46%
                                              Naturally durable
Specialty Products

                                                                                                  12%     million

                                              Specialized products for                                 20%
                               Japan           specific end uses
                              Specialty                                                                               78%
                                              Requires unique and rigorous
                                                                                                                    Specialty
                                               quality standards
                                                                                                  Lumber by Volume
                                                                                                  Historical Average(1)
                                              Specialty products and
                                               markets
                                Niche
                                              Focused on appearance
                                                                                Asia     Europe
                                               grades, value-add products                                           27%

                                                                                                  45%     778
                                                                                                          MMfbm
                                              Traditional dimension lumber                                         17%
                             Commodity
                                               and developing grades
                                                                                                            11%

                                                                                                                       55%
                                                                                                                     Specialty
(1) Annual average from 2015 to 2020

                     Allows Western To Profitably Service Multiple Markets Throughout The Cycle                                 36
Specialty Product Focus

             Approximately 78% of                                        WFP Average Lumber Price vs. Commodity Lumber Price
                                                                          (C$ per mfbm)
              lumber revenue is                                           $1,800
                                                                                                                                                              Strike Impacted
              generated from non-                                         $1,400
              commodity products
                                                                          $1,000

             Significant price                                             $600

              premium to commodity                                          $200
                                                                                     Q1 Q2 Q3 Q4 Q1 Q2 Q3 Q4 Q1 Q2 Q3 Q4 Q1 Q2 Q3 Q4 Q1 Q2 Q3 Q4 Q1 Q2 Q3 Q4
              lumber
                                                                                           2015                2016            2017           2018           2019                2020
                                                                                                                                                                     (1)
                                                                                                         WFP Average Lumber Price           Commodity Lumber Price
             More stable margins
              through the cycle vs.                                       Quarterly Lumber EBITDA Margin Comparison
              commodity peers                                               45%

                                                                            30%                                                                                Strike Impacted

             Product / market                                              15%
              diversity and global                                            0%
              exposure provide                                             -15%
              opportunities to                                             -30%
                                                                                     Q1 Q2 Q3 Q4 Q1 Q2 Q3 Q4 Q1 Q2 Q3 Q4 Q1 Q2 Q3 Q4 Q1 Q2 Q3 Q4 Q1 Q2 Q3 Q4
              maximize margin
                                                                                           2015                2016            2017          2018            2019                2020
                                                                                                                                   (2)
                                                                                                                Peer Group Range         Western Forest Products
(1) KD Western SPF 2x4, #2&Btr; converted from US$ to C$
(2) High and low EBITDA margin range of West Fraser, Canfor and Conifex lumber segments and consolidated results of Interfor

        Specialty Products Focus Creates Greater Earnings Stability Over The Long-term                                                                                                  37
Seasonality Of The Business

             Weather (snow pack, heat)                                        Harvest Volume(1)                                 Closing Log Inventory(1)
                                                                               (000 m3)                                          (000 m3)
              and daylight can impact
                                                                                              1,273
              harvest volumes and costs
                                                                                 1,072                                1,075                     1,068
                                                                                                          1,039
             Inventory levels can                                                                                                  964                  980
                                                                                                                                                                949

              fluctuate through the year,
              impacting working capital
                                                                                  Q1           Q2         Q3          Q4            Q1          Q2       Q3     Q4
             Seasonal market demand
              can impact lumber                                                Lumber Production &                               Increase (Decrease) in
              production                                                       Shipments(1)                                      Working Capital(1)
                                                                               (MMfbm)                                           ($ millions)
                                                                                             222 220
                                                                                                                                                $21
             Typically higher lumber                                           209
                                                                                      213                213
                                                                                                               215         216

                                                                                                                     207
              sales volumes in Q2 and
              Q3 when North American                                                                                                                            $3

              construction activity is at                                                                                          ($2)
              its peak                                                            Q1           Q2          Q3          Q4                               ($10)
                                                                                            Production    Shipments                 Q1          Q2       Q3     Q4
(1) Average of 2015 to 2020 excluding strike impacted Q3/19, Q4/19 and Q1/20

                   Seasonal Influences Impact Operations, Sales And Working Capital                                                                                   38
Strategic Capital Investments

   Initiatives focused on:

     – Reducing costs

     – Increasing efficiency
                               Duke Point Sawmill                  Duke Point Planer            Duke Point Planer: Auto grading

     – Increasing
       production of
       targeted products

     – Growing volumes

   Applying proven            Chemainus: Timber grading station                       Chemainus: Timber deck

    technology in coastal
    operations

                               Saltair Sawmill                     Saltair Sawmill             Centralized, automated saw filing

      Capital Projects Expected To Generate A Return In Excess Of 20%                                                              39
Appendix
Supplemental Materials
Repair and Remodelling Statistics
 U.S. Repair & Remodelling Expenditures                                                                                  Remodelling Market Index
 (US$ billions)
                                                                                    Forecast CAGR: 1.9%
                                                                                                                                                                                                                                                                                                                            Above 50
                                                                                                     $163   $167
                                                   $158                             $160    $159                                                                                                                                                                                                                         means majority
                                                                             $155                                   70
                                                           $147                                                                                                                                                                                                                                                             of survey
                                           $138                       $137                                                                                                                                                                                                                                               participants are
                                    $130
$122                         $122                                                                                                                                                                                                                                                                                        reporting better
        $115         $116
                                                                                                                                                                                                                                                                                                                           activity than
                                                                                                                                                                                                                                                                                                                           prior quarter
                                                                                                                    50

                                                                                                                    30
                                                                                                                                  '11                '12                '13                '14               '15                '16    '17                '18                 '19                '20

 '11     '12         '13      '14    '15   '16     '17         '18     '19   '20    '21E    '22E     '23E    '24E
                                                                                                                     Source: National Association of Homebuilders; Future Market Indicators; based on a quarterly
                                                                                                                     survey of NAHB remodeler members that provides insight on current market conditions as well as
Source: Forest Economic Advisors (February 2021)                                                                     future indicators for the remodeling market

  Leading Indicator of Remodelling Activity                                                                              Home Centres – Same Store Sales Growth
  (US$ billions)
                                                                                                                                                                                                                                                        42%

                                                                                                            $352                                                                                                                                                                                                                 36%
                                                                                               $339
                                                                             $324    $327                                                                                                                                                                                       32%
                                                                                                                                                                                                                                                                                   30%
                                                                                                                                            27%27%                                29%                                 28%                                                 28%29%                                        28%
                                                                     $290                                                                                                                                                                                        24%
                                            $278      $278                                                                                                        23%                      23%24%22%                                                                                                           24%
                                    $265                                                                                                                       21%                                                                             20%
                            $250
 $232      $235

                                                                                                                                                                                                                                      9%
                                                                                                                         8% 6%

                                                                                                                                                                                                                                                                                                               Nov-20
                                                                                                                                                                                                                                                                                                                        Dec-20
                                                                                                                                                                                                                                               Apr-20

                                                                                                                                                                                                                                                                                    Aug-20
                                                                                                                                                                                                                                                                                             Sep-20
                                                                                                                                                                                                                                                                                                      Oct-20
                                                                                                                                                                                                                                      Mar-20

                                                                                                                                                                                                                                                                           Jul-20
                                                                                                                                                                                                                                                        May-20
                                                                                                                                                                                                                                                                 Jun-20

                                                                                                                                                                                                                                                                                                                                  Jan-21
                                                                                                                                                                                                    Nov-20
                                                                                                                                                                                                             Dec-20
                                                                                                                                   Apr-20

                                                                                                                                                                         Aug-20
                                                                                                                                                                                  Sep-20
                                                                                                                                                                                           Oct-20
                                                                                                                         Mar-20

                                                                                                                                                               Jul-20
                                                                                                                                            May-20
                                                                                                                                                      Jun-20

                                                                                                                                                                                                                       Jan-21
  '11          '12          '13     '14      '15         '16         '17      '18     '19          '20      '21E

Source: Joint Center For Housing Studies of Harvard University; Home Improvement and Repair                                                      Home Depot                                                                                                               Lowes
Activity – trailing 12 months; the Leading Indicator of Remodelling Activity (LIRA) provides a short-
term outlook of U.S. national home improvement and repair spending to owner-occupied homes                           Source: Company reports; trailing 12 months, monthly values
                                                                                                                                                                                                                                                                                                                                           41
Western Red Cedar – Illustrative Price Trends
 WRC High Value Clears                                                                       WRC Timbers
 (C$ per mfbm)                                                                               (US$ per mfbm)

 $6,000                                                                                       $3,000

 $5,000                                                                                       $2,500

 $4,000                                                                                       $2,000

 $3,000                                                                                       $1,500

 $2,000                                                                                       $1,000
          '11     '12    '13     '14     '15     '16     '17     '18     '19    '20   '21              '11    '12     '13     '14     '15     '16     '17    '18    '19    '20       '21

Source: Random Lengths: Green WRC #2 Clear & Btr 4x6W RL, c.i.f. dest. N Euro               Source: Random Lengths: Green WRC #2 & Btr AG 6x6 RL, net f.o.b. Mill

  WRC Decking                                                                                WRC Boards and Trim
  (US$ per mfbm)                                                                             (US$ per mfbm)

$1,900                                                                                        $1,700

                                                                                              $1,500
$1,700
                                                                                              $1,300
$1,500
                                                                                              $1,100
$1,300
                                                                                                $900
$1,100                                                                                          $700

   $900                                                                                         $500
          '11    '12     '13    '14     '15     '16     '17     '18     '19     '20   '21              '11    '12     '13     '14     '15    '16     '17     '18    '19   '20        '21

Source: Random Lengths: Green WRC Deck Knotty 2x6 RL S4S, net f.o.b. Mill                   Source: Random Lengths: Coast Green WRC Std&Btr NH 3/4x4 RL S1S2E H&M, net f.o.b. Mill

                                                                                                                                                                                           42
North America Statistics
      North American Housing Starts                                                                           North American Commodity Lumber Prices
      (million)                                                                                               (US$ per mfbm)                                                                            Forecast
                                                                               Forecast CAGR: 3.7%
                                                                                                               $1,200
              U.S.
2.0                                                                                                 1.9
              Canada                                                           1.7    1.8    1.8               $1,000
                                                                        1.6                         0.2
                                                                               0.2    0.2    0.2
                                                          1.5     1.5
1.5                                          1.4   1.4                  0.2                                      $800
                                       1.3                        0.2
                                 1.2               0.2    0.2
                           1.1               0.2
                                       0.2                                                                       $600
                 1.0             0.2
1.0                        0.2
        0.8      0.2                                                                                             $400
                                                                                             1.6    1.7
                                                                               1.5    1.6
        0.2                                                             1.4
                                             1.2   1.2    1.2     1.3
0.5                              1.0   1.1                                                                       $200
                           0.9
                 0.8                                                                                                    '11   '12    '13     '14     '15    '16         '17   '18   '19    '20     '21     '22
        0.6
                                                                                                                                                                  (1)                       (2)
                                                                                                                                             Coast Hem-Fir                    Western SPF
0.0
        '11      '12       '13   '14   '15   '16   '17    '18     '19   '20    '21E   '22E   '23E   '24E    Source: Random Lengths; Forest Economic Advisors
                                                                                                            (1) Coast KD Hem-Fir #2 & Btr 2x4, net f.o.b. nill
      Source: Forest Economic Advisors (February 2021)                                                      (2) KD W S-P-F #2&Btr 2x4 random mill prices

      North American Lumber Demand                                                                            North American Niche Lumber Prices
      (billion board feet)                                                                                    (US$ per mfbm)
                                                                                Forecast CAGR: 3.3%
 80
                                                                                                     72        $1,600
                                                                                              69
 70                                                                             66     67
                                                    63     63      62    63
                                              60
 60                              56
                                        58                                                                     $1,400
                           55
         49          51
 50                                                                                                            $1,200
 40
                                                                                                               $1,000
 30
                                                                                                                 $800
 20

 10
                                                                                                                 $600
                                                                                                                        '11    '12     '13         '14     '15          '16   '17    '18     '19         '20     '21
  0                                                                                                                                                                 (1)                           (2)
         '11         '12   '13   '14   '15   '16    '17    '18    '19    '20   '21E   '22E   '23E    '24E                               Douglas Fir Timbers                     White Fir Shop
        Residential Improvements        Industrial & Commercial    New Home Construction       Exports      Source: Random Lengths
                                                                                                            (1) Green Douglas Fir (Portland) #1&Btr 100% FOHC 6x6 Rough
      Source: Forest Economic Advisors (February 2021)                                                      (2) KD White Fir Shop Moulding&Btr C&Btr 5/4 S2S
                                                                                                                                                                                                                       43
Japan Statistics
   Japan Housing Starts                                                                                       Douglas Fir Lumber Prices to Japan
   (000s)                                                                                                     (US$ per mfbm)

                                                                                                              $1,300
                        980                     967     965
                                         909                        942
             883                  892                                           905
    834                                                                                 815    830    840     $1,200

                                                                                                              $1,100

                                                                                                              $1,000

                                                                                                               $900

                                                                                                               $800

                                                                                                               $700
    '11         '12     '13       '14    '15    '16     '17         '18         '19     '20    '21E   '22E             '11   '12     '13     '14     '15     '16    '17     '18     '19     '20     '21

   Source: Japan Ministry of Land, Infrastructure, Transport and Tourism; Bloomberg                          Source: Random Lengths: Green Douglas Fir Baby Squares Merch 4-1/8x4-1/8 RL S4S, c.&f. dest. Japan

 North America Lumber Imports                                                                                Hemlock Lumber Prices to Japan
 (000     m3)                                                                                                (US$ per mfbm)

1,200
                      1,025
                                                                                                             $1,200
          1,019                  1,020
1,000
                                                                                                             $1,100
                                         802     765
 800                                                      703             668                                $1,000
                                                                                      611
 600                                                                                          527
                                                                                                      428      $900
 400
                                                                                                               $800
 200
                                                                                                               $700
   0
           '11         '12        '13     '14     '15         '16         '17         '18     '19     '20      $600
                                                                                                                       '11   '12     '13    '14     '15     '16     '17     '18     '19    '20     '21
                             Canada Hemlock     Canada Douglas Fir              U.S. Douglas Fir

Source: Japan Lumber Importers’ Association                                                                  Source: Random Lengths: Green Hem Baby Squares Merch 4-1/8x4-1/8 13' S4S, c.&f. dest. Japan

                                                                                                                                                                                                           44
China Log and Lumber Statistics
 China Lumber Imports                                                                   China Commodity Lumber Price
 (million m3)                                                                           (US$ per mfbm)

                                                            37              37            $600
 40                                                                 37
                                                                                  34
                                                     31                                   $550
 30                                  26     27
                          24                                                              $500
         22       21
 20                                                                                       $450

                                                                                          $400
 10
                                                                                          $350
  0
                                                                                          $300
         '11     '12      '13       '14     '15      '16    '17     '18     '19   '20
                                                                                                 '16             '17             '18              '19             '20             '21
                 Russia         North America      New Zealand    Others
                                                                                        Source: Forest Economic Advisors – China Bulletin; Hemlock Lumber 2x4 (40x90) Metric RG Utility,
Source: Forest Economic Advisors (February 2021)                                                c.i.f. destination Shanghai

China Log Imports                                                                       China Export Log Price From North America
(million   m3)                                                                          (US$ per m3)

 70
                                                                    60      60    59     $180
 60                                                         55
                                    51
                                                     49
 50                       45                45                                           $160
         42
                 38
 40
 30                                                                                      $140

 20
                                                                                         $120
 10
  0
        '11      '12      '13       '14     '15      '16    '17     '18     '19   '20    $100
                                                                                                 '16            '17              '18             '19             '20              '21
                    Russia       North America      New Zealand    Others
                                                                                        Source: Forest Economic Advisors – China Bulletin; Hemlock,
Western Forest Products:
       Historical Financial Snapshot – Annual
      Revenue ($ millions)                                                                                     Adjusted EBITDA ($ millions)

                                                                                     Strike                                                                                                    Strike
                                                     $1,187 $1,143 $1,197          Impacted    (1)
                                                                                                                                                               $148      $153                Impacted   (1)
                                                                                                                                                                                  $144
                                   $1,037 $1,082                                                                                    $129
                                                                                                                                                      $117
                          $978                                                             $965                                                                                                     $117
                 $925                                                                                                                        $109
        $854                                                                     $808
                                                                                                                                                                                                               (2)
                                                                                                                                                                                                     $32
                                                                                                                  $62
                                                                                                                           $51
                                                                                                                                                                                                     $85

                                                                                                                                                                                            ($2)

         '11       '12      '13      '14      '15      '16      '17       '18      '19      '20                   '11       '12      '13      '14      '15       '16      '17      '18      '19      '20

    Lumber Shipments (MMfbm)                                                                                   Adjusted EBITDA Margin %
                                                                                                                                                                                               Strike
                                                                                                                                                                                             Impacted   (1)

                            895      909               935
                   894                        883                         880                                                     13.2%                                13.3%
          811                                                    840                  Strike                                                                  12.5%             12.0%              12.1%
                                                                                    Impacted   (1)
                                                                                                                                            10.5% 10.8%                                                       (2)
                                                                                                                                                                                                    3.3%
                                                                                   548      585
                                                                                                                 7.2%
                                                                                                                          5.5%
                                                                                                                                                                                                    8.8%

                                                                                                                                                                                          -0.2%
          '11      '12       '13      '14      '15      '16      '17      '18      '19        '20                 '11      '12       '13      '14      '15      '16      '17      '18       '19      '20

(1) All of Western’s timberlands and most of our B.C. based manufacturing divisions were impacted by a strike by the United Steelworkers Local 1-1937 (“USW”), which commenced on July 1, 2019. On February
    15, 2020, the USW members ratified a new 5-year collective agreement, which is effective as of June 15, 2019 and expires on June 14, 2024, ending the strike
(2) Impact of non-cash duty recovery related to the finalization of softwood duty rates for 2017 and 2018                                                                                                            46
Western Forest Products:
       Historical Financial Snapshot – Last 8 Quarters

      Revenue ($ millions)                                                                                     Adjusted EBITDA ($ millions)
                                                                                                                                                                                                    $71
                     $310                                                                 $319
                                                                              $291                                                                                                                        (2)
          $276                                                                                                                                                                                      $32
                                                                     $256
                                       Strike Impacted   (1)
                                                                                                                                                                                         $34
                                                                                                                                                                                $30
                                                                                                                    $18        $15
                                 $142                                                                                                           Strike Impacted   (1)                               $40
                                                               $99
                                             $80

                                                                                                                                          ($17)      ($18)             ($17)
         Q1/19       Q2/19      Q3/19       Q4/19         Q1/20      Q2/20    Q3/20      Q4/20                    Q1/19       Q2/19      Q3/19       Q4/19             Q1/20   Q2/20   Q3/20       Q4/20

    Lumber Shipments (MMfbm)                                                                                   Adjusted EBITDA Margin %
                                                                                                                                                                                                  22.3%
                                                                                                                                                                                                         (2)
                      211                                                                  204                                                                                 11.5%   11.6%      9.9%
           203
                                                                                                                  6.6%        4.9%             Strike Impacted   (1)
                                                                               165                                                                                                                12.4%
                                       Strike Impacted   (1)          152

                                  90
                                                               64
                                              44                                                                                        -11.7%
                                                                                                                                                                 -17.6%
                                                                                                                                                   -22.6%
          Q1/19      Q2/19      Q3/19       Q4/19         Q1/20      Q2/20    Q3/20      Q4/20                   Q1/19       Q2/19      Q3/19       Q4/19         Q1/20        Q2/20   Q3/20      Q4/20

(1) All of Western’s timberlands and most of our B.C. based manufacturing divisions were impacted by a strike by the United Steelworkers Local 1-1937 (“USW”), which commenced on July 1, 2019. On February
    15, 2020, the USW members ratified a new 5-year collective agreement, which is effective as of June 15, 2019 and expires on June 14, 2024, ending the strike
(2) Impact of non-cash duty recovery related to the finalization of softwood duty rates for 2017 and 2018                                                                                                       47
Western Forest Products:
       Historical Cash Flow, Capital Allocation and Debt

      Cash Flow from Operations1 ($ millions)                                                                  Capex2 ($ millions)

                                                               $134
                                                      $128
                                                                         $118         Strike
                           $111                                                                (3)
                                                                                    Impacted
                                              $99
                                     $87                                                                                                                                           $84
                                                                                            $80
                                                                                                                                     $59               $62
                   $58                                                                                                                                           $56      $55
                                                                                                                                              $50
         $44                                                                                                                                                                                $37
                                                                                                                            $32
                                                                                                                   $19                                                                               $19
                                                                                  $11

          '11      '12      '13      '14      '15       '16      '17      '18      '19      '20                    '11        '12     '13      '14      '15      '16      '17       '18      '19      '20

    Net Debt / (Cash) ($ millions)                                                                             Dividends4 & Share Repurchases ($ millions)
                                                                                   $111
                                                                                                                                     $116
                             $83      $78
                                                                                            $69
          $52                                  $54
                                                                                                                Substantial                                                         $60
                                                                                                                                     $100                                                    $50
                                                                                                                Issuer Bid
                   $15                                  $15                                                                                                                         $25
                                                                                                                                               $31       $32      $32      $34               $16

                                                                                                                                               $31       $32      $32      $32      $34      $34       $8
                                                                          ($2)                                      n/a       n/a     $16
                                                                                                                     --        --
                                                                ($35)                                               '11       '12      '13      '14      '15      '16      '17       '18      '19      '20

           '11      '12      '13      '14      '15      '16       '17      '18      '19        '20                                           Dividends         Share Repurchases

(1) After changes in non-cash working capital
(2) Additions to property, plant and equipment; excludes acquisition capex
(3) All of Western’s timberlands and most of our B.C. based manufacturing divisions were impacted by a strike by the United Steelworkers Local 1-1937 (“USW”), which commenced on July 1, 2019. On February 15,
    2020, the USW members ratified a new 5-year collective agreement, which is effective as of June 15, 2019 and expires on June 14, 2024, ending the strike                                                      48
(4) The dividend was suspended in May 2020; on February 18, 2021, the company announced the reinstatement of a $0.01 per share quarterly dividend in February 2021
Western Forest Products:
                   Historical Share Price Performance and Price to Book

                   Historical Share Price Relative to EBITDA
                   ($ per share | $ millions)
                    $3.00
                                                                                                     $148            $153                            Strike Impacted   (1)
                                                                                                                                     $144
                    $2.50                                 $129
                                                                                      $117                                                                             $117
                                                                        $109
   ($ per share)

                    $2.00                                                                                                                                                      (2)
                                                                                                                                                                        $32
                                                                                                                                                                                        Current Share
                    $1.50       $62
                                             $51                                                                                                                                        Price: $1.67(3)
                    $1.00                                                                                                                                               $85

                    $0.50
                                                                                                                                                     ($2)
                    $0.00
                                ‘11          ‘12           ‘13          ‘14           ‘15             ‘16             ‘17             ‘18             ‘19                ‘20                ‘21

       Price to Book Ratio
                     3.0x

                     2.5x

                     2.0x

                     1.5x
                                                                                                                                                                                             Current: 1.2x(3)
                     1.0x

                     0.5x

                     0.0x
                         2011         2012         2013          2014          2015           2016            2017            2018            2019            2020                   2021         2022

(1) All of Western’s timberlands and most of our B.C. based manufacturing divisions were impacted by a strike by the United Steelworkers Local 1-1937 (“USW”), which commenced on July 1, 2019. On February
    15, 2020, the USW members ratified a new 5-year collective agreement, which is effective as of June 15, 2019 and expires on June 14, 2024, ending the strike
(2) Impact of non-cash duty recovery related to the finalization of softwood duty rates for 2017 and 2018
(3) Based on closing share price of $1.67 on February 25, 2021
                                                                                                                                                                                                                49
Western Forest Products:
       Sawmills and Remanufacturing Facilities
     Sawmills
                                                                                                               Production                                2018 Production Mix(4)
                                                       Log Diameter
     Sawmill                 Location                                                Capacity(1)                                                                            Douglas           Yellow
                                                       Focus                                              2020(2)        2018(4)         WRC(3)          Hemlock
                                                                                                                                                                              Fir             Cedar

     Ladysmith               Ladysmith, BC             Small                              90                 19             67               --            100%                 --                --

     Cowichan Bay            Duncan, BC                Medium                             215                82            177             13%              87%                 --                --

     Saltair                 Ladysmith, BC             Medium                             240               155            214             22%              61%               17%                 --

     Alberni Pacific         Port Alberni, BC          Medium to Large                    175                52            106               --            100%                 --                --

     Duke Point              Nanaimo, BC               Medium to Large                    130                78            127             3%               91%                6%                 --

     Chemainus               Chemainus, BC             Medium to Large                    130                58             99            100%                --                --                --

     Somass(5)               Port Alberni, BC          Medium to Large                    90                  --             --              --               --                --                --

     Columbia Vista          Vancouver, WA             Medium to Large                    80                 59           n/a(6)             --               --              100%                --

     Custom Cut              Multiple                  Varies                             n/a                73             74             27%                --              30%               43%

     Sawmill Total                                                                      1,150               576            864             22%              66%                8%                4%

     Remanufacturing and Distribution
     Canada                                                                                                        United States

       Value Added Division – Chemainus, BC                                                                         Arlington Distribution and Processing Centre – Arlington, WA

       Duke Point Planer – Nanaimo, BC                                                                              Columbia Vista Sawmill, Planer and Kilns – Vancouver, WA

(1) Based on two shifts and 250 operating days, except Chemainus and Duke Point at three shifts
(2) All of Western’s timberlands and most of our B.C. based manufacturing divisions were impacted by a strike by the United Steelworkers Local 1-1937 (“USW”), which commenced on July 1, 2019. On February 15, 2020,
    the USW members ratified a new 5-year collective agreement, which is effective as of June 15, 2019 and expires on June 14, 2024, ending the strike
(3) Western red cedar
(4) 2018 data shown due to the strike impacting 2019 and 2020; data for 2019 and 2020 is available in our 2019 and 2020 Annual Information Forms
(5) Somass was indefinitely curtailed in July 2017 due to a lack of log supply to operate the mill efficiently
(6) Acquired February 1, 2019

                                                                                                                                                                                                                  50
Analyst Coverage

Analyst & Firm      Contact Information

Hamir Patel            604-331-3047
CIBC                   hamir.patel@cibc.com

Daryl Swetlishoff      604-659-8246
Raymond James          daryl.swetlishoff@raymondjames.ca

Paul Quinn             604 257-7048
RBC                    paul.c.quinn@rbccm.com

Benoit Laprade         514-287-3627
Scotiabank             benoit.laprade@scotiabank.com

Sean Steuart           416-308-3399
TD                     sean.steuart@tdsecurities.com

                                                           51
Investor Relations Contacts

                              Stephen Williams
                              Executive Vice President & Chief Financial Officer
                                 604-648-4572
                                 swilliams@westernforest.com

                              Glen Nontell
                              VP, Corporate Development
                                 604-648-4630
                                 gnontell@westernforest.com

                          These materials have been prepared by Management of the Company. No regulatory authority has
                          approved or disapproved of the contents of these materials. These materials do not constitute an
                          offer to sell or the solicitation of an offer to buy any securities of the Company and shall not
                          constitute an offer, solicitation or sale of the Company’s securities in any jurisdiction in which such
                          offer, solicitation or sale would be unlawful. Securities of the Company may not be offered or sold in
                          the United States absent their prior registration or qualification or an applicable exemption from the
                          applicable registration or qualification requirements.

                                                                                                                                    52
You can also read