INDUSTRY OVERVIEW CAR WASH & AUTO DETAILING SERVICES

Page created by Micheal Salazar
 
CONTINUE READING
INDUSTRY OVERVIEW CAR WASH & AUTO DETAILING SERVICES
INDUSTRY OVERVIEW
CAR WASH & AUTO DETAILING SERVICES
INDUSTRY OVERVIEW CAR WASH & AUTO DETAILING SERVICES
EXECUTIVE SUMMARY
 In the previous 5 years prior to 2021, lower prices in oil allowed for consumers to use their vehicles, as
  cheap gas prices leads to greater use of their cars.
 Car Wash and Auto Detail industry saw strong growth leading into 2019, however COVID-19 brought
  with it economic challenges that did not leave these industries unscathed. This pandemic brought with it
  increased unemployment rates and a decrease in consumer spending.
 Despite downward pressure from COVID, the economy has steadily recovered and people have been able
  to begin to return to work. As a result, for the next 5 years after 2021, industry revenue is estimated to
  increase at an annualized rate of 2.0% to 13.1 billion, including 9.4% growth in 2021 alone.
 Before 2020, average industry profit improved as demand for industry services increased. This profit
  growth stemmed from changes in product offerings by industry operators. Companies diversified their
  offerings to build a stronger customer base, implementing value-added services such as interior cleaning,
  waxing and rim shining, in addition to their more basic packages.
 Demand for services provided by the Car Wash and Auto Detailing industry is expected to continue
  rising during the outlook period. Over the five years to 2026, industry revenue is projected to grow an
  annualized 1.7% to $14.2 billion
 Revenue growth will be bolstered by rising per capita disposable income, which will boost consumers’
  propensity to spend on discretionary services, such as car washes. Furthermore, environmental awareness
  of water usage will boost demand for professional car washing because professional services typically use
  less than one third of the water used by residential car washing.

                                                                                                               1
INDUSTRY OVERVIEW CAR WASH & AUTO DETAILING SERVICES
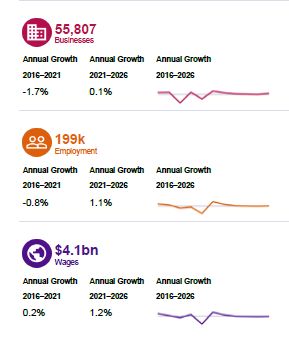
INDUSTRY OVERVIEW AND TRENDS
   Operators’ primary activities in the industry include cleaning, washing, and waxing automotive vehicles. This space does
    not include gas stations with an in-bay car wash or companies that predominately provide automotive repair and
    maintenance services
   Prior to the pandemic, the car wash industry was flourishing. In 2019, the industry accrued $13.23B in revenue
        A positive economic landscape and stable, low fuel prices allowed individuals to drive more frequently, and the
         average industry profit improved with an increase in sales
        Profit was enhanced by operator efficiency in changes in service offerings
   In a competitive industry, companies are now offering additional services to retain their customer base
   While no individual company generates more than 5% of the industry revenue, blue chip companies such as Walmart,
    The Home Depot, and Costco have entered the space
   Key Trends
        COVID-19 has depressed the economy, resulting in layoffs and higher unemployment rates throughout the country.
         A lack of disposable income in households has shrunk the demand for car washes. With a strong economy,
         rebounds are expected, and consumers will return to car washing services
        The Coronavirus Aid, Relief & Economic Security (CARES) Act was signed on March 27, 2020 to alleviate the
         negative impacted of the virus
             The Paycheck Protection Program (PPP) provides forgivable loans to small businesses (< 500 employees)
             Through Economic Injury Disaster Loans (EIDL) the Act allocates $10,000 grants
        Regulation and public opinion will shift operators to more eco-friendly services. This focus will be on water usage
         and cleaning contaminants
        As companies move away from the Work-from-Home orders we should expect an increase in activity for this
         industry

                                                                                                                               2
INDUSTRY OVERVIEW CAR WASH & AUTO DETAILING SERVICES
KEY SUCCESS FACTORS

   Business expertise of operators:
        Since the Car Wash and Auto Detailing industry is generally made up of small, privately owned operators, acquired
         knowledge on how to run day-to-day activities and handle industry issues is a key success factor.
   Proximity to key markets:
        Being located on busy roads is essential. The volume of passing traffic (known as 'traffic count') is a key determinant
         of the success of a car wash business. Being located at major intersection can also be ideal.
   Having a loyal customer base:
         Car wash operators compete based on providing superior value and customer service. Attracting and retaining a
         loyal customer base is crucial to success.
   Access to the latest available and most efficient technology and techniques:
        Car washes with the most up-to-date technology will attract more customers and can charge higher prices.
   Ability to accommodate environmental requirements:
        This industry is subject to environmental restrictions on water usage and effluent and generates demand from the
         effect of environmental regulations on clients. Successful operators promote an environmentally aware image and
         service.

                                                                                                                               3
CAR WASH INDUSTRY TRANSFORMATION
Summary: Car washes that invest in updated their car wash technology will attract the most customers, gain the local market
share, increase retention rates, and are able to dictate pricing for their car wash service.
Advancements in innovation are attracting customers to car wash services
   Recently, operators have utilized websites and mobile apps to enable customers to make appointments for services
         This practice is expected to enhanced the customer experience by significantly reducing the wait times for
          customers.
         Operators are also able to optimize their work volume by estimate services times and bottlenecks throughout the
          day
   On-demand car wash operators are starting to take hold
         Companies will travel to the customers’ desired location to perform cleaning services
         Washé has raised over $3M in funding. The company connects over 1,000 licensed and insured car washing
          professionals to customers
   Regulation and consumer preference has spurred sustainable innovation
         Environmentally conscience consumers prefer eco-friendly soap and detergents and reduced water usage
         Regulation on water usage has increased innovation to moderate consumption
             Low-flow nozzles, timed washes, and equipment maintenance are key contributors to efficiency
   Technological advancement in reducing friction on vehicles has increased the demand of in-bay automatic car washes
         Equipment such as PDQ’s ProTouch system provides an alternative to customers who prefer a softer touch
         The reduced friction will eliminate swaying of the vehicle and additional wear and tear to external paint
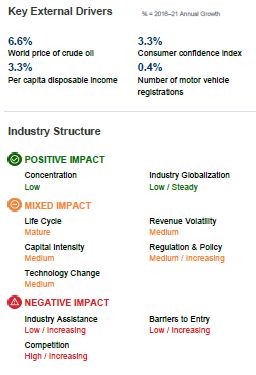
                                                                                                                              4
KEY INDUSTRY DRIVERS
Consumer Disposable Income                                                                                               Number of Motor Vehicle Registrations
 Discretionary services depend on income available after                                                                 The growth of the auto industry positively correlates to
   necessities have been procured. This includes individual                                                                 the car wash industry. With more vehicles on the road, the
   customers and businesses. Increased unemployment rates                                                                   amount of prospective customers increase. The
   for individuals and decreases in revenue for businesses                                                                  aftermarket auto industry depends on used and new car
   have constrained disposable income.                                                                                      dealers.
                           Number of Vehicle Registrations                                                                                           Per capita disposable income
  3%                                                                                                                         6%                                                                      5.69%
  2%                                                                                                                         4%
  1%                                                                                                                         2%
                                                                                                                 1.12%                                                                                                            1.98%
  0%                                                                                                                         0%
 -1%                                                                               -1.11%                                    -2%
 -2%                                                                                                                         -4%
         2012

                  2013

                           2014

                                    2015

                                            2016

                                                    2017

                                                            2018

                                                                    2019

                                                                            2020

                                                                                    2021

                                                                                            2022

                                                                                                   2023

                                                                                                          2024

                                                                                                                 2025

                                                                                                                                    2012

                                                                                                                                            2013

                                                                                                                                                    2014

                                                                                                                                                           2015

                                                                                                                                                                  2016

                                                                                                                                                                         2017

                                                                                                                                                                                2018

                                                                                                                                                                                       2019

                                                                                                                                                                                              2020

                                                                                                                                                                                                     2021

                                                                                                                                                                                                             2022

                                                                                                                                                                                                                    2023

                                                                                                                                                                                                                           2024

                                                                                                                                                                                                                                  2025
Consumer Confidence Index (CCI)                                                                                          Price of Fuel
 The consumer confidence index measures customers’                                                                       Lower gas price encourage gas prices to drive more
   stance toward the economic future. When customers have                                                                     liberally, and higher prices encourage consumers to find
   a positive outlook, the index will increase. The 2020 index                                                                alternative transportation such as public transit. Rising
   is expected to decrease, affecting the car wash industry.                                                                  fuel prices limits disposable income for discretionary
                             Year-over-Year Change in CCI                                                                     services.
  25%
                                                                                                                                                 World Price of Crude Oil
                                                                                                                             30%
  15%
                                                                                                                 5.56%                                                                                                            5.82%
                                                                                                                             10%
   5%
   -5%                                                                                                                       -10%

  -15%                                                                                                                       -30%
                                                                                    -19.20%                                                                                                          -37.99%
  -25%                                                                                                                       -50%
                                                                                                                                     2012

                                                                                                                                             2013

                                                                                                                                                    2014

                                                                                                                                                           2015

                                                                                                                                                                  2016

                                                                                                                                                                         2017

                                                                                                                                                                                2018

                                                                                                                                                                                       2019

                                                                                                                                                                                              2020

                                                                                                                                                                                                      2021

                                                                                                                                                                                                             2022

                                                                                                                                                                                                                    2023

                                                                                                                                                                                                                           2024

                                                                                                                                                                                                                                  2025
           2012

                    2013

                             2014

                                     2015

                                             2016

                                                     2017

                                                             2018

                                                                     2019

                                                                             2020

                                                                                     2021

                                                                                            2022

                                                                                                   2023

                                                                                                          2024

                                                                                                                 2025

                                                                                                                                                                                                               Data Source: IBIS World
                                                                                                                                                                                                                                          5
KEY METRICS

                       Data Source: IBIS World
              (1) % = 2015-2020 Annual Growth 6
Market Outlook & Industry Locations

   Revenue projections over the next 5 years look
    promising as disposable income bounces back and
                                                                                Business Concentration
    unemployment rates fall; however, if businesses
    prolong work-from-home arrangements, growth of
    the industry will increase at a slower rate
   Regulations and environmental policies will come to
    the forefront as popular option trends toward
    sustainable practices
        This will lead to carpooling and public
         transportation practices, limiting potential
         customers
        Studies show that an average household uses
         140 gallows of water to clean a vehicle, while
         professional services use 45 gallons on average.
         This realization will push new customers into
         the industry
   New operating techniques to improve business
    processes and adoption of technology to reduce
    water consumption will increase profit margins
        By 2025, estimated profit could reach 20.9% of
         revenue
   The concentration of car wash establishments depends on climate, population levels, and city landscape
        Climates with little rainfall or areas affected by salt corrasion from oceans will demand constant service
        Densely populated regions generally have sufficient public transit; however, regions where driving is a necessity
         will have an active car wash industry
        Most populated states by industry operators: 1. California 2. Texas 3. Florida 4. New York 5. Illinois
                                                                                                             Data Source: IBIS World
                                                                                                                                       7
Car wash & auto detailing market size in the United States
from 2011 to 2021 (in million U.S. dollars)
                        Market value of car wash & auto detailing in the U.S., 2011-2021
                                      13,000

                                      12,500

                                      12,000
Market size in million U.S. dollars

                                      11,500

                                      11,000

                                      10,500

                                      10,000

                                       9,500

                                       9,000

                                       8,500
                                               2011   2012   2013   2014   2015   2016   2017   2018   2019   2020   2021

                                                                                                                            8
SWOT ANALYSIS

           S                            W                       O                        T

      STRENGTHS                   WEAKNESSES             OPPORTUNITIES               THREATS

   Low consumer                Low Increasing          High Revenue            Low Revenue Growth
    concentration                Barriers to Entry        Growth (2016-2021)       (2005-2021)
   Low Imports                 Low Revenue per         High Performance        Low Outlier Growth
                                 Employee                 Drivers
   High Profit vs. Sector                                                        Per Capita disposable
    Average                     High Capital            Global Oil Prices        income
                                 Requirements
   Low Customer Class
    Concentration
   Low Product / Service
    Concentration

                                                                                                           9
SUPPLY CHAIN
                                                    Indirect Suppliers
                           Soap & Chemical                 Water Supply
                                                                                              Electric Power
                             Compound                      and Irrigation
                                                                                              Transmission
                            Manufacturers                    Systems

                                                      Direct Suppliers
                                                                            Heating and Air
                                              Chemical
                                                                             Conditioning
                                             Wholesalers
                                                                             Wholesalers

                                               Car Wash & Auto Detailing

                                                     Direct Suppliers

           Individual         Rental Car                                                      Delivery Service
                                               Used Car Dealers     New Car Dealers                              Taxi Service
           Customers           Services                                                         Companies

   Indirect suppliers include chemical compound manufacturers and utility suppliers for water and electric
   There are now major players in chemical wholesalers; however, company leaders in chemical manufacturing are P&G and
    Ecolab, having 13.7% and 11.9% of the market share, respectively
   Car wash companies have a diverse consumer base, servicing individual customers, businesses, and government entities
    alike

                                                                                                                    Data Source: IBIS World
                                                                                                                                              10
Consumer & Industry Segmentation

                       Consumer Segmentation                                  Car Wash & Auto Detailing Segmentation
                                                                                       Product and Services Segmentation

                         Businesses                                  28.6 %               11.0%
                                                                                                                             23.7%
      Household earnings over $150K                                  26.1%         6.0%
Household earnings between $70K and
               $150K                                         18.2%

   Household earnings between $40K
                                                         12.8%
                and$70K
                                                                               15.2%
   Household earnings less than $40K                      12.6%

                        Government          1.6%

                                       0%   5%     10% 15% 20% 25% 30% 35%
                                                                                                                                 24.6%
       Households account for 70% of industry revenue
            Higher earnings provides more disposable                                   19.5%
              income for discretionary services such as car
              washes                                                                            Full-Service clean (conveyor car washes)
                  Higher income customers spend more for                                       Exterior clean only (conveyor)
                   premium services and spend more                                              In-bay auto car washes
                   frequently in the car wash industry                                          Detailing Services
       Government vehicles account for 1.6% of total                                           Hand Washing services
        registrations. Hence, revenue generated from                                            Self Service Bay
        federal clients is limited

                                                                                                                          Data Source: IBIS World
                                                                                                                                                    11
PRODUCTS AND SERVICES
   Differentiated products leads to…                                …consumer choice and variable operations

                                                     This product accounts for 49.5% of industry revenue. Three models,
     Conveyor Car washes (Tunnel)                 1 full-service, flex, and express. Labor intensive. Service times between
                                                                 10-15 minutes. Full-service average cost is $15.

                                                    This segment does not count for 40,000 in-bay car washes operated by
      In-Bay Automatic Car Washes                 2 -gas stations. In-bay washes are expected to increase market share due
                                                             to tech innovations and COVID-19. Average cost is $7.

                                                      Vehicles are washed and waxed manually. Service generally performed
           Detailing Services                     3
                                                          by auto dealers. Highly labor intensive. Costs can exceed $50.

                                                        -Equipped with wands, hoses, vacuums, towels, and air fresheners.
            Self-Service Bays                     4
                                                           Coin operated. Little labor requirements. Average cost is $4.

                                                      -Selected if vehicles need extra care. Highly labor intensive. Product has
         Hand-washing Services                    5
                                                        declined in recent years for conventional services. Costs exceed $20.

New Services - Increase competition has led to companies revamping services lines to retain customers
 Companies are starting to sell high margin products including towels, vacuum cleaners, floor mats, and car accessories
 Conveyor car washes have refurbished waiting rooms for clients
 Pet cleaning services are now available alongside traditional car washes

                                                                                                                              12
CAR WASH & DETAILING PLAYERS
In the Car Wash industry, every company generates less than 5% of the total industry revenue. With low barriers to entry and
a fragmented market, the industry has undergone intense competition. M&A activity and consolidation has been active lately
across strategics and private equity firms. The following companies are some of the largest in the space.
     Name                 Headquarter       Estimated # of Locations                           Description
                                                                            Services over 7M cars annually
                                                                            Extends over 21 states and employs over 8,000 individuals
                          Tucson, AZ                   325                  Projected revenue in 202: $584.9M
                                                                            Subscription service allows unlimited car washes per month
                                                                            Acquired by Leonard Green & Partners in 2014

                                                                          Locations over 17 states and employs over 1,400 individuals
                                                       185                Provides 4 membership plans for customers
                        Little Rock, AR
                                                                          Received growth-equity investment from Atlantic Street
                                                                           Capital to expand Zips’ platform through organic growth
                                                                           and acquisition

                                                                            International company that services 35M cars a year
                                                                            Operates over 900 locations across 14 countries
                         Centennial, CO             150 (US)                Third largest car wash company in the US
                                                                            Acquired by Driven Brands in 2020

                                                                          Family-owned company founded in 1969
                                                                          Services over 5M cars annually
                                                                          Operates throughout the southeast and employs 2,400
                         Charlotte, NC                 84                  individuals
                                                                          Projected revenue in 2021: $171.5M
                                                                          During pandemic, the company introduced an interior
                                                                           disinfectant service, utilizing an EPA-registered solution to
                                                                           eliminate viruses and bacteria

                                                                                                                                           13
ACQUISITION FINANCIAL DATA

       Financials             Low      Median     Average                      High
        Revenue             $327,894   $787,945   $710,795                   $977,083
       Gross Profit         291,906     523,724    558,136                    908,566
        EBITDA               40,029      79,703    146,406                    157,026
          EBIT               34,628      58,579    109,266                    115,023

        Margins               Low      Median     Average                      High
   Gross Profit Margin       68.88%    85.41%      80.05%                      92.50%
    EBITDA Margin             5.50%    16.09%      14.48%                      22.08%
      EBIT Margin             5.59%     9.77%      13.00%                      18.27%

        Multiples            Low       Median     Average                      High
 Enterprise Value/Revenue    0.55x      1.03x       1.32x                       1.55x
 Enterprise Value/EBITDA     2.94x      3.27x       5.97x                       9.80x
  Enterprise Value/EBIT      4.29x      7.27x      12.20x                      16.27x

                                                                      Data Source: BV Resources
                                                             Acquisitions data from 2017 to 2020
                                                                                                   14
RECENT PRIVATE TRANSACTIONS
                                                                                   Operating Deal Value    Deal
 Deal Date     Target Business Description    Deal Value   Net Sales    EBITDA
                                                                                     Profit   / EBITDA    Value /
 05/07/2021   Auto Car Wash                    $315,000     $800,653    $137,818   $133,708      2.3x      0.39x
 04/16/2021   Auto Detail Shop                 $200,000     $540,937     $58,904    $32,810      3.4x      0.37x
 11/19/2020   Car Wash Company                 $530,000    $1,607,291    $42,451   $169,710     12.5x      0.33x
 09/29/2020   Self-Service Car Wash             $52,500      $86,745     $58,472    $54,374      0.9x      0.61x
 09/20/2020   Car Wash Company                  $52,500      $86,745     $58,505    $58,505      0.9x      0.61x
 07/31/2020   Car Wash Company                 $175,000     $350,094     $55,374    $41,536      3.2x      0.50x
 07/10/2020   Auto Detailing                   $245,000     $187,367     $25,010    $21,638      9.8x      1.31x
 05/30/2020   Auto Detailing Business           $12,000      $25,760     $20,565    $20,565      0.6x      0.47x
 10/11/2019   Automotive Car Wash              $250,000     $937,990     $76,384    $46,600      3.3x      0.27x
 04/30/2019   Automotive Washing Services      $550,000     $924,389    $174,168    $75,696      3.2x      0.60x
 04/22/2019   Car Wash Company                $1,114,750   $1,064,182    $78,004    $61,750     14.3x      1.05x
 01/18/2018   Mobile Truck Wash               $1,600,000   $1,592,547   $543,839   $534,875      2.9x      1.00x
 01/05/2018   Car Wash Company                 $500,000     $606,086     $19,767   ($23,622)    25.3x      0.83x
 08/18/2017   Car Wash Company                 $240,000     $409,536     $78,707    $64,653      3.1x      0.59x
 06/01/2017   Self-Service Car Wash             $70,000     $157,553     $8,786      $4,802      8.0x      0.44x
 05/31/2017   Car Wash and Detailing          $2,300,000   $1,184,247   $353,405    $55,408      6.5x      1.94x
 03/01/2017   Franchised Detailing Company     $197,500     $456,000    $105,600    $99,300      1.9x      0.43x
 05/20/2016   Express Car Wash                $1,000,000    $667,074    $254,061   $166,306      3.9x      1.50x
 02/08/2016   Self Service Carwash             $575,000     $197,578     $27,201     $9,414     21.1x      2.91x
                                     Median    $250,000     $540,937     $58,904    $55,408     3.27x      0.60x

                                                                                                                15
DAVIDSON CAPITAL ADVISORS PROFESSIONALS

 Robert S. Cashion
 Managing Director, Investment Banking and Advisory Services

 Prior to joining Davidson Capital Advisors, Mr. Cashion spent over 20 years in the
 financial services industry. He manages the firms overall corporate finance and
 consulting practice where he oversees and executes the firm’s investment banking,
 advisory and capital raising engagements.

 Mr. Cashion worked with several financial institutions and consulting firms delivering
 investment banking, leveraged finance, consulting and restructuring services. He
 worked with Bank of America Merrill Lynch and its predecessor firms in the High Grade        980-237-9474 | Direct
                                                                                              robert.cashion@davcapadvisors.com
 Capital Markets, Corporate Finance and the Special Situations group.

 Mr. Cashion has been involved in industry sectors including general industrial,
 distribution, business services, retail, technology and healthcare. Mr. Cashion holds B.A.
 Education, B.S. Accounting, and an MBA from the University of North Carolina. He is a
 Certified Public Accountant and holds FINRA 7, 63 and 79 securities licenses.

                                                                                                                         16
DAVIDSON CAPITAL ADVISORS PROFESSIONALS

 Elizabeth Folger
 Managing Director, Institutional Client Coverage

 Prior to joining Davidson Capital Advisors, Ms. Folger spent 16 years in the financial
 services industry in a variety of functions, most recently with Bank of America Merrill
 Lynch and its predecessor firms. She manages the sales and auction processes for the
 firm’s sell side M&A and capital raising engagements. Her deep experience in the sales
 and trading has resulted in excellent execution for our client’s projects.

 She worked in the Loan Syndication Sales Group, headquartered in Charlotte, with her
 primary responsibilities for sales and distribution of syndicated loans for middle market
 and large corporate credits. Also, Ms. Folger worked on the Corporate Bond Trading
 desk where she managed and traded risk positions of $50-$100 million of intermediate
 term bank and finance paper.                                                                  980-237-9474 | Direct
                                                                                               beth.folger@davcapadvisors.com

 Ms. Folger has been involved in a variety of sectors including general industrial,
 distribution, business services, retail, technology and healthcare. She holds a Bachelor of
 Arts from Hollins University.

                                                                                                                          17
DAVIDSON CAPITAL ADVISORS ANALYST TEAM
Maxwell Purdy
Corporate Finance Coverage

Prior to joining Davidson Capital Advisors in 2021, Mr. Purdy interned with Graycliff Partners, a private equity
located in New York, NY. He graduated from University of North Carolina Chapel Hill in 2021 with a BS in
Political Science and a minor in Economics and Entrepreneurship.

Maxwell assists in leading the firm’s corporate finance client coverage as well as private equity coverage.

Jake Hall
Analyst, Investment Banking

Prior to joining Davidson Capital Advisors, Mr. Hall interned with Churchill Terry, a private equity firm located in
Dallas, TX. He graduated from Southern Methodist University in 2021 with an MBA in Finance and Strategy.

Luke Habecker
Analyst, Investment Banking

Prior to joining Davidson Capital Advisors, Mr. Habecker worked in Brokerage and Business development with
Odyssey Specialized Logistics, a logistics firm located in Chicago, IL. He graduated from the University of North
Carolina at Charlotte with a BS in Finance.

                                                                                                                   18
DAVIDSON CAPITAL ADVISORS ANALYST TEAM
Samuel Fernandez
Analyst, Investment Banking

Prior to joining Davidson Capital Advisors, Mr. Fernandez served as a board member for Radio Nueva Vida, a
radio network chain operating in the Southeast. He graduated from the University of North Carolina at Charlotte
in 2021 with a BS in Finance.

Luke Bitler
Analyst, Investment Banking

Prior to joining Davidson Capital Advisors, Mr. Bitler interned with Tiger Chark, a strategic advisory firm located
in New. York, NY. He graduated from the University of Virginia with a BS in Economics.

                                                                                                                  19
You can also read