INDEPENDENT ASSESSMENT - 2030 Emissions Reduction Plan April 2022 - Canadian Climate Institute

Page created by Stephen Coleman
 
CONTINUE READING
INDEPENDENT ASSESSMENT - 2030 Emissions Reduction Plan April 2022 - Canadian Climate Institute
INDEPENDENT
         ASSESSMENT
                             2030 Emissions
                             Reduction Plan
                                                      April 2022

Dave Sawyer, Bradford Griffin, Dale Beugin, Franziska Förg, and Rick Smith
INDEPENDENT ASSESSMENT - 2030 Emissions Reduction Plan April 2022 - Canadian Climate Institute
SUMMARY
                                  The Canadian Climate Institute has conducted an independent assessment of
                                  the emissions projections contained in Canada’s 2030 Emissions Reduction
                                  Plan. We have also reviewed the main elements of the 2030 Plan against our
                                  Emissions Reduction Plan assessment framework published in March 2022.
                                  We conclude that the 2030 Plan is credible and sets Canada on a path to
                                  reaching its 2026 emission-reduction targets on the way to 2030 and 2050. The
                                  Plan includes more transparency on the modelling and analysis used to develop
                                  the projections than we’ve seen before, develops sector-by-sector emissions
                                  projections that could form the basis of sectoral road maps to aid with
                                  implementation, and provides insight on how the plan is to be executed.

                                  We find a range of emissions outcomes based on announced, legislated, and
                                  developing policies that highlights the work that still needs to be done to
                                  match the ambitions of this plan. Ultimately, Canada’s success in achieving
                                  its emissions milestones will depend on the policies that are actually
                                  implemented. Canada’s focus must now shift to expediting necessary new
                                  policies, tracking results, and adjusting as needed. In our recommendations,
                                  we identify five critical policies to prioritize, given the limited window to
                                  achieve the 2030 milestone. Together, these policies—carbon price, oil and
                                  gas cap, Clean Electricity Standard, Clean Fuel Standard, and policies for land-
                                  use emission reductions—account for nearly two thirds (62 per cent) of
                                  Canada’s total reductions to 2030.

                                  The country finally has a comprehensive, detailed, and credible greenhouse gas
                                  emissions reduction plan. Now, time is of the essence in putting it into effect.

Independent Assessment: 2030 Emissions Reduction Plan                                                                2
INDEPENDENT ASSESSMENT - 2030 Emissions Reduction Plan April 2022 - Canadian Climate Institute
TABLE
                                 OF CONTENTS
                                 1. Assessing the 2030 Emissions Reduction Plan........................................................... 4

                                 2. Assessment against the Canadian Climate Institute framework..................6

                                 3. Approach to modelling the 2030 Emissions Reduction Plan............................8

                                 4. Independent modelling of 2030 Emissions Reduction Plan............................ 11

                                      4.1		     Comparison with 2030 Emissions Reduction Plan modelling..........14.

                                      4.2       Large emitters........................................................................................................................ 15

                                      4.3       Oil and gas (upstream and downstream)..........................................................16

                                      4.4       Electricity generation....................................................................................................... 17

                                      4.5       Buildings.....................................................................................................................................18

                                      4.6       Transportation........................................................................................................................19

                                      4.7       Agriculture, waste, and other....................................................................................20

                                 5 Conclusions and recommendations.................................................................................. 21

                                 Acknowledgments................................................................................................................................ 25

Independent Assessment: 2030 Emissions Reduction Plan                                                                                                                                          3
INDEPENDENT ASSESSMENT - 2030 Emissions Reduction Plan April 2022 - Canadian Climate Institute
1
    ASSESSING THE 2030
    EMISSIONS REDUCTION PLAN
                                      Getting Canada to net zero emissions by 2050 is a process that will involve
                                      ongoing assessment of progress and continuous improvement over time. The
                                      2030 Emissions Reduction Plan is a first step in this process, as defined by
                                      Canada’s new climate governance framework. Under the Canadian Net-Zero
                                      Emissions Accountability Act, the federal government must “use the best
                                      scientific information available and promote transparency, accountability,
                                      and immediate and ambitious action in support of achieving” national targets.

                                      This report is our contribution to that cycle of continuous improvement. It
                                      provides an independent assessment of the federal government’s recently
                                      released 2030 Emissions Reduction Plan.

                                      The core of our analysis uses independent economic modelling to benchmark
                                      the projections and analysis in the Plan. We answer the question: To what
                                      extent is Canada on track to achieving the milestone pathway defined by
                                      the 2030 Emissions Reduction Plan?

                                      We also qualitatively assess the substance of the Plan. Drawing on the
                                      Institute’s framework for a credible, adaptive Emissions Reduction Plan1, we
                                      assess the policies and processes defined in the 2030 Emissions Reduction
                                      Plan to determine if the policy package could achieve the 2030 milestone
                                      target if implemented successfully.

                                      Overall, we find that the Plan is credible and can deliver deep emissions
                                      reductions—if the policies are xecuted in a timely fashion. The Plan as announced
                                      could put us on track to meet our 2026 targets, and nearly on track to meet our
                                      2030 targets—that small gap is important, but it can be made up with ongoing
                                      adjustments and improvements to Canada’s emission reduction policies.

                                      Canada now has an ambitious plan capable of delivering deep reductions on
                                      the path to net zero by 2050. The key challenge now is to implement well-
                                      designed policies as soon as possible. There are less than nine years until 2030.

                                      1
                                       Sawyer, Dave, Brad Griffin, Anna Kanduth, and Dale Beugin. 2022. Setting Canada Up for Success: A frame-
                                      work for Canada’s Emissions Reduction Plans. Canadian Climate Institute.

    Independent Assessment: 2030 Emissions Reduction Plan                                                                                         4
INDEPENDENT ASSESSMENT - 2030 Emissions Reduction Plan April 2022 - Canadian Climate Institute
The success of the Plan hinges on enacting a large and complex policy package
                                  in a short timeframe while achieving a level of technology and financing
                                  deployment that is a significant shift from current levels.

                                  Just as the 2030 Emissions Reduction Plan is the first step in the federal
                                  government’s new approach to climate governance, this report and
Public, transparent               the accompanying framework represent the Canadian Climate Institute’s
iteration between                 first step in providing independent assessment to guide policy implementation.
                                  We recognize that public, transparent iteration between government plan
government plan and
                                  and expert advice is the best approach to meeting climate goals. The Institute
expert advice is the best         will continue to provide this independent assessment for subsequent steps

approach to meeting               in the federal government’s emissions planning and reporting processes on
                                  the path to 2030.
climate goals.
                                  The document is organized into four further sections. Section 2 applies the
                                  assessment f ramework we developed in Setting Canada Up for Success:
                                  A Framework for Canada’s Emissions Reduction Plans. Section 3 lays out
                                  our approach to modelling the policies included in the 2030 Emissions
                                  Reduction Plan to validate its expected impacts. Section 4 summarizes the
                                  results of this analysis, taking a sector-level approach. Section 5 draws out
                                  five main conclusions from our analysis and identifies recommendations to
                                  guide policy implementation.

Independent Assessment: 2030 Emissions Reduction Plan                                                          5
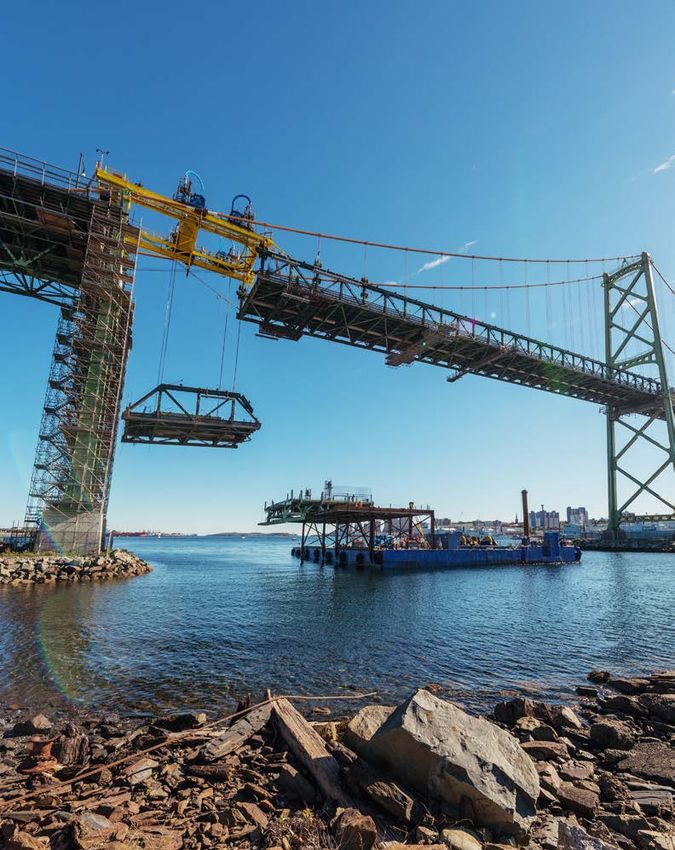
INDEPENDENT ASSESSMENT - 2030 Emissions Reduction Plan April 2022 - Canadian Climate Institute
2
    ASSESSMENT AGAINST
    THE CANADIAN CLIMATE
    INSTITUTE FRAMEWORK
                                      Given its comprehensiveness, transparency, and ambition, the 2030 Emissions
                                      Reduction Plan is a strong start to the next phase of Canada’s climate strategy.
                                      It also highlights that Canada’s work in achieving the 2030 target is only just
                                      beginning. Ultimately, success will depend on the successful implementation
                                      of the policies in the 2030 Plan—and course correction as necessary over time.

                                      Because emissions reduction plans are a new and important planning tool
                                      for the federal government, with subsequent plans released every five years,
                                      it is important to get them right. To do that, a process of continuous
                                      improvement will need to be a defining feature of the plans. To help inform
                                      such a process of continuous improvement, the Institute has developed a
                                      f ramework consisting of three elements that ensure each Emissions
                                      Reduction Plan can credibly deliver greenhouse gas reductions consistent
                                      with Canada’s net zero commitments. These three elements are:

                                          1.   An emissions pathway consistent with net zero.

                                          2.   Policies that credibly reduce emissions to the milestone.

                                          3.   Governance processes that are responsive, take stock of progress, and
                                               update to course correct.

                                      This section provides a summary of how the 2030 Plan compares against our
                                      framework. Overall, the plan includes the key elements of a credible Emissions
                                      Reduction Plan that we previously identified, as summarized in Table 1. In
                                      short, it does what the Canadian Net-Zero Emissions Accountability Act
                                      requires it to do: it demonstrates policy ambition consistent with the medium-
                                      term target, and it transparently lays out the federal government’s current
                                      state of policy planning.

    Independent Assessment: 2030 Emissions Reduction Plan                                                            6
INDEPENDENT ASSESSMENT - 2030 Emissions Reduction Plan April 2022 - Canadian Climate Institute
Table 1
                                   Element          Indicator           Assessment   Notes

Summary                                                                              Modelling in the Plan is grounded in
                                                                                     analysis simulating impacts of specific
assessment of the
                                                    Transparent
                                                                                     policies, but also highlights remaining
                                                    modelling
                                                                                     effort required. Our own independent
2030 Emissions
                                                    defines                Yes
                                                                                     modelling broadly validates the
                                                    achievable
                                                                                     government’s. The policies in the Plan
Reduction Plan
                                                    pathway
                                                                                     could place Canada on a net zero
                                                                                     pathway to 2050.

                                   Consistent                                        Modelling undertakes some sensitivity
                                   with net zero                                     analysis, for example testing how high
                                   emissions        Emissions                        and low economic growth affects
                                   pathway          pathway is           Partially   reference case projections. Sensitivity
                                                    stress-tested                    testing on the policy package was
                                                                                     not conducted; nor were barriers to
                                                                                     implementation.

                                                    The Plan
                                                    includes                         Modelling explicitly demonstrates
                                                    emissions              Yes       sector-level pathways with detail on
                                                    pathways by                      sub-sector and regional outcomes.
                                                    sector

                                                                                     The Plan highlights a range of specific
                                                    Policy measures                  policies, both existing and proposed;
                                                    are detailed,                    some specific policies (e.g., oil and
                                                                           Yes
                                                    specific,                        gas cap) remain undefined, though
                                                    concrete                         the Plan transparently recognizes
                                                                                     additional work is required
                                   Credible
                                                    Transparent                      Emissions reductions are provided
                                   policies to
                                                    analysis of                      by sector and for major technology
                                   reach the                             Partially
                                                    contributions of                 and energy pathways. Reductions by
                                   milestone
                                                    policy measures                  policy are not provided.

                                                                                     Annex 8 includes an Implementation
                                                    Policies and
                                                                                     Plan for key measures, though does
                                                    implementation
                                                                         Partially   not explicitly identify sources of
                                                    risks are stress-
                                                                                     implementation risk or strategies to
                                                    tested
                                                                                     address them.

                                                                                     The Plan identifies key drivers of
                                                                                     national emissions, both historically
                                                    The Plan looks                   and in projections. Some sectoral
                                                    backwards as         Partially   detail is provided, for example in oil
                                                    well as forwards                 and gas. More sectoral detail would
                                                                                     better help understand the level of
                                                                                     effort required at the sector level.
                                   Responsive
                                   and adaptive
                                   governance       The Plan
                                                                                     The Plan does not identify data needs
                                                    identifies data        No
                                                                                     or key indicators to track performance.
                                                    gaps and needs

                                                    The Plan                         Alongside emissions reductions, the
                                                    considers other                  Plan considers Indigenous rights,
                                                                           Yes
                                                    aspects of policy                competitiveness, cost-effectiveness,
                                                    performance                      and fairness.

Independent Assessment: 2030 Emissions Reduction Plan                                                                          7
INDEPENDENT ASSESSMENT - 2030 Emissions Reduction Plan April 2022 - Canadian Climate Institute
3
    APPROACH TO
    MODELLING THE 2030
    EMISSIONS REDUCTION PLAN
                                     Building off our assessment of the Plan according to the Institute’s framework
                                     above, the Canadian Climate Institute has followed a four-step approach to
                                     assess the emissions reductions modelled in the Plan:

                                        1.   We developed a list of emissions reduction policies. Given that the
                                             federal government has been implementing previously announced
                                             policies and announcing new ones, a first step prior to the release of
                                             the Plan was to develop a policy list to be modelled. Source documents
                                             to identify policies likely to be incorporated into the 2030 Emissions
                                             Reduction Plan included the Strengthened Climate Plan, Budget 2021,
                                             the 2019 Liberal election platform, discussion papers, and regulatory
                                             documents such as Regulatory Impact Analysis Statements.

                                             We identified 25 federal policies, from a long list of more than twice
                                             that number, that would likely lead to material emission reductions.
                                             We chose to omit those policies that would deliver small reductions
                                             and that are difficult to model. Inf rastructure spending by
                                             Infrastructure Canada and the Green Municipal Fund was excluded
                                             due to a lack of detail.

                                             A range of provincial and territorial policies was also included in the
                                             analysis and modelling, including Quebec’s cap-and-trade program,
                                             biofuel mandates in Ontario and other provinces, and zero-emission
                                             vehicle mandates in British Columbia.

                                        2    We specified the design choices to be modelled for each policy. In
                                             the Institute’s Emissions Reduction Plan assessment framework, three
                                             types of policies were identified, each of which represents a different
                                             level of certainty in the policy design choices:

                                             ▶    Legislated: For policies that are already legislated, the coverage of
                                                  emissions, the timing of implementation, and the stringency of the
                                                  policy are already known. In these cases, there is greater certainty

    Independent Assessment: 2030 Emissions Reduction Plan                                                              8
INDEPENDENT ASSESSMENT - 2030 Emissions Reduction Plan April 2022 - Canadian Climate Institute
as to policy design, which makes modelling results much more
                                              straightforward.

                                         ▶    Developing: Other policies are developing, with public documents
                                              available that indicate how they are likely to be designed and imple-
                                              mented. There is less certainty in these policies as they have yet to be
                                              legislated, but their stringency and coverage are known. For example,
                                              the Fuel Charge is legislated but the carbon price rising to $170 in
                                              2030 is not legislated.

                                         ▶    Announced: These policies have yet to enter a planning cycle,
                                              with little information on the specifics of policy coverage and strin-
                                              gency. Their design is uncertain. Examples include the announced
                                              zero-emission vehicle mandates and the Clean Electricity Standard.

                                         With this taxonomy in place, the Institute’s modelling scenarios
                                         include:

                                         a.   Legislated-plus-developing scenario, where policy design and
                                              implementation are well known.

                                         b. Two additional scenarios representing a lesser and greater level of
                                              policy effort with policies that have been announced but not yet
                                              legislated: an announced, less stringent and an announced,
                                              more stringent scenario. As an example, the announced, less
                                              stringent scenario might include an oil and gas emissions cap of
                                              130 megatonnes, whereas the announced, more stringent scenario
                                              might set the cap at 100 megatonnes.

                                         To the extent the 2030 Emissions Reduction Plan does not deliver on
                                         the targets, there will be a need to modify existing policies or to develop
                                         new policies.

                                    3. We verified and tested policy assumptions. Given the uncertainty
                                         in policy design, we consulted Environment and Climate Change
                                         Canada (ECCC) to verify if the Institute’s policy assumptions are
                                         reasonable. In several cases, ECCC pointed to public-facing documents
                                         to help refine the Institute’s policy assumptions. In others, notably the
                                         oil and gas cap and the CCUS tax credit, public information is not
                                         available and ECCC did not comment on our assumptions.

                                         With these additional clarifications, we then conducted a series of
                                         model tests that isolated high-impact policies with the objective of
                                         verifying the reasonableness of the emission outcomes. In several
                                         cases, we adjusted our policy assumptions, typically towards being less
                                         stringent to ensure a more conservative estimate of impact.

Independent Assessment: 2030 Emissions Reduction Plan                                                                  9
INDEPENDENT ASSESSMENT - 2030 Emissions Reduction Plan April 2022 - Canadian Climate Institute
4. We updated policy assumptions and ran the scenarios. Once the
                                         2030 Emissions Reduction Plan was released, we compared published
                                         information against the Institute’s policy assumptions. In several cases,
                                         policies were updated. The resulting policies were then simulated to
                                         develop emission projections at national and sectoral levels to 2030.
                                         The 2030 Plan’s emissions pathways were then compared against net
                                         zero pathways the Institute published as part of our assessment
                                         framework report. National and sectoral results are presented for the
                                         2026 objective, the 2030 milestone, and the pathway to net zero by
                                         mid-century.

Independent Assessment: 2030 Emissions Reduction Plan                                                                10
4
    INDEPENDENT MODELLING OF
    2030 EMISSIONS REDUCTION PLAN
                                      Our modelling2 indicates that the 2030 Emissions Reduction Plan policy
                                      package puts Canada on a path to achieve the 2026 objective and very close
                                      to achieving the 2030 objective. In our view, the policy package presented in
                                      the 2030 Plan provides the foundation for a credible path forward. Specifically:

                                             ▶    Legislated and developing policies put Canada on an emissions
                                                  trajectory of 522 megatonnes in 2030, which is a 29 per cent decrease
                                                  from 2005 levels and a 2.7 per cent annual decrease from 2019 levels.

                                             ▶    When announced policies in the less stringent scenario are added,
                                                  emissions are on track with the lower end of the 2026 objective but are
                                                  not aligned with the actions required to hit the 2030 milestone. These
                                                  policies are on track for emissions of 484 megatonnes in 2030, which
                                                  is a 34 per cent decrease from 2005 levels and a 3.4 per cent annual
                                                  decrease from 2019 levels.

                                             ▶    When announced policies in the more stringent scenario are
                                                  added, emissions exceed the level to achieve the 2026 objective under
                                                  the net zero pathway but fall just short of achieving the levels required
                                                  to hit 40 per cent below 2005 in 2030. These policies are on track for
                                                  emissions of 454 megatonnes in 2030, which is a 39 per cent decrease
                                                  from 2005 levels and a 4 per cent annual decrease f rom 2019 levels.

                                      Two indicators are used to track the emissions pathways:

                                             ▶    The absolute levels of emissions to be achieved, measured in mega-
                                                  tonnes of carbon dioxide equivalent (MtCO₂e).

                                             ▶    The annual change in emissions required, specified as the compounded
                                                  annual growth rate (CAGR).

                                      2
                                          The modelling and analysis was conducted in partnership with Navius Research

    Independent Assessment: 2030 Emissions Reduction Plan                                                                 11
Figure 1                                                                                                                                                                    2019-2026             2026-2030
                                                          800
                                                                  739

Canada’s emissions
                                                                                                                                                                                     NZ                      NZ
                                                          700
                                                                                                                                                                          ERP     Pathway       ERP       Pathway
                                                          600                                                                                                 0.0%                                                     0%

pathway under the
                                                                                                   522

                                                                                                                            Annual Emissions Change (CAGR%)
                                    Emissions (MtCO2 e)
                                                                                                                                                              -1.0%                                                    -1%
                                                          500                     555               484
                                                                                                                                                              -2 .0%               -2.6%                               -2%
                                                                                                     452                                                                 -2.8%

2030 Emissions
                                                          400                                                                                                 -3.0%                                                    -3%
                                                                                   407-443
                                                                                                                                                              -4.0%      -3.3%                 -4.4%                   -4%
                                                          300                                                                                                                                                 -5.1%

Reduction Plan
                                                                        2026 Objective                                                                        -5.0%                -4.4%                               -5%
                                                                        2030 Milestone                                                                                                         -5.1%
                                                          200                                                                                                 -6.0%                                                    -6%
                                                                        NZ Pathway Median GHGs
                                                                        Legislated / Developing                                                               -7.0%                                                    -7%
                                                          100
                                                                        + Announced (less stringent)                                                          -8.0%                                                    -8%
                                                                        + Announced (more stringent)                                                          -9.0%                                           -8.3%    -9%
                                                           0
                                                            2005 2010 2015 2020 2025 2030 2035 2040 2045 2050

                                                                                                             Historical                                                                    Projection
                                                                                                                                                                           2026 Objective            2030 Milestone
                                                                                               2005-2019      2005         2019                                        2019-2026      2026       2026-2030      2030
                                                                                                 CAGR        MtCO2 e      MtCO2 e                                        CAGR       MtCO2 e        CAGR        MtCO2 e
                                             Net Zero Pathway
                                                                        Lower effort                                                                                     -2 .6%                       -5.1%
                                             Annual change              Median                    -0.3%                                                                  -3.4%                        -6.3%
                                                                        Higher effort                                                                                    -4.4%                        -8.3%
                                                                        Lower effort                                                                                                    588                           478
                                             Emissions                  Median                                 739          706                                                         555                           427
                                                                        Higher effort                                                                                                   514                           364

                                             Emissions Reduction Plan
                                                                        Legislated / Developing                                                                          -2.6%          588           -2.9%           522
                                                                        + Announced (less stringent)                                                                     -2.8%          580           -4.4%           484
                                                                        + Announced (more stringent)                                                                     -3.3%          557           -5.1%           452

                                                           Does not meet lower CAGR                Meets lower CAGR, but not median                                       Meets or exceeds median CAGR

                                    An important question for this first Emissions Reduction Plan is, Which policies
                                    must be successful to achieve the 2030 milestone?

                                    The analysis suggests that five policies are critical for the plan to achieve the
                                    2030 milestone, representing nearly two thirds (62 per cent) of Canada’s total
                                    reductions to the target:

                                                          ▶     Two policies—one, the legislated but still developing increase in the
                                                                carbon price under the fuel charge and in output-based pricing
                                                                systems, and two, the Clean Fuel Standard—account for 26 per cent
                                                                of the incremental reductions needed by 2030.

                                                          ▶     The announced emissions cap on oil and gas accounts for 33 mega-
                                                                tonnes or 18 per cent of the reduction to the target.

                                                          ▶     The announced Clean Electricity Standard delivers 21 megatonnes
                                                                or 11 per cent of the reductions to the target.

                                                          ▶     Announced policies for land use reductions are 19 megatonnes or
                                                                7 per cent of the target.3

                                    3
                                     Land use reductions and land use, land-use change, and forestry (LULUCF) accounting are taken directly
                                    from the 2030 Emissions Reduction Plan.

  Independent Assessment: 2030 Emissions Reduction Plan                                                                                                                                                                      12
Figure 2 shows the incremental greenhouse gas emissions impact of each
                                  policy or policy package in 2030 relative to the emissions f rom federal,
                                  provincial, and territorial policies already legislated and implemented.4
                                  According to our calculations, at least 43 per cent of the emissions reductions
                                  are accounted for from policies that have been announced and still need to
                                  be developed. Accounting for the increase in the carbon price proposed under
                                  the Strengthened Climate Plan and implementing the Clean Fuel Standard,
                                  the policies still to be implemented increase to at least 69 per cent of the
                                  projected gap.

                                            200

Figure 2                                          187                                                                           Reductions needed to -40%/05 in 2030
                                                              CPrice, Clean Fuel Regulation
                                                                                                                                Legislated or Developing Policy

Projected
                                            180

                                                                                                                                Announced (more stringenct scenario)
                                            160

contributions                               140

of announced
                                                        -49              O&G Cap

                                            120

policies (more
                                  Mt CO2e

                                            100                  -33                Clean electricity standard

stringent scenario)                         80                               -21               O&G methane regulations

to emissions
                                                                                         -8             Waste methane regulations
                                                                                                   -5               Low-carbon vehicle standards
                                                                                                              -4
                                            60                                                                                 All other policies

reductions in 2030                          40
                                                                                                                          -15
                                                                                                                                               Land use reductions

                                                                                                                                        -19               WCI Imports
                                            20
                                                                                                                                                            LULCUF accounting
                                                                                                                                                    -13
                                                                                                                                                                        Gap is 9 Mt
                                                                                                                                                                  -11
                                             0

                                  4 Western Climate Initiative allowance imports into Quebec’s cap and trade program are calculated from the
                                  model as the difference between emissions reduced under the 2030 Plan, provincial policy, and Quebec’s
                                  stated emissions cap. These imports are a large share of the total reductions, which are calculated to be 13
                                  megatonnes.

Independent Assessment: 2030 Emissions Reduction Plan                                                                                                                                 13
4.1 COMPARISON WITH 2030 EMISSIONS
                                   REDUCTION PLAN MODELLING
                                   Table 2 provides a comparison between the emissions reductions contained
                                   in the 2030 Emissions Reduction Plan and the independent modelling and
                                   assumptions, conducted with our partners Navius Research, which informs
                                   this assessment. Three observations are worth noting:

                                      ▶     The total national reductions are consistent between modelled policies.

                                      ▶     Some sectors are closely aligned. Typically, the modelling produces
                                            similar outcomes when there is an emissions constraint such as the
                                            proposed oil and gas cap or the announced Clean Electricity Standard.

                                      ▶     Some sectors show a large difference between the two sets of model-
                                            ling results, especially for large emitters where differing assumptions
                                            on abatement opportunities or compliance responses under large
                                            emitter carbon pricing explain the divergent emissions outcomes.

                                   The existence of such different views on abatement responses across several
                                   subsectors indicates a risk that the policies won’t be implemented in time, or
                                   that real-world policy may not deliver results consistent with the modelling.
                                   Taking stock of emissions outcomes therefore becomes an important hedge
                                   to verify that policy is performing as intended and to course correct as needed.

Table 2
                                   Sector                      Historical                    Projected 2030
Comparison                                                    2005        2019   ERP    Announced,             Announced,

of emissions
                                                                                       less stringent         more stringent

reductions: 2030
                                                                     Mt          Mt    Mt       % vs ERP      Mt    % vs ERP

                                   Oil & Gas                  160         192    118   136        +15%        115     -2%
Plan and announced                 Electricity                118          61    15    16         +9%          7      -50%

scenarios                          Transportation             160         186    150   133        -11%        129     -14%
* WCI imports are estimated from   Large Emitters              87         78     54    76        +40%         79      +46%
the Institute’s modelling.
                                   Buildings                  84           91    60    62         +4%         62      +4%

                                   Agriculture                 72         73     73    68         -7%         68      -7%

                                   Waste                       31         28     16    13         -17%         12     -23%

                                   Others                      26         23     14    23         +67%        23      +66%

                                   Total (excl. LULUCF)       739         732    500   528        +6%         497      -1%

                                   LULUCF, nature-based,
                                                              n/a          -8    -30   -44        48%         -44     48%
                                   ag, and WCI imports*

                                   Total (with adjustments)   739         724    470   484        +3%         452     -4%

Independent Assessment: 2030 Emissions Reduction Plan                                                                          14
4.2 LARGE EMITTERS
                                         Relative to most other sectors, there is a limited number of policies focused
                                         on the large industrial emitters, with the output-based pricing system being
                                         the most important policy. The other main policies consist of a range of
                                         targeted subsidy programs. These include renewable fuels investments, the
                                         investment tax credit for CCUS, the Net Zero Accelerator, hydrogen projects,
                                         and direct reduced iron and steel projects.

                                         Emissions reductions for the large emitters are on pace with the net zero
                                         pathway under almost all scenarios, meeting the lower end of the net zero
                                         pathway. There is a policy interaction in the announced, more stringent
                                         scenario where more oil and gas reductions result in fewer emissions
                                         reductions from the output-based pricing system; this interaction causes
                                         large-emitter emissions to fail to meet the net zero pathway in 2030. But
                                         emissions reductions are not indicative of compliance under the large emitter
                                         carbon pricing programs where credit trading allows some facilities to do
                                         more than their regulated emission limits and sell the excess credits. Through
                                         interactions with the oil and gas cap, the sector—in aggregate—purchases
                                         emissions reduction credits from the oil and gas sector.

                                                                     2020   2025      2030         2035      2040        2045          2050                                                          2019-2026            2026-2030
Figure 3                                                       100
                                                                                                               Safe bets
                                                                                                               Wild cards
                                                                                                               Low oil price                                                                                 NZ                   NZ

Large emitters’
                                                               90                                              Equal share target          90.0
                                                                                              79                                                                                                ERP       Pathway       ERP    Pathway
                                                                                                               Legislated / Developing
                                                               80                                              + Announced ( less stri ngent)                                                                                              3%
                                                                                               77

emissions pathway
                                                                                                               + Announced ( more stri ngent)                                                               1.8%
                                                                                                                                                  Annual Emissions Change (CAGR%)

                                                                                                                                                                                    2.0%
                                         Emissions (MtCO2 e)

                                                               70                                                                          70.0                                                                                            2%
                                                                                        76
                                                               60                                                                                                                               0.7%                                       1%

under the 2030
                                                                                                                                                                                    0.0%        0.7%                   -0.5%       -0.4%   0%
                                                               50                                                                         50.0
                                                                              48-52                                                                                                                                                        -1%
                                                               40

ERP*
                                                                                                                                                                                    -2 .0%                 -1.7%       -1.6%               -2%
                                                               30                                                                         30.0
                                                                                                                                                                                                                                           -3%
                                                               20                                                                                                                   -4.0%                                                  -4%

*Note: The Institute used integrated                           10                                                                         10.0                                                                                             -5%
economy-wide modelling to de-                                                                                                                                                                                                      -5.1%
                                                                0                                                                                                                   -6.0%                                                  -6%
velop a range of sectoral emissions
                                                               -10                                                                        -10.0
pathways working backwards from
                                                                  2020      2025      2030         2035      2040        2045        2050
a national target of net zero in
2050 and hitting the 2030 national
target. The emissions pathways                                                                                         Historical                                                                                 Projection
are developed from a common set                                                                                                                                                             2026 Objective                  2030 Milestone
of cost-effective pathways, where                                                                     2005-2019          2005             2019                                          2019-2026      2026             2026-2030      2030
the least-cost policy is consistently
                                                                                                        CAGR            MtCO2 e          MtCO2 e                                          CAGR       MtCO2 e              CAGR        MtCO2 e
applied in the 62 scenarios. To help
assess technical feasibility for the              Net Zero Pathway
emissions pathways, we sorted the                                             Lower effort                                                                                                   1.8%                         -0.4%
                                                  Annual change               Median                      -0.9%                                                                              -0.7%                        -5.1%
runs into the Institute’s taxono-
my of safe bets and wild cards.                                               Higher effort                                                                                                  -1.7%                        -5.1%
For each sector, the equal share                                              Lower effort                                                                                                                   87                            86
benchmark is the level of emissions               Emissions                   Median                                       87               77                                                               73                            59
in 2030 equivalent to achieving                                               Higher effort                                                                                                                  68                            55
Canada’s national target of a 40 to
45 per cent reduction below 2005                  Emissions Reduction Plan
levels. Modelling results for the Plan                                        Legislated / Developing                                                                                        0.7%            81            -1.3%           77
are then compared with the net                                                + Announced (less stringent)                                                                                   0.7%            81            -1.6%           76
zero pathways to 2050.                                                        + Announced (more stringent)                                                                                   0.7%            81            -0.5%           79

                                                                Does not meet lower CAGR                   Meets lower CAGR, but not median                                                   Meets or exceeds median CAGR

Independent Assessment: 2030 Emissions Reduction Plan                                                                                                                                                                                            15
4.3 OIL AND GAS (UPSTREAM AND DOWNSTREAM)
                                  There are a considerable number of policies focused on the oil and gas sector,
                                  including large emitter carbon pricing, a proposed cap on emissions, methane
                                  regulations, the Clean Fuels Regulation, the CCUS investment tax credit,
                                  hydrogen project subsidies, and access to the Net Zero Accelerator.

                                  Emissions reductions are on track for the 2026 milestone under the announced,
                                  more stringent policies scenario. In 2030, this policy package appears to be
                                  able to deliver emissions reductions consistent with achieving the net zero
                                  pathway for the sector. Emissions reductions from announced policies are in
                                  the order of 55 to 76 megatonnes below 2019 levels, or 14 to 27 per cent below
                                  2005 levels. Of course, many of these policies, notably the oil and gas cap, have
                                  yet to be implemented, and so these emissions reductions are contingent on
                                  credible policy being developed and deployed as quickly as possible.

Figure 4
                                                               2020   2025      2030          2035     2040
                                                                                                       Safe bets 2045            2050                                                             2019-2026           2026-2030
                                                        200                                            Wild cards                     200.0
                                                                                                       Low oil price                                                                                      NZ                  NZ

Oil and gas
                                                                                                       Equal share target             180.0
                                                                                                       Legislated / Developing
                                                                                                                                                                                             ERP       Pathway      ERP    Pathway
                                                                                        167
                                                        160                                            + Announced ( less stri ngent) 160.0

emissions pathway
                                                                                                       + Announced ( more stri ngent)                                            -1.0%      -1.6%       -1.7%                           -1%
                                                                                                                                              Annual Emissions Change (CAGR%)
                                  Emissions (MtCO2 e)

                                                                                        136                                           140.0
                                                                                                                                                                                 -3.0%                                         -3.5%    -3%
                                                        12 0                                                                         120.0

under the 2030 ERP
                                                                                        115
                                                                                                                                     100.0                                       -5.0%                             -5.5%                -5%
                                                                                                                                                                                            -4.3%
                                                                                                                                                                                                        -4.8%      -4.7%
                                                         80             87-95                                                        80.0
                                                                                                                                                                                 -7.0%                                                  -7%
                                                                                                                                     60.0

                                                         40                                                                          40.0                                        -9.0%                                                  -9%

                                                                                                                                     20.0                                       -11.0%                                         -9.9%    -11%

                                                          0                                                                          0.0
                                                           2020       2025      2030          2035     2040        2045         2050

                                                                                                                 Historical                                                                                   Projection
                                                                                                                                                                                        2026 Objective                  2030 Milestone
                                                                                                 2005-2019         2005              2019                                           2019-2026      2026             2026-2030      2030
                                                                                                   CAGR           MtCO2 e           MtCO2 e                                           CAGR       MtCO2 e              CAGR        MtCO2 e
                                           Net Zero Pathway
                                                                        Lower effort                                                                                                     -1.7%                        -3.5%
                                           Annual change                Median                       1.4%                                                                                -2 .1%                       -4.3%
                                                                        Higher effort                                                                                                    -4.8%                        -9.9%
                                                                        Lower effort                                                                                                                     169                           146
                                           Emissions                    Median                                      158                191                                                               165                           138
                                                                        Higher effort                                                                                                                    135                            89

                                           Emissions Reduction Plan
                                                                        Legislated / Developing                                                                                          -1.1%           177           -1.4%           167
                                                                        + Announced (less stringent)                                                                                     -1.6%           171           -5.5%           136
                                                                        + Announced (more stringent)                                                                                     -4.3%           140           -4.7%           115

                                                          Does not meet lower CAGR                   Meets lower CAGR, but not median                                                     Meets or exceeds median CAGR

Independent Assessment: 2030 Emissions Reduction Plan                                                                                                                                                                                          16
4.4 ELECTRICITY GENERATION
                                  Three Plan policies were identified for the electricity sector. While the number
                                  of policies is small, the emissions reductions associated with these programs
                                  are significant. Output-based pricing will continue to drive down emissions
                                  in the sector. The proposed Clean Electricity Standard also looks to be a serious
                                  policy, driving new incremental reductions to reach a net zero electricity
                                  system by 2035. Spending from the Canada Infrastructure Bank will add to
                                  the reductions through financing. Many provincial and territorial policies are
                                  also at play here.

                                  Emissions in the announced, more stringent scenario significantly exceed the
                                  net zero pathway trajectory in 2030. Under all other scenarios in 2026 and
                                  2030, the emissions trajectory is above the net zero pathway. It’s worth noting,
                                  however, that electricity sector emissions in 2030 in the legislated and
                                  developing scenario are down 85 per cent f rom 2005 levels and in the
                                  announced, more stringent scenario are fully 94 per cent below 2005 levels.

                                                              2020   2025      2030           2035      2040         2045        2050                                                         2019-2026             2026-2030
Figure 5                                                80                                            base
                                                                                                      base
                                                                                                                                     80.0
                                                                                                      base                                                                                              NZ                   NZ

Electricity
                                                                                                      Equal share target                                                                     ERP     Pathway      ERP     Pathway
                                                        60             65-71                          Legislated / Developing        60.0
                                                                                                      + Announced (less stri ngent)
                                                                                                                                                                                0.0%                                                  0%
                                                                                                                                             Annual Emissions Change (CAGR%)

emissions pathway
                                                                                                      + Announced (more stri ngent)
                                  Emissions (MtCO2 e)

                                                                                                                                                                                -5.0%                                                 -5%
                                                        40                                                                          40.0                                                    -8.5%
                                                                                                                                                                                                                 -9.6%
                                                                                                                                                                               -10.0%                                                 -10 %

under the 2030 ERP
                                                                                       16
                                                        20                                                                          20.0                                       -15.0%       -12.2%    -16.2%                 -16.8%   -15%
                                                                                         16
                                                                                        7                                                                                      -2 0.0%                                       -17.9%   -20 %
                                                          0                                                                         0 .0
                                                                                                                                                                               -2 5.0%                                                -25%
                                                                                                                                                                                                      -24.3%
                                                        -2 0                                                                        -20 .0
                                                                                                                                                                               -30.0%                                                 -30 %
                                                                                                                                                                                                                 -30.9%
                                                                                                                                                                               -35.0%                                                 -35%

                                                        -40                                                                         -40 .0
                                                           2020      2025      2030           2035      2040       2045        2050

                                                                                                                 Historical                                                                                 Projection
                                                                                                                                                                                        2026 Objective                2030 Milestone
                                                                                                 2005-2019         2005             2019                                            2019-2026      2026           2026-2030      2030
                                                                                                   CAGR           MtCO2 e          MtCO2 e                                            CAGR       MtCO2 e            CAGR        MtCO2 e
                                           Net Zero Pathway
                                                                       Lower effort                                                                                                      -16.2%                     -17.9%
                                           Annual change               Median                        -4.7%                                                                               -21.8%                     -12.5%
                                                                       Higher effort                                                                                                     -24.3%                     -16.8%
                                                                       Lower effort                                                                                                                    18                             8
                                           Emissions                   Median                                        119              61                                                               11                             6
                                                                       Higher effort                                                                                                                   9                              4

                                           Emissions Reduction Plan
                                                                       Legislated / Developing                                                                                           -12.3%        24            -9.6%            16
                                                                       + Announced (less stringent)                                                                                      -12.2%        25            -9.6%            16
                                                                       + Announced (more stringent)                                                                                       -8.5%        33           -30.9%             7

                                                          Does not meet lower CAGR                    Meets lower CAGR, but not median                                                    Meets or exceeds median CAGR

Independent Assessment: 2030 Emissions Reduction Plan                                                                                                                                                                                         17
4.5 BUILDINGS
                                  In total, we identified eight policies that are material to emissions reductions
                                  in the buildings sector, including carbon pricing, interest-free home retrofit
                                  loans, a net zero buildings strategy, funding for residential retrofits and
                                  community building upgrades, and announced regulations to reduce the use
                                  of home heating oil.

                                  Modelling indicates that this sector is on a net zero pathway to 2030 across
                                  most of the scenarios. That said, at 28 per cent below 2005 levels, emissions
                                  are well off the equal-share target, which for each sector is a 40 per cent
                                  reduction below the sector’s 2005 levels by 2030. This result is not surprising
                                  given how difficult it is to reduce emissions in buildings absent switching out
                                  fossil fuel heating systems. Such a transition will likely take some time, and
                                  additional policies to accelerate this transition may be needed.

Figure 6                                                      2020   2025      2030         2035          2040         2045          2050                                                           2019-2026            2026-2030
                                                                                                          Safe bets
                                                        100

Buildings emissions
                                                                                                          Wild cards                     100.0
                                                                                                          Low oil price                                                                                     NZ                   NZ
                                                        90                                                Equal share target             90.0
                                                                                                                                                                                               ERP       Pathway       ERP    Pathway

pathway under the
                                                                                                          Legislated / Developing
                                                        80                                                + Announced ( less stri ngent) 80.0                                      -2 .5%                                                 -3%

                                                                                                                                                 Annual Emissions Change (CAGR%)
                                                                                                          + Announced ( more stri ngent)
                                  Emissions (MtCO2 e)

                                                        70                            63                                                 70.0                                                                         -2.9%       -2.9%

2030 ERP
                                                                                           62                                                                                      -3.0%                  -3.1%
                                                                                                                                                                                                                                          -3%
                                                        60                                                                              60.0                                                                          -2.9%
                                                                                                62
                                                        50                                                                              50.0
                                                                       47-52                                                                                                       -3.5%       -3.6%                                      -4%
                                                        40                                                                              40.0                                                              -3.5%
                                                                                                                                                                                               -3.6%
                                                        30                                                                              30.0
                                                                                                                                                                                   -4.0%                                                  -4%
                                                        20                                                                              20.0

                                                        10                                                                              10.0                                       -4.5%                                          -4.3%   -5%

                                                         0                                                                              0.0
                                                          2020       2025      2030         2035          2040        2045         2050

                                                                                                                    Historical                                                                                   Projection
                                                                                                                                                                                           2026 Objective                  2030 Milestone
                                                                                                     2005-2019        2005              2019                                           2019-2026      2026             2026-2030      2030
                                                                                                       CAGR          MtCO2 e           MtCO2 e                                           CAGR       MtCO2 e              CAGR        MtCO2 e
                                           Net Zero Pathway
                                                                       Lower effort                                                                                                         -3.1%                        -2 .9%
                                           Annual change               Median                          0.4%                                                                                 -3.3%                        -3.2 %
                                                                       Higher effort                                                                                                        -3.5%                        -4.3%
                                                                       Lower effort                                                                                                                         73                            65
                                           Emissions                   Median                                           86                91                                                                72                            63
                                                                       Higher effort                                                                                                                        71                            59

                                           Emissions Reduction Plan
                                                                       Legislated / Developing                                                                                              -3.6%           70            -2.6%           63
                                                                       + Announced (less stringent)                                                                                         -3.6%           70            -2.9%           62
                                                                       + Announced (more stringent)                                                                                         -3.6%           70            -2.9%           62

                                                         Does not meet lower CAGR                       Meets lower CAGR, but not median                                                     Meets or exceeds median CAGR

Independent Assessment: 2030 Emissions Reduction Plan                                                                                                                                                                                           18
4.6 TRANSPORTATION
                                  Emissions reduction policy drivers for transportation in the 2030 Plan include
                                  the federal fuel charge and a whole series of proposed vehicle emission
                                  standards, including light-duty and heavy-duty zero-emission vehicle (ZEV)
                                  sales mandates. There are also several tax incentive and rebate programs, as
                                  well as inf rastructure spending on electric vehicle charging stations and
                                  transit. There are also many important provincial policies included in the
                                  analysis such as light-duty ZEV mandates and incentives, announced heavy-
                                  duty ZEV mandates, and renewable and low-carbon fuel mandates. The
                                  emissions trajectory stays on a net zero pathway to 2030 only in the announced,
                                  more stringent policy package. Because many of these policies are announced
                                  and have yet to be solidified, there is significant implementation risk associated
                                  with this sector. Reductions in both announced scenarios are equal to a
                                  reduction of 17 to 20 per cent below 2005 levels.
                                                               2020   2025      2030      2035      2040bets 2045
                                                                                                    Safe                      2050                                                            2019-2026           2026-2030
                                                        200                                         Wild cards                    200.0
                                                                                                    Low oil price                                                                                     NZ                  NZ
                                                        180
Figure 7                                                                                            Equal share target
                                                                                                    Legislated / Developing
                                                                                                                                  180.0
                                                                                                                                                                                         ERP       Pathway      ERP    Pathway
                                                        160                                         + Announced (less stri ngent) 160.0
                                                                                                                                                                            -1.5%                                                   -2%

Transportation
                                                                                   136

                                                                                                                                          Annual Emissions Change (CAGR%)
                                  Emissions (MtCO2 e)

                                                        140                             133                                      140.0                                      -2 .0%                                                  -2%
                                                                                                                                                                                                    -2.3%

emissions pathway
                                                        12 0                             129                                     120.0
                                                                                                                                                                            -2 .5%      -2.7%                                       -3%
                                                        100                                                                      100.0                                                                                     -3.0%

under the 2030
                                                                                                                                                                            -3.0%       -2.8%       -2.9%
                                                                                                                                                                                                                                    -3%
                                                         80             89-97                                                    80.0
                                                                                                                                                                                                               -3.5%
                                                                                                                                                                            -3.5%                                                   -4%
                                                         60                                                                      60.0

ERP                                                      40
                                                         20
                                                                                                                                 40.0

                                                                                                                                 20.0
                                                                                                                                                                            -4.0%
                                                                                                                                                                                                               -4.1%
                                                                                                                                                                                                                           -4.0%
                                                                                                                                                                                                                                    -4%

                                                                                                                                                                            -4.5%                                                   -5%

                                                          0                                                                      0.0
                                                           2020       2025      2030      2035      2040        2045        2050

                                                                                                              Historical                                                                                  Projection
                                                                                                                                                                                    2026 Objective                  2030 Milestone
                                                                                               2005-2019        2005             2019                                           2019-2026      2026             2026-2030      2030
                                                                                                 CAGR          MtCO2 e          MtCO2 e                                           CAGR       MtCO2 e              CAGR        MtCO2 e
                                           Net Zero Pathway
                                                                        Lower effort                                                                                                 -2 .3%                       -3.0%
                                           Annual change                Median                   1.0%                                                                                -2 .7%                       -3.7%
                                                                        Higher effort                                                                                                -2 .9%                       -4.0%
                                                                        Lower effort                                                                                                                 158                           140
                                           Emissions                    Median                                   161               186                                                               154                           133
                                                                        Higher effort                                                                                                                152                           129

                                           Emissions Reduction Plan
                                                                        Legislated / Developing                                                                                      -2.6%           154           -3.2%           136
                                                                        + Announced (less stringent)                                                                                 -2.7%           154           -3.5%           133
                                                                        + Announced (more stringent)                                                                                 -2.8%           152           -4.1%           129

                                                          Does not meet lower CAGR                Meets lower CAGR, but not median                                                    Meets or exceeds median CAGR

Independent Assessment: 2030 Emissions Reduction Plan                                                                                                                                                                                     19
4.7 AGRICULTURE, WASTE, AND OTHER
                                  The big emissions reduction driver for this group of sectors is the federal fuel
                                  charge, although some agricultural on-farm fuel uses are exempt from the
                                  charge. Still, this group of sectors includes a large segment of the total
                                  economy, including light manufacturing, and therefore the fuel charge is
                                  material to emissions reductions. Waste methane capture is also a big
                                  emissions driver here.

                                  The sector is well positioned to exceed the emissions reductions required to
                                  be on a net zero pathway to the 2030 milestone and beyond. In our modelling,
                                  a waste methane regulation is an important contributor to the Plan. Land use
                                  emissions reductions f rom nature-based solutions would be above and
                                  beyond the emissions reductions presented in this section.

                                                               2020   2025         2030     2035        2040         2045           2050                                                           2019-2026           2026-2030
                                                        140                                                                             140.0
Figure 8                                                                                                                                                                                                   NZ                  NZ
                                                                                                                                                                                              ERP       Pathway      ERP    Pathway

Pathway for
                                                        12 0                          108                                               120.0
                                                                                            105                                                                                   0.0%                                                   0%

                                                                                                                                                Annual Emissions Change (CAGR%)
                                  Emissions (MtCO2 e)

                                                        100

agriculture, waste,
                                                                                                                                        100.0                                                                                   -0.5%
                                                                             104                                                                                                  -0.5%                                                  -1%

                                                         80                                                                             80.0

and other sectors’
                                                                                                                                                                                  -1.0%                  -1.1%                           -1%
                                                                                                                                                                                              -1.4%                             -1.1%
                                                         60             65-71                                                           60.0

emissions under
                                                                                                                                                                                  -1.5%       -1.3%                                      -2%
                                                                                                                                                                                                                    -1.8%
                                                                                                   Safe bets                                                                                             -1.6%
                                                         40                                        Wild cards                           40.0
                                                                                                                                                                                  -2 .0%                                                 -2%

the 2030 ERP
                                                                                                   Low oil price
                                                                                                   Equal share target                                                                                               -2.1%
                                                         20                                        Legislated / Developing              20.0
                                                                                                   + Announced ( less stri ngent)                                                 -2 .5%                                                 -3%
                                                                                                   + Announced ( more stri ngent)
                                                          0                                                                             0.0
                                                           2020       2025         2030     2035        2040        2045            2050

                                                                                                                  Historical                                                                                   Projection
                                                                                                                                                                                          2026 Objective                 2030 Milestone
                                                                                               2005-2019             2005               2019                                          2019-2026      2026            2026-2030      2030
                                                                                                 CAGR               MtCO2 e            MtCO2 e                                          CAGR       MtCO2 e             CAGR        MtCO2 e
                                           Net Zero Pathway
                                                                        Lower effort                                                                                                       -1.1%                       -0.5%
                                           Annual change                Median                      0.4%                                                                                   -1.4%                       -1.0%
                                                                        Higher effort                                                                                                      -1.6%                       -1.1%
                                                                        Lower effort                                                                                                                      115                           113
                                           Emissions                    Median                                        118                  124                                                            112                           108
                                                                        Higher effort                                                                                                                     111                           106

                                           Emissions Reduction Plan
                                                                        Legislated / Developing                                                                                            -1.3%          113           -1.1%           108
                                                                        + Announced (less stringent)                                                                                       -1.4%          112           -1.8%           105
                                                                        + Announced (more stringent)                                                                                       -1.3%          113           -2.1%           104

                                                          Does not meet lower CAGR                   Meets lower CAGR, but not median                                                       Meets or exceeds median CAGR

Independent Assessment: 2030 Emissions Reduction Plan                                                                                                                                                                                          20
CONCLUSIONS
AND RECOMMENDATIONS
                                  Based on both our quantitative and qualitative analysis of the 2030 Emissions
                                  Reduction Plan, five key conclusions emerge:

                                  1.   The Plan provides a credible pathway to the 2030 milestone—and the
                                       policies required to achieve it. Our independent modelling confirms
                                       that the included policies could, if enacted expediently, put Canada in
                                       a position to achieve deep emissions reductions by 2030, addressing
                                       all sectors and all major sources of emissions across the economy. The
                                       government’s focus must now shift to implementation.

                                  2. This is the most transparent climate plan the federal government
                                     has ever produced. It provides details on Environment and Climate
                                     Change Canada’s modelling analysis and assumptions, increasing the
                                     credibility of the 2030 Plan. It also provides details about the modelling
                                     projections, which will support the ability of the country to track progress
                                     and adjust policies, when necessary, in the future. The 2030 Plan is part
                                     of a process under the Canadian Net-Zero Emissions Accountability Act,
                                     and transparent analysis is critical for accountability.

                                  3. The Plan’s extensive sector-level detail provides a foundation for
                                     developing sector-level policy strategies. The plan provides sector-level
                                     detail both with respect to analysis and to policy design. Over time, tracking
                                     this information for individual sectors will highlight how well policies are
                                     working and which sources of emissions remain challenging or persistent.
                                     This will set the stage for adjusting sector strategies in future years. At the
                                     same time, sector-level analysis will help establish clear expectations about
                                     the contributions each sector will make towards achieving the national
                                     milestones, creating more certainty for businesses and investors.

                                  4. The sheer number of policies included in the 2030 Plan is double-
                                     edged. Interactions among overlapping policies can sometimes impair
                                     performance. More policies do not necessarily drive additional emissions
                                     reductions. Overlapping policies can also increase costs. And subsidies
                                     that rely on public spending can often reward firms and households for

Independent Assessment: 2030 Emissions Reduction Plan                                                              21
taking actions they would have taken even absent the policy, especially
                                      where regulatory and carbon pricing policies apply to the same emissions.
                                      These risks should be carefully monitored over time, and policies adjusted
                                      as required.

                                  5. Implementation remains the biggest challenge moving forward. The
                                     2030 Plan lays out a policy package that can achieve Canada’s emissions
                                     milestones and set the country on a path to net zero—but only if those
                                     policies are enacted effectively and expediently. Ultimately, Canada’s
                                     success in achieving its emissions milestones will depend not on the
                                     credibility of planned policies or modelled outcomes but on the policies
                                     that are actually implemented. And given the number of policies still to
                                     be executed and the very short time left until 2030 to deploy significant
                                      levels of technology and investment, delays represent a serious risk.

Independent Assessment: 2030 Emissions Reduction Plan                                                          22
To support the successful implementation of effective climate policy in
                                  Canada, we make the following recommendations:

                                    1. The federal government should continue to
                                       transparently demonstrate progress on policy
                                       implementation and track results on performance over
                                       time. Ongoing monitoring and assessment can ensure the
                                       Plan performs as a coherent package of policies, allowing
                                       for updates and course corrections over time. That may
                                       require occasionally phasing out extraneous policies or
                                       adjusting existing policies rather than adding new ones.

                                    2. T h e f e d e r a l g o v e r n m e n t s h o u l d m a n a g e
                                       implementation risks by focusing its attention on the
                                       most critical policies. Canada has a limited window to
                                       execute policies to achieve the 2030 milestone. It cannot
                                       become mired in consultation and process for multiple
                                       policy endeavours. As a result, it should prioritize five
                                       specific policies that can deliver the bulk of material
                                       emissions reductions:

                                         a. Establish the carbon price schedule to 2030, and
                                            further strengthen and nationally align the benchmarks
                                            in the large emitter programs.
                                         b. Establish the oil and gas cap, paying close attention to
                                            the need for compliance flexibility, policy interactions
                                            with the large emitter carbon pricing programs,
                                            methane regulations, and the proposed CCUS tax credit.
                                         c. Develop the Clean Electricity Standard, and ensure it
                                            interacts effectively with large emitter carbon pricing.
                                         d. Update the Clean Fuel Standard and publish the
                                            regulation to the Canada Gazette as soon as possible.
                                         e. Set in motion land-use emissions reduction policies
                                            as quickly as possible.

Independent Assessment: 2030 Emissions Reduction Plan                                                    23
Overall, the 2030 Emissions Reduction Plan provides a clear step forward for
                                 Canada. It demonstrates a credible path to delivering deep emissions
                                 reductions, which come close to the 2030 target. And by transparently
                                 acknowledging the remaining small gap, it also highlights additional work
                                 required to close it. The Institute looks forward to assessing future plans as
                                 well as amendments and updates to the 2030 Plan.

                                 Canada finally has a comprehensive and detailed action plan to reduce emissions
                                 on the path to net zero. Now it must put it into effect as soon as possible.

Independent Assessment: 2030 Emissions Reduction Plan                                                           24
ACKNOWLEDGMENTS
                    AUTHORS       Dave Sawyer, Principal Economist, Canadian Climate Institute

                                  Bradford Griffin, Executive Director, Canadian Energy and Emissions Data Centre at Simon
                                  Fraser University

                                  Dale Beugin, Vice President Research and Analysis, Canadian Climate Institute

                                  Franziska Förg, Analyst, Navius Research

                                  Rick Smith, President, Canadian Climate Institute

              EXPERT PANEL        Louis Beaumier, Executive Director of the Institut de l’énergie Trottier at Polytechnique
                                  Montréal
       The authors thank the
   following members of the Kathryn Harrison, Professor of Political Science at the University of British Columbia
 Canadian Climate Institute’s Mark Jaccard, Director and Distinguished Professor with the School of Resource and
     Mitigation Expert Panel: Environmental Management at Simon Fraser University

                                  David Layzell, Director of the Canadian Energy Systems Analysis Research (CESAR) Initiative at
                                  the University of Calgary and a Research Director for the Transition Accelerator

                                  Juan Moreno-Cruz, Associate Professor at the School of Environment, Enterprise, and
                                  Development and the Canada Research Chair in Energy Transitions at the University of
                                  Waterloo

                                  Nancy Olewiler, Director of the School of Public Policy, Simon Fraser University

                                  Nicholas Rivers, Canada Research Chair in Climate and Energy Policy at the University of
                                  Ottawa

                                  Jennifer Winter, Associate Professor, Department of Economics and Scientific Director,
                                  Energy and Environmental Policy Research Division, School of Public Policy, University of
                                  Calgary

                                  The content of this report, including any errors, is solely attributable to the Institute.

    SUGGESTED CITATION            Sawyer, Dave, Dale Beugin, Bradford Griffin, Franziska Förg, and Rick Smith. 2022.
                                  Independent assessment: 2030 Emissions Reduction Plan. Canadian Climate Institute.

Independent Assessment: 2030 Emissions Reduction Plan                                                                              25
You can also read