Gaia THE BILLION STAR SURVEYOR GAIA DATA RELEASE 2
←
→
Page content transcription
If your browser does not render page correctly, please read the page content below
gaia
  → THE BILLION STAR SURVEYOR
    GAIA DATA RELEASE 2
  Media kit

                                             1
www.esa.int              European Space Agency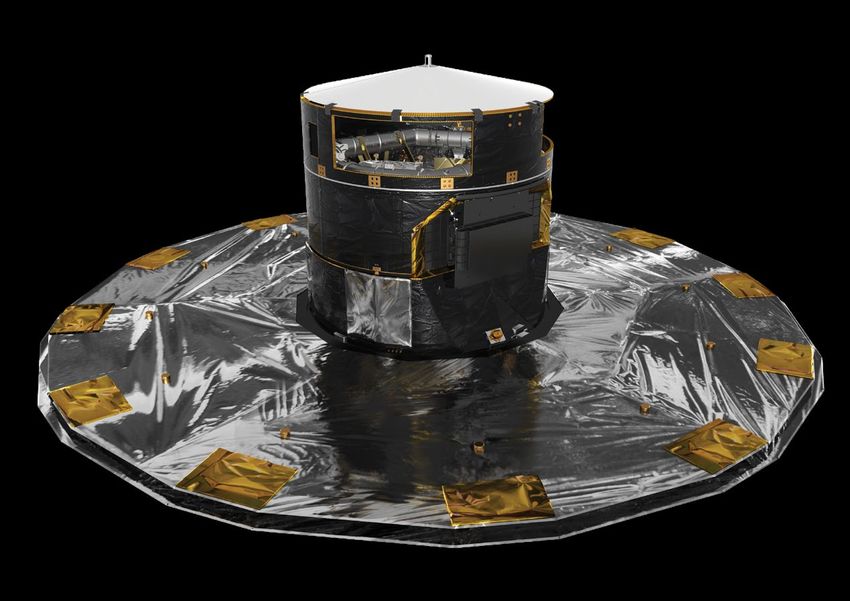
Produced by:    Joint Communication Office – European Space Agency

Written and edited by:   Claudia Mignone (ATG Europe for ESA), Stuart Clark & Emily
                         Baldwin (EJR-Quartz for ESA)

              Layout:    Sarah Poletti (ATG Europe for ESA)

                         Based on content from the Gaia Data Release 1 Media Kit,
                         co-authored by Karen O’Flaherty (EJR-Quartz for ESA)

                         This document is available online at:
                         sci.esa.int/gaia-data-release-2-media-kit

                         JCO-2018-001; April 2018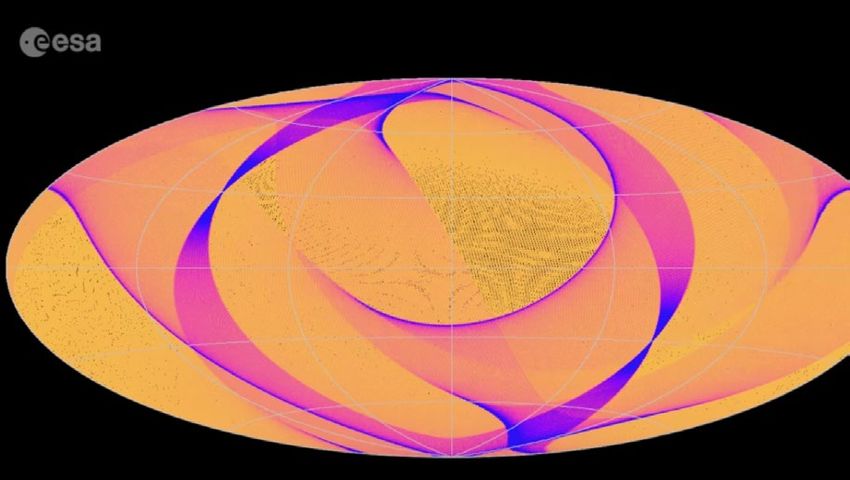
→ TABLE OF CONTENTS

1. Gaia – the billion star surveyor                               03

2. Fast facts                                                     06

3. Mapping the Galaxy with Gaia                                   10

4. Gaia’s second data release – the Galactic census takes shape   14

5. Caveats and future releases                                    17

6. Science with Gaia’s new data                                   20

7. Science highlights from Gaia’s first data release              23

8. Making sense of it all – the role of the
   Gaia Data Processing and Analysis Consortium                   27
9. Where is Gaia and why do we need to know?                      30
10. From ancient star maps to precision astrometry                33

Appendix 1: Resources                                             37
Appendix 2: Information about the press event                     43
Appendix 3: Media contacts                                        46
1
Gaia – the billion star surveyor
→ GAIA – THE BILLION STAR SURVEYOR
Gaia’s mission is to create the most accurate map of the Galaxy to date.
Gaia’s first data release was published on 14 September 2016. It included
the position and brightness for 1100 million (1.1 billion) stars, but distances
and motions for just the brightest two million stars. Now Gaia’s second data
release is ready, opening a new era for astronomy. It provides sky positions
and brightnesses for nearly 1.7 billion stars, distances, motions and colour
information for 1.3 billion, and a number of additional parameters for smaller
subsets of stars and other celestial objects.
Gaia is observing more than a billion stars, roughly one per cent of the total
stellar content of our galaxy, the Milky Way. Eventually, this detailed inventory
will include the positions and motions of stars to unprecedented precision,
as well as the brightness and colour of each of them. In the process of
discovering more about the Milky Way, Gaia observes celestial objects near
and far, from our Solar System to extragalactic sources such as quasars. It
will also detect new asteroids in our Solar System, discover planets around
other stars, and even provide some tests of Einstein’s theory of general relativity.
When we gaze up at stars in the night sky, we see them projected
against the celestial tapestry. These stars appear equally far from us, and
motionless with respect to one another. In reality, stars are located at a
huge variety of distances from us, and each of them traces its own path
around the centre of the Milky Way.
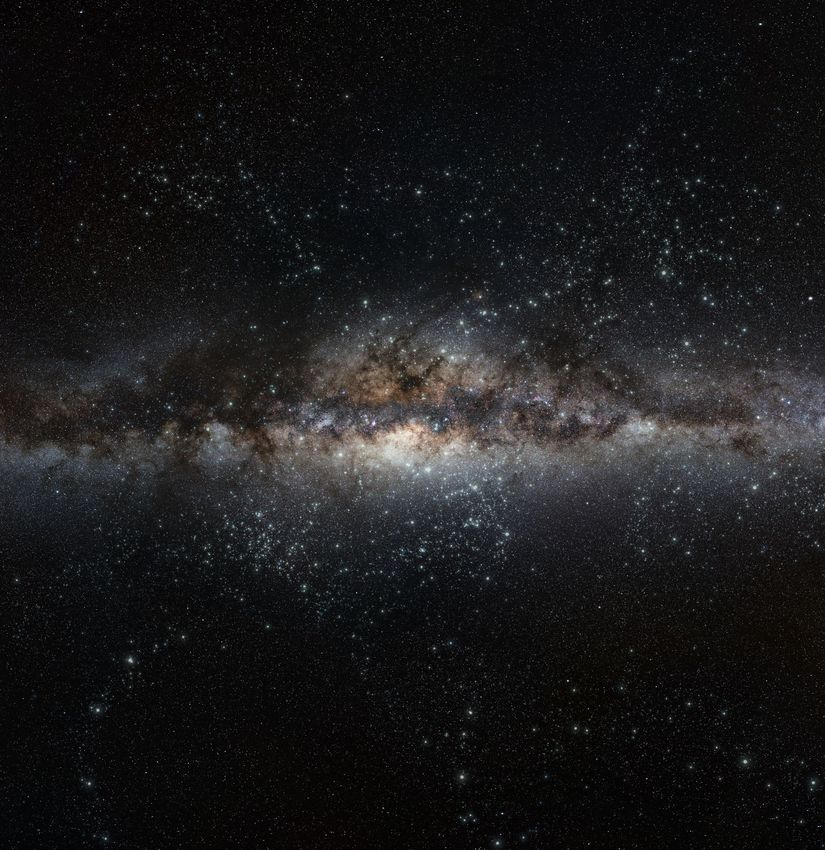
There are an estimated one or two hundred billion galaxies in the Universe,
of various sizes and shapes. The Milky Way is a barred spiral galaxy, about
13 billion years old, and home to a few hundred billion stars, including our
local star, the Sun.
The Milky Way’s structure can be described as a flattened disc where the
majority of stars are located, interspersed with a diffuse mixture of gas and
cosmic dust, and a central bulge, where some of the Galaxy’s oldest stars
can be found. The Galactic Disc is about 100 000 light–years across, and
3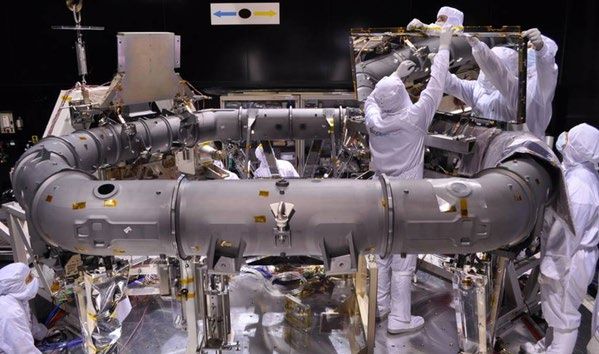
the Sun is located about half way between the centre and periphery.

Beyond the disc and bulge is the stellar halo, a roughly spherical structure
with a radius of about 100 000 light-years, containing isolated stars as well
as many globular clusters – large, compact conglomerations of some of the
most ancient stars in the Galaxy. On a grander scale, the Milky Way is
embedded in an even larger halo of invisible dark matter. The Milky Way is
part of the Local Group, together with the Andromeda galaxy, the nearest
large galaxy to ours, and about 60 smaller galaxies.

Catalogues of stellar positions based on ground-based observations are
limited in precision by the turbulence of Earth’s atmosphere. Another
limitation is that they cannot access the entire sky with a single telescope.

ESA’s Hipparcos satellite, the first space mission dedicated to charting the
sky, yielded a greatly improved catalogue with nearly 120 000 stars. Gaia
has been extending this effort by cataloguing 10 000 times more stars and
other celestial objects, while measuring additional parameters for each of
these, too. With these data, astronomers will be able to investigate in
extraordinary detail the past history, current status, and future evolution of
our home galaxy.

                                     4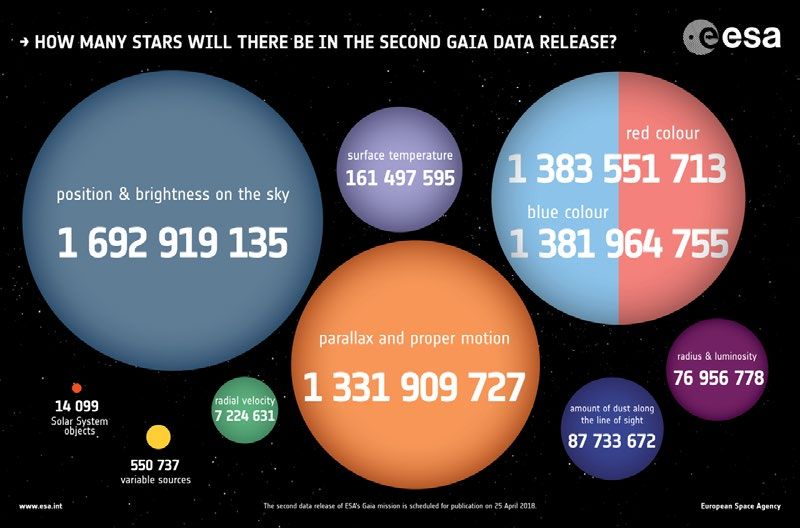
2
Fast facts
→ FAST FACTS

 Launch: 19 December 2013 at 09:12 UTC on a Soyuz rocket from Europe’s
 spaceport in Kourou, French Guiana.

 Launch mass: 2030 kg, including 710 kg of payload, a 920 kg service
 module, and 400 kg of propellant.

 Spacecraft dimensions: The spacecraft body (payload and service module)
 is 4.3 m wide and 2.3 m high; the spacecraft is 10 m across when the
 sunshield/solar array assembly is deployed.

 Payload: The payload comprises two identical optical telescopes/imaging
 systems, a radial velocity spectrometer, and blue and red photometers. The
 payload features a focal plane array (0.5 m x 1 m) with 106 CCD detectors
 containing nearly 1 billion pixels, making it the largest digital camera ever
 used in space.

 Orbit: Gaia circles the Sun in a Lissajous-type orbit at the L2 Lagrangian
 point, 1.5 million km from Earth in the opposite direction with respect to the
 Sun.

 Mission duration: Gaia was originally planned for a five-year nominal
 mission. ESA has already approved an indicative extension until the end of
 2020, which is up for confirmation at the end of 2018.

 Ground communications: ESA’s ESTRACK stations at Cebreros (Spain), New
 Norcia (Australia), and Malargüe (Argentina) are used to communicate with
 the spacecraft.

 Mission Operations: The mission is controlled from the European Space
 Operations Centre (ESOC) in Darmstadt, Germany. Science operations are
 conducted from the European Space Astronomy Centre (ESAC) in Villafranca
 del Castillo, Spain.

                                      6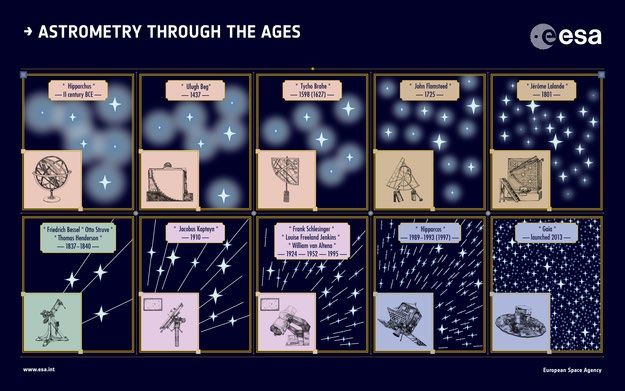
Data Processing and Analysis Consortium: The Gaia Data Processing
and Analysis Consortium (DPAC) is formed by about 450 scientists and
software experts, who have been entrusted with the task of converting
the telemetry data into scientifically meaningful information and preparing
the data releases, including the final Gaia Catalogue. Members of the DPAC
come from twenty European countries (Austria, Belgium, Czech Republic,
Denmark, Estonia, Finland, France, Germany, Greece, Hungary, Ireland, Italy,
Netherlands, Poland, Portugal, Slovenia, Spain, Switzerland, Sweden, and the
United Kingdom) as well as from further afield (Algeria, Brazil, Israel, and
the United States). In addition, ESA makes a significant contribution to DPAC
in the form of the Data Processing Centre at the European Space Astronomy
Centre (ESAC) in Spain, which amongst other tasks and responsibilities, acts
as the central hub for all Gaia data processing.

Industrial contributions: Gaia was designed and built by Astrium (now
Airbus Defence and Space), with a core team composed of Astrium France,
Germany and UK. The industrial team included 50 companies from 15
European states, along with firms from the US. Some 80 contracts were
placed with European companies and three with those in the US. The
spacecraft was launched by Arianespace on a Soyuz-ST-B Fregat-MT
rocket. Between 2500 and 3000 people in all have been involved in the
manufacturing of the spacecraft.

Mission name: Gaia was the acronym for Global Astrometric Interferometer for
Astrophysics, the original name of the mission. This reflected the technique of
optical interferometry that was first studied for use on the spacecraft. Although
the acronym (written GAIA) is no longer applicable, the name (Gaia) remains to
provide project continuity.

FIRST DATA RELEASE:

Date: 14 September 2016
Data time span: 14 months of observations
Contents:
      • Celestial positions and Gaia ‘G’ magnitudes for 1.1 billion stars
        using only Gaia data;
      • Positions, parallaxes (distances) and proper motions for more than
        two million stars using the Tycho–Gaia Astrometric Solution (TGAS);
      • Light curves and characteristics for about 3000 variable stars;
      • Positions and ‘G’ magnitudes for more than 2000 quasars –
        extragalactic sources used to define the celestial reference frame.

                                      7
SECOND DATA RELEASE:

Date: 25 April 2018
Data time span: 22 months of observations
Contents:
      • Celestial positions and Gaia ‘G’ magnitudes for nearly 1.7 billion stars;
      • Parallaxes (distances), proper motions and BP/RP (blue/red photometer)
        colours for more than 1.3 billion stars;
      • Radial velocities for more than seven million stars;
      • Astrophysical parameters such as surface temperature (161 million
        stars), extinction and reddening (a measure of the amount of dust
        along the line of sight to a star; 87 million stars), radius and
        luminosity (76 million stars);
      • Light curves and classification for about 0.5 million variable stars;
      • Positions and epoch of observation of 14 099 known Solar System
        objects – mainly asteroids – based on more than 1.5 million observations.
      • Positions and ‘G’ magnitudes for more than 0.5 million quasars –
        which allows the celestial reference frame to be fully defined for the
        first time using optical observations of extragalactic sources.

Access: All data are available from the ESA Gaia Archive, which also
provides visualisation tools, pre-computed cross-matches with other large
catalogues, as well as comprehensive documentation to explore the data
sets: http://archives.esac.esa.int/gaia

Data can also be accessed from the partner data centres:
- Centre de Données astronomiques de Strasbourg (CDS):
http://cdsweb.u-strasbg.fr/gaia
- ASI Space Science Data Center (SSDC): http://gaiaportal.asdc.asi.it
- Astronomisches Rechen-Institut (ARI): http://gaia.ari.uni-heidelberg.de
- Leibniz-Institut für Astrophysik Potsdam (AIP): http://gaia.aip.de

                                      8
3 Mapping the Galaxy with Gaia
→ MAPPING THE GALAXY WITH GAIA
The extraordinary data collected by Gaia throughout its mission will be used
to eventually build the most accurate three-dimensional map of the positions,
motions, and chemical composition of stars in our Galaxy. By reconstructing
the properties and past trajectories of all the stars probed by Gaia, astronomers
will be able to delve deep into the history of our Galaxy’s formation and
evolution.
The field of astronomy that deals with measuring the positions of celestial
bodies in the sky is known as astrometry. Over the course of many centuries
astronomers have relied on astrometry to compile ever more detailed maps
of the heavens. By monitoring how the positions of stars and other astronomical
objects vary over time, it is possible to infer their distances from us and their
motions through space. Both of these are essential for investigating the
physical nature of these distant bodies.
Tiny changes in the position of stars contain information about their distance
– this is encoded in the parallax, an apparent annual shift of stars on the sky
caused by Earth’s yearly motion around the Sun. Over time, stellar positions
also slowly change due to the stars’ real movement through the Galaxy. The
parallax of a star is the size of the ellipse it traces on the sky on a yearly
basis. The distance to a star is inversely proportional to its parallax.
The associated motion perceived across the plane of the sky is termed the
proper motion. Proper motion provides two of the three components of a
star’s velocity through the Galaxy; the third component – the radial velocity
– can be inferred from the red- or blue- shift of the light in its spectrum.
Inside Gaia
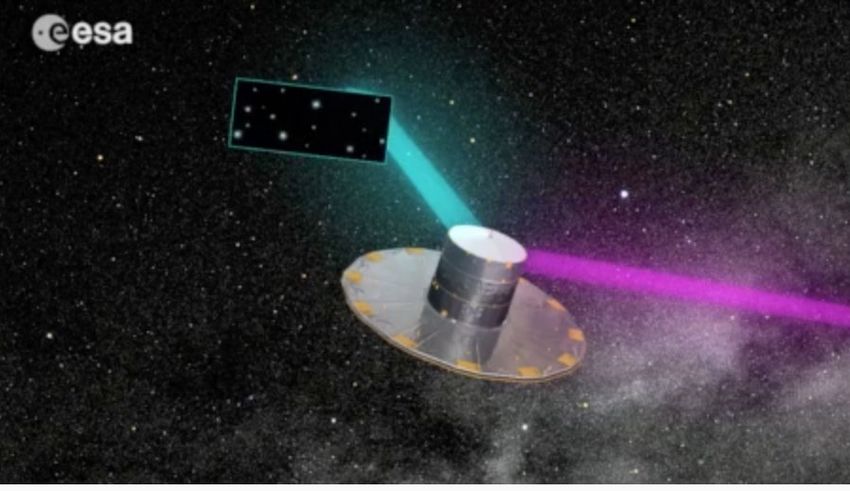
Gaia has been performing its unique census of stars in the Galaxy using the
billion-pixel camera at its heart, which collects the light focused by the
satellite’s dual telescope system. As the satellite spins, the two telescopes
scan great circles on the sky. They feed three instruments: one for astrometry
(to determine the positions and motions), one for photometry (to measure the
colours of the stars), and one for spectroscopy (to measure their radial velocity
and see what materials the stars are made of).
10The astrometric instrument is the core element in the focal plane, providing
input to determine the position of stars and other astronomical sources
to unprecedented precision; in turn, the positions are used to derive
stellar parallaxes and proper motions. This instrument also measures the
brightness of all stars in the Gaia G-band, using a bandpass that covers the
visible portion of the spectrum, between 330 and 1050 nm. This band was
chosen to optimise the collection of starlight, which in turn maximises the
precision of the measurements. It also matches the overall sensitivity of
the Gaia astrometric instrument thus providing a measure of the brightness
as seen by that instrument.
The photometric instrument separates the light from the stars into their
constituent colours and does this over a short (blue; 330–680 nm) and long
(red; 630–1050 nm) wavelength range. These measurements will in turn
be used to determine the colour of each star – the portion of the spectrum
where it emits most of its light – which is key to determine its temperature,
age, and other properties.
Finally, the radial velocity spectrometer provides spectra for a subset
containing the brightest 150 million stars observed by Gaia. These spectra
are used to estimate the radial velocity of stars – their velocity along the
line of sight with respect to Gaia. Radial velocities complement proper
motions and in combination deliver three-dimensional velocities.
For each celestial object, all the information recorded by the instruments is
compressed into data packets and stored on board. The data packets are
transmitted to ESA’s ground stations in Spain, Australia, and Argentina, and
are then processed by the Data Processing and Analysis Consortium (DPAC),
who are responsible for turning them into scientifically useful data.
At the core of this process is a mathematical procedure called AGIS – the
Astrometric Global Iterative Solution. Put simply, this is the way to collate
the billions of pieces of information that come from the satellite and convert
these into the Gaia map of the Galaxy. It can be thought of like a giant
jigsaw puzzle with hundreds of billions of pieces that have to be combined
very accurately before the complete picture emerges.
The assembly of this gigantic picture is a complex process that needs to
be performed over a number of years in order to reach Gaia’s expected
measurement goal: an accuracy of 0.00002 arcsecond in the parallax
11measurement for a magnitude 15 star. (An arcsecond is 1/3600 of a
degree; a magnitude 15 star is about four million times fainter than Sirius,
the brightest star in the night sky.)
In practice, Gaia’s focal plane tracks the position where light from each star
falls as it passes across the CCD detectors and records the time of each
transit. To transform this information into astronomically useful quantities,
namely measurements of stellar positions on the sky, scientists need to
know where Gaia was pointing at each time, as well as its position with
respect to the Sun and other planets in the Solar System. In addition, they
also need to take into account the light bending caused by the Sun and the
major planets as well as the exact position of each element in Gaia’s optical
system and focal plane.
The AGIS procedure consists of combining all these elements together: an
astrometric model for the stars, the orientation of the satellite as a function
of time and the geometry of the focal plane and optics. The goal is to
determine the many millions of unknown parameters of the models by
seeking the best possible match between model predictions and the actual
input from observations. This process is carried out in an iterative fashion,
by repeatedly adjusting the parameters in small steps until the best possible
solution has been found. Not all stars observed by Gaia need to be considered
in this first step of the process, but only a subset. In the second data release,
16 million stars were used for this phase, whereas only two million were used
in the first data release – those in common with the earlier Hipparcos and
Tycho-2 catalogues. Then, the astrometric parameters for the majority of the
remaining stars can then be computed via a simpler procedure.
The AGIS procedure does not take into account all possible parameters that
are relevant for an accurate modelling of the observations. This includes, for
example, the colour of a star as measured by the photometric instrument,
which influences slightly the position of the image of the star in the focal
plane. A full consideration of all relevant effects involves a series of additional
steps, and extra iterations between these and AGIS. This will be included in
subsequent data releases, as well as the addition of increasingly larger amounts
of observations.
124 Gaia’s second data release — the Galactic census takes shape
→ GAIA’S SECOND DATA RELEASE
  THE GALACTIC CENSUS TAKES SHAPE

 For the field of astrometry – the discipline of measuring the positions of celestial
 objects – a new era is here. The data bounty that awaits us will be revealed on
 25 April 2018, when ESA’s Gaia mission publishes the second data release. It is
 based on observations taken by the satellite between 25 July 2014 and 23 May
 2016.

 This second public release of data is the first one that relies solely on Gaia
 measurements, and will be an extraordinary resource for astronomers. It
 includes the positions on the sky for approximately 1.7 billion stars, as well as
 a measure of their overall brightness at optical wavelengths.

 Parallaxes (a measure of the distance) and proper motions (the motion of
 objects across the plane of the sky) are provided for 1.3 billion stars. This is
 a huge leap forward with respect to the two million parallaxes and proper
 motions of the first data release.

 This unprecedented data release also contains four new elements: broad-band
 colour information in the form of brightness measurements in ‘red’ and ‘blue’
 light for more than 1.3 billion stars; radial velocities for some seven million
 stars; for between 77 and 161 million stars estimates are provided of the
 stellar effective temperature, extinction and reddening (which quantify the
 amount of dust along the line of sight to a star), radius and luminosity; and
 the positions of 14 099 known Solar System objects – mainly asteroids.

 Measurements of how the brightness and colour of about half a million variable
 stars change over time are also made public. This is one of the largest available
 catalogues of variable stars and the largest ever compiled scanning the entire sky.

 Finally, the positions and brightness for more than 0.5 million quasars are
 published; these extragalactic objects are used to define a reference frame
 in which the celestial coordinates of all objects in the Gaia catalogue are
 expressed in. Conventionally, this is done at radio wavelengths but with Gaia’s
 second data release this can now be achieved at optical wavelengths too.

                                        14
This release provides astronomers with a comprehensive set of superb scientific
data that can be used to make significant research progress in a wide range of
space science fields.
From Hipparcos to Gaia
ESA has a rich history of producing stellar catalogues. The Hipparcos Catalogue
was created from data obtained with the science instrument on ESA’s Hipparcos
satellite, the first space mission dedicated to astrometry, which operated from
1989 to 1993. The catalogue, published in 1997, contains the positions and
parallax of more than 100 000 stars with a precision of 0.001 arcseconds, and
proper motions with a precision of 0.001 arcseconds per year. At the time of
publication these values were unprecedented. (One arcsecond is equivalent to
the size of a Euro coin seen from a distance of about four kilometres.)
A few years later, the Tycho-2 Catalogue was produced, based on measurements
from the star mapper on the Hipparcos satellite and on previous ground-based
astrometric catalogues that relied on photographic observations made since the
late nineteenth century. This catalogue is less accurate but much larger than
the Hipparcos Catalogue, listing positions and proper motions of 2.5 million
stars. The average accuracy in the Tycho-2 Catalogue is 0.06 arcseconds for
positions – improving to 0.007 arcseconds for the brightest stars – and 0.0025
arcseconds per year for proper motions.
Two years ago, Gaia’s first release included two million parallaxes and proper
motions, estimated by combining Gaia’s measurements (based on 14 months of
observations) with the earlier Hipparcos and Tycho-2 Catalogues. This resource
was twice as precise and contained almost 20 times as many stars as the
Hipparcos Catalogue.
The second Gaia release greatly exceeds the size and accuracy of the first one,
with parallaxes and proper motions of roughly 650 times as many stars and
about ten times more precise, reaching uncertainties on position and parallax
between 0.00002—0.00004 arcsecond (0.00007 arcsecond per year for proper
motions) for bright stars and 0.002 arcsecond (0.003 arcsecond per year for
proper motions) at the faint end of the surveyed star population.
In future years, there will be more data releases, and the final Gaia catalogue
will be published in the 2020s. This will be the definitive stellar catalogue for the
foreseeable future, playing a central role in many and varied fields of astronomy.
155 Caveats and future data releases
→ CAVEATS AND FUTURE DATA RELEASES

 The second Gaia data release represents a major advance compared to the
 first one. It features new data types and a much expanded and improved
 data set with respect to the first release, which will enable unprecedented
 investigations and discoveries.

 Nevertheless, this release is still intermediate. It is based on approximately
 22 months of input data, and is still affected by some simplifications in the
 data processing, including the application of filters to select the final sample
 of stars and preliminary models used in the calibration, which can introduce
 small (and sometimes systematic) uncertainties in the results. A small number
 of stars in the catalogue are reported to have very large positive or negative
 parallaxes exceeding one arcsecond (for comparison, the parallax of the nearest
 star to the Sun, Proxima Centauri, is 0.77 arcsecond). These spurious values
 are caused by the close alignment of stars that are only resolved by Gaia
 in some observations, depending on the scan direction, and mainly occur in
 the observation of dense stellar fields. Generally, negative parallaxes are an
 unavoidable consequence of measurement uncertainties when observing far
 away objects.

 The limitations of the second data release will gradually decrease in the
 further two releases of Gaia data planned for the coming years – one more
 intermediate release and then the final release of the data gathered in the
 nominal mission. These will be characterised by increasingly improving
 precision and additional parameters for the surveyed stars, as well as for
 other celestial objects – from Solar System bodies to galaxies beyond our
 Milky Way.

 In late 2020, the third data release will bring another big increase in data
 and accuracy. It will consist of improved positions and brightnesses; object
 classifications, astrophysical parameters and spectra; the average velocity
 along the line of sight for a much larger set of stars; classifications for an
 extended set of variable star types. It will also include results for a much
 larger number of Solar System objects, including preliminary orbit calculations.
 Finally, a catalogue of binary and multiple stars will be included.

                                     17
The final Gaia data release, based on data from the five-year mission, is
currently planned for the end of 2022. It will contain full astrometric and
photometric parameters for nearly two billion stars as well as extensive
additional information including a classification of the sources and lists of
variable stars, multiple stellar systems and exoplanet-hosting stars, and
measurements of the radial velocity for more than 150 million stars.
Producing this catalogue is a complicated endeavour that requires
processing and analysing the entire five-year mission dataset. Possible
mission extensions will then generate future data releases after this.
The second Gaia data release is an extraordinary census of our Galaxy that
will redefine the fundamental reference frame used for all astronomical
coordinate systems. Each subsequent release will be increasingly more
powerful and complete, until reaching the greatest catalogue of astronomical
sources that has ever been released. Unearthing Gaia’s discoveries and
unlocking its many secrets will keep astronomers busy for decades.
Special releases
Besides the major data releases, special subsets of Gaia data are being
made public to facilitate timely follow–up observations by the wider
astronomical community. For example, the Science Alerts (http://gsaweb.
ast.cam.ac.uk/alerts) – announcements to the scientific community about
detected transient events such as supernovae and outbursting stars – and
the Gaia Follow-Up Network for Solar System Objects (https://gaiafunsso.
imcce.fr/), a similar resource for newly detected moving objects in the Solar
System, are regularly issued.
In addition, Gaia coordinates for specific sets of stars have been made
public in advance of data releases to support astronomical observations of
rare stellar occultations, for example by dwarf planet Pluto in 2016 and by
minor planet Chariklo and Neptune’s moon Triton in 2017. In the case of
Triton’s occultation, the data were so accurate that the prediction of where
to best observe the event could be refined: this led to the observation of an
elusive ‘central flash’, confirming Gaia’s pre-eminent data quality.
Preliminary stellar positions were also shared with the navigation team of
NASA’s New Horizons mission which, after its famous flyby of Pluto in 2015,
is now heading towards another flyby in the unknown territories of the
Kuiper Belt.
186 Science with Gaia’s new release
→ SCIENCE WITH GAIA’S NEW RELEASE

 The second Gaia data release is a unique resource for astronomers. It is
 based on a homogeneous, high-precision scanning survey of the entire sky
 covering celestial objects near and far, from our Solar System to the stellar
 population of the Milky Way and beyond, and from our neighbouring
 galaxies to distant quasars.

 Not only is it by far the best astrometric catalogue ever compiled to date,
 but it also complements the position, parallax and proper motion
 measurements with photometric and spectroscopic observations that have
 been performed by the same telescope and processed jointly in a consistent
 manner. As such, it offers immense possibilities to researchers interested in
 virtually any field of astronomy.

 Astronomers worldwide are eagerly waiting for the release: some are after
 the precise distance and motion of one particular star, others will look for
 particular types of stars scattered across the sky or will focus their interest
 in one or more special regions of our Galaxy. There will be studies of stellar
 clusters, star-forming regions, and even of the invisible dark matter that
 underlies the distribution of stars.

 It will be possible to investigate the motion and evolution of stars in
 regions of the Milky Way that could not be explored in such detail until
 now. Looking at the Sun’s neighbourhood with Gaia’s unprecedented
 accuracy might also reveal unexpected surprises.

 Closer to home, the positions of Solar System objects will enable in-depth
 studies of asteroids and, jointly with Gaia’s improved position and motion
 determinations of stars, support the prediction and observation of asteroids
 passing in front of distant stars in the future. The data will also be used for
 space navigation in the next generation of star trackers.

 These are only examples of the impact that the second Gaia data release
 will have on selected areas of astronomy and space science. As with many
 surveys and experiments of the past, some of the most exciting discoveries

                                     20
will be the unexpected ones.
While the real science harvest of Gaia will only come once the data are
made public, a series of scientific papers with preliminary investigations
will be published alongside the release of the data. These studies have
been conducted in order to validate the quality of the new data set and
demonstrate the great potential of Gaia.
The subjects covered in these papers are:
• the new celestial reference frame based on Gaia’s observations of
more than half a million quasars
• the Hertzsprung-Russell diagram, which is a fundamental tool for
astronomers to study stellar populations, their composition
and evolution
• an analysis of the sample of Solar System objects included in
the release – most of which are main-belt asteroids
• stellar velocities in the Galactic Disc
• the motions of globular clusters and dwarf galaxies around
the Milky Way
• the properties of variable stars observed by Gaia
217 Science highlights from Gaia’s first data release
→ SCIENCE HIGHLIGHTS
  FROM GAIA’S FIRST DATA RELEASE

 ESA’s Gaia mission published its first data release on 14 September 2016.
 It was based on observations taken by the satellite between 25 July 2014
 and 16 September 2015. This first public release of data included the
 positions on the sky and brightness for more than one billion stars, as
 well as parallaxes and proper motions for a subset of two million based
 on the combination of Gaia data with the earlier Hipparcos and Tycho-2
 catalogues.

 One of the purposes of this first release was to prove that the observing
 strategy and the data processing ‘pipeline’ are working well. It demonstrated
 the high quality of the scientific data derived from the raw satellite observations
 and allowed some preliminary scientific investigations to take place.

 Hundreds of scientific publications have appeared in the year and a half
 following the release. Some of the world class science results are
 summarised below:

 Large Magellanic Cloud rotation
 Within 24 hours of the release, Roeland van der Marel and Johannes
 Sahlmann reconstructed the rotation of a nearby galaxy, the Large Magellanic
 Cloud, from the proper motion of 29 of its stars.
 Scientific paper: http://dx.doi.org/10.3847/2041-8205/832/2/L23

 Galactic halo
 Amina Helmi et al. published a study titled “A box full of chocolates” in
 which they revealed the rich structure of the Galaxy’s stellar halo. The halo
 is the cloud of stars that surrounds the main disc of the Milky Way: its
 structure reveals the formation processes of the Galaxy. The investigation of
 this structure was one of the prime motivations for building Gaia in the first
 place. An immediate surprise was the discovery of a population of stars
 that orbit the Milky Way in the opposite direction to most stars. These
 stars probably came from a smaller galaxy that fell into the Milky Way.
 Scientific paper: http://dx.doi.org/10.1051/0004-6361/201629990

                                       23
New star cluster
Sergey E. Koposov et al. discovered a galactic star cluster that had been
previously hidden from view because it was located near the bright star
Sirius. From ground-based telescopes, the glare from Sirius outshone the
light from the cluster.
Scientific paper: https://doi.org/10.1093/mnras/stx1182
Galaxy time machine
By combining the Gaia data with older sky surveys, Martin Altmann et
al. have been able to derive the movements through space of 583 million
stars, thus allowing us to project their orbits forwards and backwards in
time. This allows preditcions of what the Galaxy looked like in the past, and
what it will look like in the future. Of course, Gaia’s second data release will
greatly improve these proper motion estimates.
Scientific paper: http://dx.doi.org/10.1051/0004-6361/201730393
Bridging the gap
There were also some unexpected creative uses of the data. For example,
by looking at the estimated errors in the brightness measurements, Vasily
Belokurov et al. mapped out which Gaia sources were variable stars.
Variable stars change their brightness by large amounts and these variations
showed up in the Gaia data as measurement errors of the average
brightness. By doing so, the astronomers revealed a bridge of variable stars
between the Large and the Small Magellanic Clouds, two satellite galaxies
of the Milky Way, showing that these systems are not completely separate.
Scientific paper: http://dx.doi.org/10.1093/mnras/stw3357
Speeding stars
The sheer size of Gaia’s catalogue poses “big data” challenges for scientists
who have to comb through the vast amounts of data in search of the proverbial
needle in the Galactic haystack. Tommaso Marchetti et al. pioneered the use of
machine learning to look for stars on high-speed trajectories from the centre of
our Galaxy to its outskirts.
Scientific paper: https://doi.org/10.1093/mnras/stx1304
Searching for dark matter
Davide Massari et al. pushed their study beyond the visible stars, combining
the data from Gaia’s first data release with earlier observations from the
NASA/ESA Hubble Space Telescope to investigate the distribution of dark
matter in the nearby Sculptor dwarf galaxy.
Scientific paper: https://doi.org/10.1038/s41550-017-0322-y
24More treasures
Other results showed previously undiscovered white dwarf stars, a map of
the local interstellar medium in three dimensions, an inventory of the stars
that had recently made (or will soon make) close encounters with the Sun,
hints of fine structure in the evolution and movement of nearby stars, and
powered searches for distant quasars whose light has been gravitationally
lensed by foreground galaxies.
All of these topics and more are a teaser for the avalanche of discoveries
and results expected following the second data release.
258
Making sense of it all – the role of
the Gaia Data Processing and Analysis Consortium→ MAKING SENSE OF IT ALL – THE ROLE OF THE
GAIA DATA PROCESSING AND ANALYSIS CONSORTIUM
During the course of the nominal five-year mission, Gaia sweeps its gaze
across the sky producing a continuous stream of data that is unintelligible in
its raw format to the scientists who want to use it. The task of converting
the raw data into scientifically useful products is entrusted to the 450
scientists and software experts who form the Gaia Data Processing and
Analysis Consortium (DPAC).
The transformation of the raw measurements takes place within the DPAC
Coordination Units, or CUs. Each unit is responsible for developing the
scientific algorithms and software corresponding to particular, well-defined
aspects of the data processing and analysis.
Two units provide development support for technical aspects such as
defining the software architecture and strategy (CU1), and for the data
simulations (CU2) that have been essential for preparing for the real mission data
by allowing DPAC to test their software and rehearse the science operations.
Three units are responsible for basic data processing. The CU3 unit takes
care of processing astrometric data, which provides the positions and
motions of celestial bodies in the sky. Photometric data processing, which
results in a measure of how much light is emitted by the objects, is the task
of CU5. The spectroscopic data processing, carried out by CU6, produces a
measure of the velocity with which an object is moving towards or away
from us, and what the star is made of.
Three units examine particular aspects of the processed data, looking at Solar
System objects, double stars, orbital binaries, exoplanets, and extragalactic
objects (CU4); variable stars (CU7); and classification and astrophysical
characterisation of all of the celestial objects observed by Gaia (CU8).
One unit (CU9) is responsible for the preparation, validation and distribution
of the intermediate data releases and the final Gaia catalogue.
The software developed by each of the CUs is run in one of the six data
27processing centres located in France (Toulouse), Italy (Torino), Spain (ESAC,
near Madrid; Barcelona), Switzerland (Geneva), and the United Kingdom
(Cambridge). These centres host the computing hardware and provide
software engineering expertise to support the CU software development
work.
The DPAC is funded through national funding agencies of the participating
ESA member states. Some funding agencies have signed a multilateral
agreement with ESA that commits all parties to fund the DPAC effort up to
the completion of the final Gaia catalogue, expected in the 2020s. In addition,
ESA makes a significant contribution to DPAC in the form of the Data Processing
Centre at the European Space Astronomy Centre (ESAC) in Spain, which amongst
other tasks and responsibilities, acts as the central hub for all Gaia data processing.
The final Gaia catalogue, to be produced by DPAC and ESA, will contain
positions, distances, and motions for more than one billion celestial objects.
For each of these objects Gaia will tell us the temperature, where it is in
its lifecycle, the composition, and how much dust lies between us and that
object. There will be stars from every phase of the stellar lifecycle, as well
as asteroids in our Solar System and planets around other stars. There will
also be objects located beyond the realm of the Milky Way, such as other
galaxies and quasars.
289 Where is Gaia and why do we need to know?
→ WHERE IS GAIA AND WHY DO WE NEED TO KNOW?

Gaia is one of the most demanding of the 14 spacecraft operated by the European
Space Operations Centre (ESOC) at Darmstadt in Germany. Situated 1.5 million km
from us, the location of the spacecraft must be known to within 150 m every day
of the nominal five-year mission, and the time on the spacecraft must be known
to within two microseconds. At times, the amount of data that needs to be
downloaded to Earth exceeds the capacity of all three ESA ground stations.

The location of the spacecraft feeds into the data analysis and the accuracy with
which this position is measured has a direct impact on the precision needed to
reconstruct the positions, motions and distances to the stars.

To determine the distance to a spacecraft from Earth, ESOC performs two-way
ranging measurements, which are accurate to 5 m. The speed at which the
spacecraft is moving towards or away from us is obtained from Doppler
measurements, which are accurate to 0.1 mm/s. These measurements are
routinely carried out to check that Gaia is in the correct orbit and if not, to calculate
and monitor the manoeuvres that are made to place the spacecraft back on track.

The location of Gaia on the plane of the sky is obtained using two widely
separated antennas to simultaneously track the location of a transmitter on the
spacecraft – this is the delta-differential one-way ranging (DDOR) method. DDOR
can provide measurements accurate to about 22 m for Gaia, but since it requires
the regular use of two of the three ground stations that are shared by all science
missions another method is also used.

Daily tracking of the spacecraft is carried out by the Gaia Ground-Based Optical
Tracking (GBOT) programme, organised by the Gaia Data Processing and Analysis
Consortium (DPAC) using the European Southern Observatory’s VLT Survey
Telescope in Chile. Additional observations are obtained with the Liverpool Robotic
Telescope in La Palma, Spain, and occasionally the facilities of the Las Cumbres
Observatory in Hawaii, US, are also used. These measurements will provide the
location of Gaia to within 150 m, which is sufficient for the science needs.
Initially, only DDOR positions are used to determine the actual orbit of Gaia to
high accuracy but once the Gaia data is available, GBOT will routinely produce

                                           30
daily measurements of the location of the spacecraft to the accuracy needed.
Some of Gaia’s other operational requirements have meant it was necessary
to enhance some operational practices. At the ground stations, ESA upgraded
the infrastructure to support a high data rate which allows more data to be
downloaded during each period of ground station contact.
Even with this high data rate – the highest of any science mission to date
– Gaia is still the biggest user of ESA’s large 35 m network. To optimise this
use as much as possible, operators came up with a scheme that accurately
predicts how much station time is needed. The sky is not uniformly dense
with stars and this is reflected in the amount of data that is recorded by Gaia.
Knowing where Gaia will be scanning the sky in future allows the amount
of time needed per day to be predicted. Most of the time all the data can
be downloaded to Earth using the three ground stations at Cebreros (Spain),
New Norcia (Australia) and Malargüe (Argentina). However, when scanning the
densest regions of the sky, such as the Galactic Centre, even the high rate and
all three stations are not sufficient, and an intelligent onboard scheme selects
the least important data types to be deleted.
The communication protocols that are used to transmit data from the ground
stations to the space operations centre also had to be adapted to cater to the
demands imposed on time accuracy: ESOC must timestamp the data received
on ground to an accuracy of better than 2 microseconds. This accuracy is needed
to be able to reconstruct the orbits of near-Earth asteroids.
3110 From ancient star maps to precision astrometry
→ FROM ANCIENT STAR MAPS TO PRECISION ASTROMETRY

 Astrometry, the science of charting the sky, is one of the oldest branches of
 astronomy.

 The first documented records of systematic astronomical observations date
 back to the Assyro-Babylonians around 1000 BCE, and the oldest known
 stellar catalogue was compiled in the second century BCE by the Greek
 astronomer Hipparchus of Nicaea.

 Hipparchus’s catalogue lists the positions of 850 stars with a precision of
 one degree – twice the angular size of the full Moon – determined using
 only naked-eye observations and the few instruments available at the time:
 gnomons, astrolabes, and armillary spheres.

 One and a half millennia later, in the fifteenth century, Ulugh Beg of the
 Timurid dynasty created a catalogue of 994 stars with a precision slightly
 better than that of Hipparchus, using an enormous sextant with a radius of
 36 metres in Samarkand, located in present-day Uzbekistan.

 The next major step was made in the late sixteenth century by Danish
 astronomer Tycho Brahe who measured the positions of around 1000 stars
 with a precision of about one arcminute, using large quadrants and sextants
 at the Uraniborg observatory on the island of Hven (in present-day
 Sweden). His catalogue was completed in 1598 and published in 1627.
 Not long before, in 1543, Polish astronomer Nicolaus Copernicus had
 proposed the revolutionary heliocentric system, in which Earth revolves
 around the Sun.

 This revived the debate about measuring the distance to the stars using
 parallax – the apparent movement of a foreground object with respect to its
 background owing to a change in the observer’s position. Astronomers had
 tried to apply this method, also known as triangulation, to determine stellar
 distances, but no baseline on Earth was big enough to detect parallaxes
 because of the immense distances involved. In a heliocentric system,
 however, they could exploit the much larger baseline offered by Earth’s
 annual motion around the Sun.
                                     33
Tycho Brahe himself tried to measure the parallax of stars but without success.
It would take the invention of the telescope, in the early seventeenth
century, and some two hundred years of diligent astronomy before the first
distance to a star could be measured.
Meanwhile, in 1718, English astronomer Edmond Halley was the first to
discover that stars are not fixed but actually move through space. When
comparing contemporary catalogues with those from almost 2000 years
earlier, he noticed a displacement in the position of many stars. This
displacement corresponds to the projection of the star’s velocity in the
plane of the sky and is known as proper motion.
In 1725, English astronomer John Flamsteed published the first stellar
catalogue compiled with the aid of a telescope, listing the positions of
almost 3000 stars with a precision of 10–20 arcseconds. French astronomer
Jérome Lalande published an even greater catalogue with the position of
50 000 stars and a precision of around three arcseconds, in 1801.
Shortly after that, in 1838, German astronomer Friedrich Bessel was the
first to publish a reliable measurement of parallax, for the star 61 Cygni.
Amounting to 0.314 arcseconds, this placed the star at a distance of about
10 light-years. Two more astronomers, the German Wilhelm Struve and
Englishman Thomas Henderson, also successfully measured parallaxes in
the late 1830s.
Knowledge of astronomical distances finally allowed astronomers to
calibrate their observations and to estimate physical parameters of stars,
such as their luminosity and size.
From the 1850s onwards, the application of photography to astronomical
observations transformed the practice of charting the sky. With this
method, Dutch astronomer Jacobus Kapteyn started measuring the parallax
of hundreds of stars in the early 1900s.
In 1924, American astronomer Frank Schlesinger published a catalogue
with the parallaxes of almost 2000 stars, probing stellar distances out to
a few dozen light-years from Earth. His catalogue was extended to over
8000 stars by 1995, but the flickering effect caused by Earth’s atmosphere
prevented astronomers from reaching a precision better than about 0.01
arcseconds.
34The onset of the space age brought astrometry firmly back to centre stage
in astronomy. ESA’s Hipparcos mission, operating from 1989 to 1993, was
the first space telescope devoted to measuring stellar positions.
The Hipparcos catalogue, released in 1997, contains the position, parallax
and proper motion of 117 955 stars with a precision of 0.001 arcseconds,
allowing astronomers to probe stellar distances out to over 300 light-years.
The larger but less precise Tycho-2 catalogue, published in 2000, lists
positions and proper motions of 2.5 million stars, combining data from the
star mapper instrument Hipparcos with previous ground-based astrometric
catalogues.
The Hipparcos mission has had a profound influence on many fields in
astronomy, from studies of stellar interiors and evolution to the dynamics
of stars. Beyond the Milky Way, stellar distances based on Hipparcos data
have allowed cosmologists to refine the calibration of the cosmic distance
ladder.
ESA’s Gaia mission is astrometry for the twenty-first century and beyond.
It builds on the legacy of Hipparcos to chart more than one billion stars –
roughly one per cent of the content of our Galaxy – measuring their
position and parallax with astrometric precisions of down to 0.00001
arcseconds and possibly even better for the brightest stars observed.
Read more in the History of Astrometry series: sci.esa.int/gaia/history–of–
astrometry
35APPENDIX 1 Resources
Gaia online

Gaia is on social media channels:

          @ESAGaia

          www.facebook.com/ESAGaiaMission/

Information about the mission can be found on the following websites:

www.esa.int/gaia – mission summaries and news for the general public
sci.esa.int/gaia – detailed information for interested readers
cosmos.esa.int/gaia – web pages for the Gaia scientific community
archives.esac.esa.int/gaia – the Gaia mission data archive

A listing of other Gaia websites can be found here:
www.cosmos.esa.int/web/gaia/links

Pictures, illustrations and animations

A variety of photographs, illustrations and animations are available for
non-commercial use.

All Gaia images and videos:
sci.esa.int/gaia-gallery

Artist’s impressions of the mission and related science:
sci.esa.int/gaia-mission-illustrations

Illustrations of Gaia science:
sci.esa.int/gaia-science

Photographs from the construction and testing phase:
sci.esa.int/gaia-construction-and-testing-photos

                                       37
Photographs from launch:
sci.esa.int/gaia-launch-campaign-photos
Photographs of the focal plane array and CCDs:
sci.esa.int/gaia-focal-plane-and-ccds-photos
Photographs of the mirrors:
sci.esa.int/gaia-mirrors-photos
Photographs of the Basic Angle Monitor:
sci.esa.int/gaia-basic-angle-monitor-photos
Photographs of the sunshield:
sci.esa.int/gaia-sunshield-photos
Photographs of the payload module:
sci.esa.int/gaia-payload-module-photos
Photographs of the service module:
sci.esa.int/gaia-service-module-photos
Photographs of people:
sci.esa.int/gaia-people
Selected images and videos
TO BE RELEASED TO BE RELEASED
Gaia’s sky in colour Gaia’s new map of star density in the sky
http://sci.esa.int/gaia/60169 http://sci.esa.int/gaia/60170
38TO BE RELEASED
Gaia’s view of dust in the Milky Way How many stars to expect in Gaia’s second
http://sci.esa.int/gaia/60171 data release http://sci.esa.int/gaia/60146
Anatomy of the Milky Way A journey through the Galaxy
http://sci.esa.int/gaia/58206 http://sci.esa.int/gaia/58215
Parallax concept Stellar motion concept
http://sci.esa.int/gaia/53278 http://sci.esa.int/gaia/53279
Astrometry through the ages Gaia spacecraft (artist’s impression)
http://sci.esa.int/gaia/58212 39 http://sci.esa.int/gaia/55638Mapping the Galaxy Inside Gaia’s billion pixel camera
http://sci.esa.int/gaia/58214 http://sci.esa.int/gaia/53560
From launch to orbit Gaia launch: time-lapse of preparation and
http://sci.esa.int/gaia/53280 launch http://sci.esa.int/gaia/58063
Gaia launch 19 December 2013 Guide to our Galaxy
http://sci.esa.int/gaia/53539 http://sci.esa.int/gaia/53147
Gaia – building on the legacy of Hipparcos Participation in DPAC
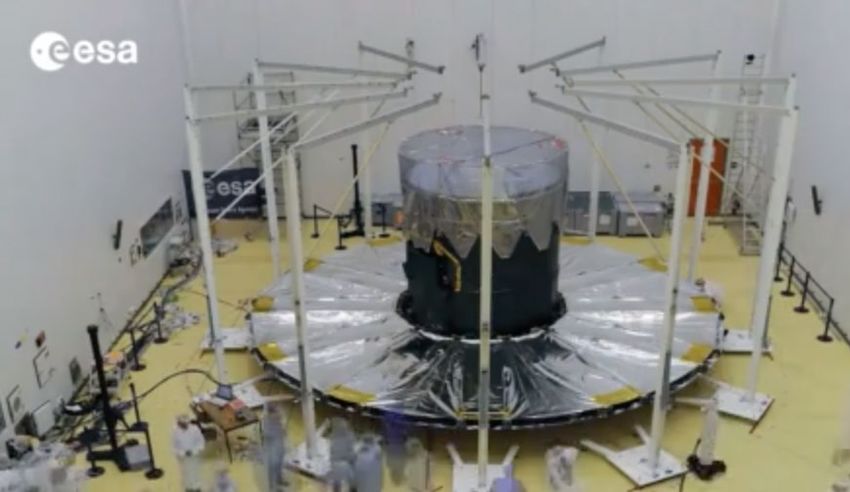
http://sci.esa.int/gaia/53273 40 http://sci.esa.int/gaia/56839Sunshield deployment (artist’s impression) Sunshield deployment (time-lapse, during
http://sci.esa.int/gaia/53375 integration) http://sci.esa.int/gaia/53113
The Gaia torus during installation of one Gaia’s CCDs
large mirror http://sci.esa.int/gaia/58208 http://sci.esa.int/gaia/48887
Gaia primary mirror Basic Angle Monitor
http://sci.esa.int/gaia/47690 http://sci.esa.int/gaia/58139
A series of 360-degree videos and other Virtual Reality visualisation resources
based on data from Gaia’s second release will be made available at
sci.esa.int/gaia-vr
41APPENDIX 2 Information about the press event
The press event about the Gaia Data Release 2 is being organised by ESA at
the ILA Berlin Air and Space Show in Germany on Wednesday 25 April 2018,
11:00–12:15 CEST.

The event will be streamed live at: www.esa.int/live

Photographs, names and titles
of the speakers at the press event:

                                               Johann-Dietrich Wörner
                                               ESA Director General

Josef Aschbacher                                Günther Hasinger
ESA Director of Earth Observation               ESA Director of Science

Anthony Brown                                   Antonella Vallenari
Gaia Data Processing and                        Gaia Data Processing
Analysis Consortium                             and Analysis Consortium
Leiden University                               INAF, Astronomical
The Netherlands                                 Observatory of Padua, Italy

                                      43
Also present at the press event:
Timo Prusti
Gaia Project Scientist
European Space Agency
Jos de Bruijne
Gaia Deputy Project Scientist
European Space Agency
Uwe Lammers
Gaia Science Operations Manager
European Space Agency
Sergei Klioner
Gaia Science Team Member
Lohrmann Observatory, Dresden, Germany
Nicholas A. Walton
Gaia Science Team Member
Institute of Astronomy, University of Cambridge, UK
Stefan Jordan
Gaia Data Processing and Analysis Consortium outreach manager
Astronomisches Rechen-Institut (ARI), Zentrum für Astronomie der Universität
Heidelberg (ZAH), Germany
Gonzalo Gracia
Gaia Data Processing and Analysis Consortium project coordinator
Anne Jean-Antoine-Piccolo
Data Processing Centre technical coordinator
CNES, Toulouse, France
44APPENDIX 3 Media contacts
GAIA MEDIA CONTACTS

European Space Agency

   ESA Media Relations Office
   ESA Headquarters, Paris, France
   Email: media@esa.int

   Phone: +33 1 53 69 72 99

Multi-Lateral Agreement Funding Agencies

   Italian Space Agency (ASI)
   Giuseppina Piccirilli (Head of press office)
   Email: giuseppina.piccirilli@asi.it; stampa@asi.it

   French Space Agency (CNES)
   Olivier La Marle (Concerning programmatic and scientific issues)
   Email: olivier.lamarle@cnes.fr
   Phone: +33 144 767 523
   Pascale Bresson
   Email: pascale.bresson@cnes.fr
   Phone: +33 (0)6 75 55 58 31

   Belgian Science Policy Office (BELSPO)
   Email: www@belspo.be

   DLR (German Aerospace Center)
   Andreas Schütz
   Email: andreas.schuetz@dlr.de

   NOVA (Netherlands Research School for Astronomy)
   Marieke Baan
   Email: H.M.Baan@uva.nl
   Phone: +31 (0)6 143 226 27

   State Secretariat for Education, Research and Innovation (SERI), Switzerland
   Swiss Space Office (SSO)
   Kamlesh Brocard

                                       46
Email: kamlesh.brocard@sbfi.admin.ch
Phone: +41 58 465 14 87
Swedish National Space Board (SNSB)
Johan Marcopoulos
Email: Johan.Marcopoulos@snsb.se
UK Space Agency (UKSA)
Chris Noble (UKSA Head of Communications)
Email: Chris.Noble@ukspaceagency.gov.uk
Phone: +44 07584 618 269
Gareth Bethell (UKSA Media Manager)
Email: Gareth.Bethell@ukspaceagency.gov.uk
Phone: +44 07925 891 949
Jake Gilmore (STFC Media Manager)
Email: jake.gilmore@stfc.ac.uk
Phone: +44 (0) 1793 442092; +44 (0) 7970 99 4586
Ministerio de Economia, Industria y Competitividad (Ministry of Economy,
Industry and Competitiveness) – MINECO
Jaime E. Navarro García (Director of Communications)
Email: jaime.navarro@mineco.es
Delia Millán Almonte (International Media Relations)
Email: delia.millan@mineco.es
Centro para el Desarrollo Tecnologico Industrial (Centre for the Development
of Industrial Technology) – CDTI
María Pilar Román (Spanish Delegation to ESA)
Email: mariadelpilar.roman@cdti.es
Juan Carlos Cortés Pulido (Director of European programmes, Space and
Technological returns, Spanish Delegation to ESA)
Email: Juancarlos.cortes@cdti.es
Industry
Airbus DS
Guilhem Boltz (Media Relations Space Systems)
Email: guilhem.g.boltz@airbus.com
Phone: +33 5 6219 6945; +33 6 3478 1408
47Data Processing Centres
DPC-E: ESAC, Madrid, Spain
Emmet Fletcher
Email: Emmet.Fletcher@esa.int
Beatriz Arias
Email: beatriz.arias@esa.int
DPC-C: CNES, Toulouse, France
Pascale Bresson
Email: pascale.bresson@cnes.fr
Phone: +33 (0)6 75 55 58 31
DPC-I: Institute of Astronomy, Cambridge, UK
Matthew Bothwell
Email: bothwell@ast.cam.ac.uk
Carolin Crawford
Email: csc@ast.cam.ac.uk
DPC-G: Observatoire de Genève / ISDC, Switzerland
Marco Cattaneo
Email: Marco.Cattaneo@unige.ch
Phone: +41 22 379 77 96 / +41 79 666 83 85
DPC-T: INAF-OATo, Torino, Italy
Rosario Messineo
Email: rosario.messineo@altecspace.it
DPC-B: Barcelona Supercomputing Centre, Barcelona, Spain
Gemma Ribas (Press & Protocol Relations Manager)
Email: gemma.ribas@bsc.es
Research Institutes
ASI Space Science Data Center (SSDC)
Paola Marrese
Email: paola.marrese@ssdc.asi.it
Giuseppina Piccirilli (Head of ASI press office)
Email: giuseppina.piccirilli@asi.it ; stampa@asi.it
48Astronomisches Rechen-Institut (ARI) – Zentrum für Astronomie der
Universität Heidelberg (ZAH)
Guido Thimm (Outreach representative)
Email: thimm@ari.uni-heidelberg.de
Phone: +49-6221-54-1805
Ulrich Bastian
Email: bastian@ari.uni-heidelberg.de
Phone: +49-6221-54-1852; +49-6221-54-1880
Cambridge University
Sarah Collins (Cambridge University Press Office)
Email: sarah.collins@admin.cam.ac.uk
Matthew Bothwell (Institute of Astronomy Outreach Assistant)
Email: bothwell@ast.cam.ac.uk
Carolin Crawford
Email: csc@ast.cam.ac.uk
Finnish Geodetic Institute/Department of Physics, University of Helsinki
Minna Meriläinen-Tenhu
Email: minna.merilainen@helsinki.fi
Phone: +358 50 415 0316
Geneva University
Marco Cattaneo
Email: Marco.Cattaneo@unige.ch
Phone: +41 22 379 77 96 / +41 79 666 83 85
INAF - Italian National Institute for Astrophysics (Istituto Nazionale di
AstroFisica)
Marco Galliani
Email: marco.galliani@inaf.it; ufficiostampa@inaf.it
Phone: +39 06 355 33 390
Kapteyn Astronomical Institute, University of Groningen
Marlies van de Weijgaert (Kapteyn Astronomical Institute)
Email: m.weijgaert@astro.rug.nl
Phone: +31 (0)6 106 406 52
Rene Fransen (University of Groningen)
Email: r.fransen@rug.nl
Phone: +31 (0)50-3639651; +31 (0)50-3637361
49You can also read