Monitoring of Queensland's shark catch for the net fisheries - Summary report 2021
←
→
Page content transcription
If your browser does not render page correctly, please read the page content below

Monitoring of Queensland’s shark catch for the net
fisheries

Summary report
2021

This publication has been compiled by Fishery Monitoring staff of Fisheries Queensland, DAF.

Enquiries and feedback regarding this document can be made as follows:
Email: info@daf.qld.gov.au
Telephone: 13 25 23 (Queensland callers only) (07) 3404 6999 (outside Queensland) Monday, Tuesday, Wednesday and
Friday: 8 am to 5 pm Thursday: 9 am to 5 pm
Post: Department of Agriculture and Fisheries GPO Box 46 BRISBANE QLD 4001 AUSTRALIA
Website: daf.qld.gov.au

          Interpreter statement
The Queensland Government is committed to providing accessible services to Queenslanders from all culturally and
linguistically diverse backgrounds. If you need an interpreter to help you understand this document, call 13 25 23 or visit
daf.qld.gov.au and search for ‘interpreter’

© State of Queensland, 2020

The Queensland Government supports and encourages the dissemination and exchange of its information. The copyright in
this publication is licensed under a Creative Commons Attribution 4.0 International (CC BY 4.0) licence.

Under this licence you are free, without having to seek our permission, to use this publication in accordance with the licence
terms.

You must keep intact the copyright notice and attribute the State of Queensland as the source of the publication.

Note: Some content in this publication may have different licence terms as indicated.

For more information on this licence, visit https://creativecommons.org/licenses/by/4.0/.

The information contained herein is subject to change without notice. The Queensland Government shall not be liable for
technical or other errors or omissions contained herein. The reader/user accepts all risks and responsibility for losses,
damages, costs and other consequences resulting directly or indirectly from using this information.

.
Table of Contents

Summary ................................................................................................................................................ 1
Introduction ........................................................................................................................................... 3
Objectives .............................................................................................................................................. 4
Methods ................................................................................................................................................. 4
Study area ............................................................................................................................................... 4
Sampling the retained shark catch .......................................................................................................... 4
        ECIFFF          7
        GOCIFFF 7
Survey of fisher discarding behaviour ..................................................................................................... 8
Sampling the non-retained shark catch .................................................................................................. 9
        ECIFFF          10
        GOCIFFF 10
Project ethics ......................................................................................................................................... 11
Species identification and verification ................................................................................................... 11
        Visual species identification training and competency checks ..................................................... 11
        Photographic samples .................................................................................................................. 13
        Genetic species identification ....................................................................................................... 13
Verification and quality assurance of the data ...................................................................................... 15
Results ................................................................................................................................................. 16
Program overview ................................................................................................................................. 16
Genetic samples ................................................................................................................................... 17
Photographic samples........................................................................................................................... 18
Species identification ............................................................................................................................ 18
Biological data ....................................................................................................................................... 20
Retained catch composition .................................................................................................................. 23
Non-retained catch composition ........................................................................................................... 26
Fishery Discards - Survey ..................................................................................................................... 31
Discussion ........................................................................................................................................... 31
References ........................................................................................................................................... 37
Appendix A – SHK01 datasheet ......................................................................................................... 38
Appendix B – Species composition tables....................................................................................... 39

                                                                             ii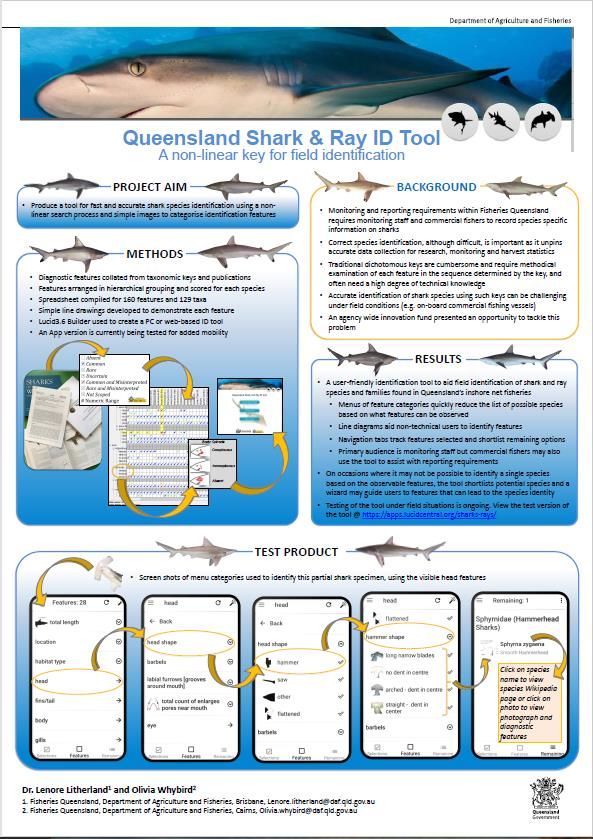
List of figures

Figure 1 Map of Queensland showing sampling regions for GOCIFFF and ECIFFF shark monitoring.
Gridlines indicate the CFISH grids. In the GOCIFFF, catches were not targeted in the Torres Strait,
Central Gulf, or Mapoon Regions. In the ECIFFF, catches were not targeted in the Torres Strait,
Lockhart, Cooktown, Swains or Coral Sea regions. ............................................................................... 6
Figure 2 Summary of retained catch sampling ...................................................................................... 8
Figure 3 A series of photographs illustrating retained catch sampling and the variety of product forms
encountered (whole animals, barrels, trunks, and heads), highlighting the need for a novel approach
to obtain accurate species identification ................................................................................................. 9
Figure 4 Summary of non-retained catch sampling ............................................................................. 11
Figure 5 A series of photographs illustrating at-sea data collection capturing the variation of fishery
operations that interact with shark ........................................................................................................ 12
Figure 6 An example competency test hosted in Microsoft Forms, allowing for online distribution and
automated feedback. A variety of question formats were used, incorporating both visual and text-
based questions. ................................................................................................................................... 13
Figure 7 Development of the Shark and Ray ID Assist tool ................................................................. 14
Figure 8 Processing of genetic samples for species identification L-R (Top to Bottom): fin clip
samples. Extraction of mitochondrial DNA for polymerase chain reactions (PCR). Preparing gel
electrophoresis prior to enzymatic purification and sequencing. Analysis of sequencing results (in
Geneious) and plotting sequence divergence for species identification. .............................................. 15
Figure 9 Monitoring program sampling overview ................................................................................. 16
Figure 10 Overall size structure of sharks within the monitoring data ................................................. 20
Figure 11 Sex ratio of the retained and discarded catch (A, B) and by species (C, D) ....................... 21
Figure 12 Size structure by sex for four species of shark, highlighting the inter species variability in
size characteristics ................................................................................................................................ 22
Figure 13 Species composition (number) of the retained catch in each quota region, by sampling year
(GBR 2018–19 and 2019–20, SEC 2018–19 and 2019–20, GOC 2019 and 2020). Legend matches
order of appearance from bottom to top. See Appendix B for individual species values ..................... 24
Figure 14 Species composition (percentage) of the retained catch in each quota region, by sampling
year (GBR 2018–19 and 2019–20, SEC 2018–19 and 2019–20, GOC 2019 and 2020). Legend
matches order of appearance from bottom to top. See Appendix B for individual species values....... 25
Figure 15 Hammerhead species composition of the retained catch in each quota region, by sampling
year (GBR 2018–19 and 2019–20, SEC 2018–19 and 2019–20, GOC 2019 and 2020). Legend
matches order of appearance from bottom to top ................................................................................. 26
Figure 16 Number and percentage of animals discarded by position for each quota region .............. 28
Figure 17 Species composition of the non-retained catch by quota region for 2019. See Appendix B
for individual species values. Legend matches order of appearance from bottom to top .................... 29
Figure 18 Fate characteristics of the non-retained shark catch. Fate by fishing position (top left), fate
by quota region (bottom left), fate by species (right) ............................................................................ 30
Figure 19 Fate characteristics for hammerhead species ..................................................................... 30

                                                                           iii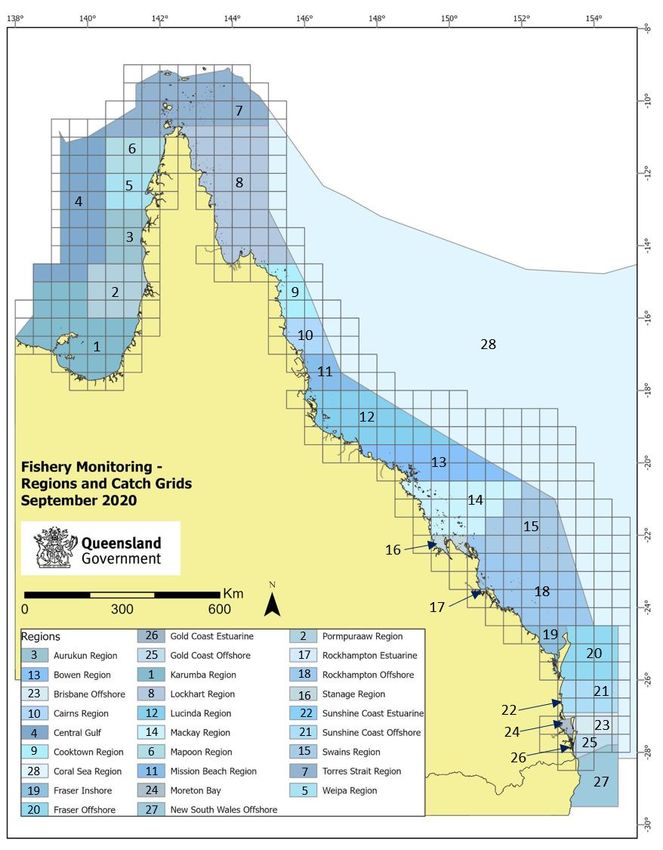
List of tables

Table 1 Overview of management controls current for 2018-2020 ........................................................ 5
Table 2 Number of genetic samples collected ...................................................................................... 18
Table 3 Number of genetically verified photographic samples ............................................................. 19
Table 4 Sampling coverage for the retained catch of shark in each fishery ......................................... 23
Table 5 Sampling coverage for the non-retained catch of shark in each fishery .................................. 27
Table 6 Areas of work for future consideration ..................................................................................... 33
Table B1: Retained catch composition by quota region strata for two survey years ............................ 39
Table B2 Non-retained catch composition by quota region strata for one sampling year (2019)
compiled from 601 rob events. .............................................................................................................. 40

                                                                      iv
List of acronyms/definitions

       Acronym     Description
           AIVR    Automated Integrated Voice Response
 Catch locations   Fishery Monitoring Program sampling locations, Fisheries Queensland (2009). These are
                   standardised spatial regions that split the east coast and Gulf of Carpentaria into
                   subsections for the spatial stratification of sampling
           DAF     Queensland Department of Agriculture and Fisheries
       Discards    Sharks that are returned overboard, either alive or dead, i.e. the non-retained portion of
                   the shark catch
            EC     East Coast of Queensland
        ECIFFF     East Coast Inshore Fin Fish Fishery
          FOP      Fisheries Queensland’s Fisheries Observer Program
          GBR      Great Barrier Reef shark quota region
          GOC      Gulf of Carpentaria shark quota region
       GOCIFFF     Gulf of Carpentaria Inshore Fin Fish Fishery
           PCS     Percentage of the catch sampled—indicates the sub-sample of the catch where data was
                   recorded
          QBFP     Queensland Boating and Fishing Patrol
           SEC     South East Coast shark quota region
          TACC     Total allowable commercial catch
          WTO      Wildlife trade operation approval

                                                     v
Summary
Fisheries Queensland is investing significantly in additional biological monitoring under the
Queensland Sustainable Fisheries Strategy 2017-2027. A detailed understanding of the retained and
discarded shark catch was identified as a ‘high benefit, medium feasibility’ research priority in the
Monitoring and research plan 2017-18 - Sustainable fisheries (Department of Agriculture and
Fisheries 2018). Information about the species composition, quantity, fate characteristics and
biological characteristics of sharks that are retained or discarded by net fishers was highlighted within
the research priorities. This information would enhance managers and stakeholders understanding of
the performance of Queensland’s net fisheries, facilitate management for the sustainable harvest of
sharks and assist with wildlife trade operation (WTO) approvals.
Fisheries Queensland’s Fishery Monitoring team established a monitoring program to collect
information on the retained and non-retained (discarded) catch of shark by net fishers operating in the
East Coast Inshore Finfish Fishery (ECIFFF) and Gulf of Carpentaria Inshore Finfish Fishery
(GOCIFFF). Sampling commenced in 2018 and continued through 2020. These are complex fisheries
and due to the challenges associated with representative data collection the retained and non-
retained catch components were sampled separately to maximise the overall data integrity from each
catch component. The ECIFFF retained harvest was sampled across the financial years of 2018-2019
and 2019-2020. The GOCIFFF retained harvest was sampled across the calendar years of 2019 and
2020. Both the ECIFFF and GOCIFFF discarded catch was sampled across the calendar years of
2019 and 2020. Travel and work restrictions caused by Health Directives in response to the Novel
Coronavirus (COVID-19) pandemic, severely restricted sampling through much of 2020 (March to
December).
The monitoring program collected information on the retained shark catch through fishery-dependent
sampling at ports, seafood processors and at sea. The sampling unit used for monitoring the retained
catch in this study is a catch, which refers to all landed shark from a fishing event (i.e. a day or trip).
Sampling was stratified by location and time to representatively sample the retained catch of sharks in
the ECIFFF and GOCIFFF.
The monitoring program collected information on the non-retained (discarded) component of the shark
catch through two avenues. A phone survey of commercial net fishers operating in the ECIFFF and
GOCIFFF was completed to profile discard behaviour and document the drivers behind shark
discarding by fishers. In addition, periodic at-sea surveys were conducted to observe fishery
operators checking their nets and recording characteristics of the non-retained shark catch. The
sampling unit used for monitoring the non-retained catch in this study is an individual rob event, which
refers to a net haul, net lift, or net check. Sampling of rob events (i.e. a net lift, net check, net haul)
was stratified by location and time in the ECIFFF and GOCIFFF.
A novel methodology was adopted to achieve highly accurate species identification. The program
developed comprehensive staff training tools to enable monitoring staff to accurately identify shark
species in the field. In addition, photographic samples and genetic samples were collected to identify
cryptic species or incomplete samples (e.g. barrels, trunks, heads) and validate field identification by
monitoring staff. A high priority was placed on data verification and data quality assurance.
This report provides an overview of the monitoring program, a summary of key results and
recommends additional data investigations. Supplementary documents to this report, that cover
procedural details of sampling and data handling as well as further technical data summaries, are
available on request. Data and samples generated through the monitoring program are also available
through a data request. Detailed results of the phone survey on fisher discard behaviour have been
reported in Behavioural and economic drivers influencing shark fishing practices in Queensland’s
commercial net fisheries (Teixeira et al. 2018).
This shark monitoring program provided a detailed investigation of the catch of shark in the ECIFFF
and GOCIFFF. The program addressed its core objectives of collecting data on species composition
of the retained shark catch and developing a profile of discarded shark within the ECIFFF and

Monitoring of Queensland’s shark catch for the net fishery, Department of Agriculture and Fisheries, 2021   1
GOCIFFF. Fishery monitoring staff collected data from 202 retained shark catches. Fishery
monitoring staff also observed the discarded catch from 601 individual rob events (i.e. net checks, net
lifts, net hauls) equivalent to 3132 soak hours and >150 km of net. For 12% of the observed rob
events, all sharks that were caught by the fisher were retained. For 28% of the observed rob events
some or all the sharks caught were discarded by the fisher. However, the majority of observed rob
events (60%) recorded no sharks caught by the fisher. Regional differences were identified in these
patterns of shark discards.

The most frequently encountered species in the retained catch (across all regions) was the
Carcharhinus tilstoni/limbatus complex, representing 44% of the sampled catch. The next most
frequently encountered species in the retained catch were the spot-tail shark (18%) and the
Australian sharpnose shark (9%). The scalloped hammerhead was the most frequently encountered
hammerhead species identified in the retained catch and overall comprised 7% of the sampled catch.
Regional variation in species composition was evident. The size structure of the retained catch was
dominated by animals between 50 and 110 cm stretched total length.
The most frequently encountered species in the non-retained catch (across all regions) was the
Carcharhinus tilstoni/limbatus complex, representing 23% of the sampled discards. The next most
frequently encountered species in the non-retained catch was the creek whaler (13%) followed by the
pigeye shark (8%) and the scalloped hammerhead (8%). Regional variation in species composition
was evident. Species variation in fate characteristics was also evident. Among those commonly
discarded species, 45% of C. tilstoni/limbatus complex, 65% of creek whalers and 57% of pigeye
sharks were released alive. For the scalloped hammerhead, 46% were released alive. This reduced
to 18% for great hammerheads and 12% for winghead sharks.

Quality assured data is available for investigating spatial prevalence, size composition, and seasonal
patterns in the retained shark catch within the ECIFFF and GOCIFFF. Likewise, quality-assured data
is available for investigating the species composition, fate characteristics and gear selectivity for the
non-retained (discarded) catch in the GOCIFFF and ECIFFF. This information will feed into species
briefs for use in future shark stock assessments. While the retained catch data are considered
representative of the fishery, due to the inherent nature of observer work, the non-retained catch data
represents the vessels observed and not necessarily the fleet. It is recommended that the non-
retained catch data is reconstructed to determine fleet-level metrics before direct comparison with the
retained catch metrics.

Across the program, 28 species of shark were recorded in the data. Species identification could be
verified through genetic screening for 73% of shark records. A further 12% of shark records had a
photographic sample to verify the field identification. The remaining 15% of shark records relied solely
on species identification in the field. Genetic species identification was compared with visual species
identification to quantify the level of misidentification for visual species identification in the field (i.e.
using records that had both data fields). Overall, 7% of records were not correctly assigned to their
genetically identified species. However, for those species that were frequently encountered,
misidentifications were quite low (2-3%) (e.g. 98% of C. tilstoni/limbatus complex and 97% of spot-tail
sharks were correctly identified). These results indicate that species misidentification would represent
a very minor quantity of the records for those records where only a field identification was available.

In addition to achieving the core project objectives, outputs of the program extend to include a range
of tools to assist in shark species identification, an extensive library of genetic samples and sequence
data (approaching 6000 samples), and a shark species image library, based on genetically verified
records. The monitoring team collaborates with other research agencies to utilise these resources to
improve the overall knowledge of shark stocks within Queensland. The program has also developed
comprehensive sampling protocols that integrate with other fishery dependant sampling undertaken
by the monitoring team. This allows the monitoring team to be well-positioned for any future
requirements for monitoring the species composition and biological characteristics of the shark catch.

Monitoring of Queensland’s shark catch for the net fishery, Department of Agriculture and Fisheries, 2021    2
Introduction
Many shark species show biological characteristics of slow growth, older maturity age, and produce
relatively few young. These qualities mean that some shark species will have low resilience to fishing
pressure. Accordingly, it is important to monitor fishery activities that interact with shark stocks to
ensure catches remain within sustainable levels, enabling shark species to fulfil their ecosystem
functions (Heupel et al. 2014).
Shark species show large variability in their use of Queensland’s coastal habitats. River, estuarine,
foreshore, reef and offshore areas can be used at different times throughout a species lifecycle (e.g.
some species utilise estuaries or rivers as nursery habitats). Additionally, some shark species may
undertake long migrations or have large home ranges while others occupy relatively small home
ranges. Consequently, each shark species may experience different impacts from fishing activities.
Knowledge of what species are interacting with fishing operations and when is important for
adequately assessing the impacts of a fishery on local shark stocks.
In Queensland, most sharks are caught by net operators working in the Gulf of Carpentaria Inshore
Finfish Fishery (GOCIFFF) and the East Coast Inshore Finfish Fishery (ECIFFF). The ECIFFF and
GOCIFFF cover a vast geographic area and a remarkable array of fishing operations. Variation
occurs in terms of vessel and crew size, target species, peak fishing seasons and the type and
method of fishing gear used (Teixeira et al. 2018, Jacobson et al. 2019a,b). The harvest of shark is
managed through various input and output controls such as limited entry, vessel restrictions, gear
restrictions, maximum size limits, possession limits, and catch limits (TACC), including a hammerhead
specific TACC. A detailed review of these fisheries can be obtained by referring to the ECIFFF and
GOCIFFF scoping studies (Jacobson et al. 2019a,b).
Fisheries Queensland monitors the commercial catch of shark to collect essential catch information.
Historically this has taken the form of logbook reporting and, since 1988, there have been a series of
logbook iterations which have recorded catch data at different species resolution through time (Leigh,
2015). In January 2018, to address identified knowledge-gaps, Fisheries Queensland instigated new
logbook and reporting requirements for all fishers catching sharks. Since January 2018, all retained
shark catch is reported in the logbooks (as weight or number) to the level of species or species
complex, where specified. Species discrimination amongst carcharhinids, the family group most
encountered by ECIFFF and GOCIFFF net fishers, is inherently difficult. Because of this, the current
logbook species groupings take into consideration those species where fishers are unlikely to
accurately distinguish between species (e.g. Carcharhinus tilstoni and C. limbatus or C. leucas and C.
ambionensis).
Since 2018, all discarded shark catch is also reported in the logbooks. Discards by number are
reporting for each species of hammerhead shark with all other shark combined in the category ‘other
shark’. Further to these logbook reporting requirements, since 2018 all shark catch is reported on a
‘prior notice’ through the Automated Integrated Voice Response (AIVR) phone reporting system and
lodged on an unload notice. If sharks are caught, the number is reported using the AIVR prior to the
fisher landing. Further to this, fishers holding a shark endorsement (i.e. an S symbol) are required to
wait for one hour before leaving their landing place to allow for possible inspection by compliance
officers from Queensland Boating and Fishing Patrol (QBFP). If an S symbol is not written on the
authority, the fisher does not need to wait at the landing place after the ‘prior notice’ has been given.
While these changes improve the reporting of both the retained and non-retained catch of sharks and
improve the species resolution of the catch data, they still rely on individual fishers accurately
identifying and recording the correct species in the logbooks. Shark species identification is renowned
as a challenging task even for trained and highly experienced observers (Tillett et al., 2012).
Accordingly, confidence in the logbook species data remains low.
Fisheries Queensland carried out an observer program (FOP) between 2000 and 2012 (e.g. 2000-
2006 – N9 FOP). This program provided a snapshot of net fishers’ interactions with shark species.
While the FOP provided species composition data that was higher quality than the logbook data, the

Monitoring of Queensland’s shark catch for the net fishery, Department of Agriculture and Fisheries, 2021   3
program encountered its own suite of challenges relating to representative sampling of the fishery and
accurate species identification (Leigh, 2015).
As part of the Queensland Sustainable Fisheries Strategy 2017-2027, Fisheries Queensland
committed to collecting additional biological information for sharks. Information about the species
composition, quantity, fate, maturity and size of sharks retained or discarded by net fishers operating
in the ECIFFF and GOCIFFF, was highlighted within the research priorities in the Monitoring and
research plan 2017-18 - Sustainable fisheries (Department of Agriculture and Fisheries 2018).
Likewise, knowledge of fisher behaviour surrounding the practice of discarding sharks was recognised
as important. Together this information could enhance managers and stakeholders' understanding of
the performance of Queensland’s net fisheries, facilitate management for the sustainable harvest of
sharks, assist with WTO approvals for the ECIFFF and improve marketing of shark product. A shark
monitoring program was established to tackle these data requirements and obtain high-resolution
species-level data. This report provides an overview of the monitoring program, a summary of key
results and additional data investigation recommendations.

Objectives
Fisheries Queensland’s Fishery Monitoring team implemented a fisheries-dependent monitoring
program for sharks in the ECIFFF and the GOCIFFF to address two broad objectives.

Objective 1: Provide information on the species composition and biological attributes (size, sex) of
the retained catch via representative fishery-dependent sampling.
Objective 2: Develop a profile of the non-retained (or discarded) shark catch using cross-disciplinary
techniques:
a. via a structured questionnaire to document commercial fishers’ discarding behaviour and
b. via periodic at-sea surveys to observe fishery operators checking their nets to record
   characteristics of gear use (such as net length, mesh size, soak time and position) together with
   characteristics of the associated non-retained catch (such as species composition and fate).

Methods
Study area
Fisheries Queensland's fishery monitoring team monitored the retained and non-retained catch of
shark by net fishers operating in the ECIFFF and GOCIFFF. The study area extends from the
Queensland – New South Wales border to the Queensland – Northern Territory border. The study
area is broken into distinct monitoring regions to stratify sample collection and for use in post-survey
weighting and analysis (Figure 1). Catches were not targeted in the Central Gulf, Mapoon, Torres
Strait, Lockhart, Cooktown, Swains or Coral Sea regions primarily due the frequency of ECIFFF and
GOCIFFF net fishers operating in these regions.

Sampling the retained shark catch
Fisheries Queensland's fishery monitoring team use a suite of sampling strategies to collect fishery-
dependent data and samples for many species. Those that apply to sampling shark include:

    •    Commercial catch sampling (Fisheries Queensland 2009)
             o measuring fish/ sharks before they are sold by fishers to seafood wholesalers
             o measuring fish/shark at seafood wholesalers
             o asking fishers to measure their fish/shark or keep samples if required
    •    Biological Sampling Protocol: Shark, 2018-2020 (Fisheries Queensland 2019)

Monitoring of Queensland’s shark catch for the net fishery, Department of Agriculture and Fisheries, 2021   4
Where possible, sampling trips for the retained catch of shark are incorporated into existing
commercial sampling activities to maximise the program’s efficiency (Figure 3). Shark specific
sampling events are also scheduled to capture the shark fishery's peak seasonality in key regions to
complement this non-specific sampling.
Table 1 Overview of management controls current for 2018-2020
GOCIFFF ECIFFF
Limited entry, 84 fishing symbols Limited entry, 692 fishing symbols
Input controls • 231 line
120 with an S symbol
(effort • 132 net
management) • Remaining 329 are bait or ocean beach
with limited shark interaction
Spatial and temporal closures Spatial and temporal closures (marine
(marine parks*/finfish closure) parks*/finfish closure)
Vessel restrictions Vessel restrictions
A 14 m (N1, N2, N10, K1–K8) and 16 m
(N4) maximum boat length restriction
Gear restrictions Gear restrictions
Logbook reporting Logbook reporting
Output controls • Species categories for retained • Species categories for retained shark
(catch shark catch catch
management) • Hammerhead and other shark • Hammerhead and other shark
categories for discarded catch categories for discarded catch
AIVR and Prior reporting AIVR and Prior reporting
• S symbol holders must prior report any
catch at least 1 hr prior to landing
Quota Quota
• Hammerhead specific quota of • 600 t divided between GBR (480 t) and
50 t SEC (120 t) quota regions
• Hammerhead specific TACC (GBR 78 t
and SEC 22 t)
Product form limits
• S symbol holders may remove the
head, tail and or fins except for listed
species. The body corresponding to
each removed fin must be retained
• Fishers operating without the S symbol
must keep any fins or tails removed
together with the body until the product
is unloaded from the boat
Size limits
• 1.5 m Maximum legal size limit and a
60 cm maximum interdorsal length limit
for all commercial line operators
Restricted access to shark resources
• Non-S symbol holders have a
possession limit of 10 sharks for net
and 4 sharks for line
• S symbol holders (120 licence holders)
can retain a larger number of sharks,
for additional licence fee
*Note marine parks are a habitat management tool overseen by government departments other
than Fisheries Queensland, DAF
Monitoring of Queensland’s shark catch for the net fishery, Department of Agriculture and Fisheries, 2021 5Figure 1 Map of Queensland showing sampling regions for GOCIFFF and ECIFFF shark monitoring. Gridlines indicate the CFISH grids. In the GOCIFFF, catches were not targeted in the Torres Strait, Central Gulf, or Mapoon Regions. In the ECIFFF, catches were not targeted in the Torres Strait, Lockhart, Cooktown, Swains or Coral Sea regions Monitoring of Queensland’s shark catch for the net fishery, Department of Agriculture and Fisheries, 2021 6
ECIFFF
Sampling is designed to be representative of the ECIFFF net harvest of shark. Routine fishery-
dependent catch sampling spans the breadth of ECIFFF net fishery which operates in coastal waters
from the QLD-NSW border to the Lockhart Region (Figure 1). Sampling is stratified to capture
variations in region, season, and fishing methods and is focused on S Symbol (shark endorsement)
licence holders.
Data collection occurs at-sea, in-port and at Queensland seafood processors. Data collected from
each fisher’s retained catch includes the date, catch location, fishing method, and species retained,
with size, sex, and maturity recorded where possible. Fin clip and photographic samples are collected
to aid accurate species identification. See Appendix A for the SHK01 datasheet and the Biological
Sampling Protocol: Shark, 2018-2020 (Fisheries Queensland 2019) for further data collection
methods.
For the ECIFFF, a new sampling season starts each July (commencing July 2018) and continues
through to June (finishing June 2020). Sampling quarters are by financial year:
    • 1st quarter: July to September
    • 2nd quarter: October to December
    • 3rd quarter: January to March
    • 4th quarter: April to June.

GOCIFFF
Sampling is designed to be representative of the GOCIFFF net harvest of shark. Routine fishery-
dependent catch sampling spans the fishery's inshore and offshore components across its spatial
extent (Figure 1). Sampling is stratified to capture variations in region, season, and fishing method.
Data collection occurs predominantly at-sea as it is rarely possible to representatively sample GOC
fishers’ catch in-port or at Queensland seafood processors. Accordingly, sampling fatigue had to be
managed where there are only a few operators in the fishery (e.g. offshore GOC). After consultation
with the offshore (N12) fishery operator, monitoring staff planned four extended trips per year
between February and October to sample the retained shark catch.
Data collected from each fisher’s retained catch includes the date, catch location, fishing method, and
species retained, with size, sex, and maturity recorded where possible. Fin clip and photographic
samples are collected to aid accurate species identification. See Appendix A for the SHK01 datasheet
and the Biological Sampling Protocol: Shark, 2018-2020 (Fisheries Queensland 2019) for further data
collection methods.
A new sampling season for GOCIFFF starts each February (commencing February 2019) and
finishes in October (finishing October 2020). The fishery does not operate over the summer months
due to spawning closures. Sampling quarters are by calendar year:
     • 1st quarter: January to March
     • 2nd quarter: April to June
     • 3rd quarter: July to September
     • 4th quarter: October to December.

Monitoring of Queensland’s shark catch for the net fishery, Department of Agriculture and Fisheries, 2021   7
Stratified to capture
seasonal, spatial and
fishing method trends
Comprehensive,
Sampling whole,
routine fishery -
ungraded catches at-
dependent sampling
sea, in-port, at
representative of the
seafood processors
harvest
Composition Record biological
ECIFFF (financial year)
of the characteristics
GOCIFFF (Calendar (species, size, sex,
year)
retained catch
of shark maturity)
Figure 2 Summary of retained catch sampling
Survey of fisher discarding behaviour
Queensland net fishery operators participated in a structured questionnaire that documented the
relative importance of behavioural and economic factors which influence whether sharks are retained
or not. Survey participants were active commercial net fishers of the ECIFFF and the GOCIFFF (i.e.
reported catch in the two years before the survey commenced).
Data collection was undertaken by Fisheries Queensland’s fishery monitoring staff. Fishers were
recruited into the survey by telephone with up to five attempts made to contact a fisher. Interviews
were conducted via telephone, taking between 10 and 45 minutes to complete.
The survey was structured in three sections:
• 1st section: a series of open-ended questions to discern the reasons why fishers decide to
discard or retain their shark catch.
• 2nd section: multiple-choice questions about:
o the fisher’s fishing activities (categorised by years fished, fishing region, fishing
symbols, and vessel, fleet, and crew size)
o the discarded catch (all species and sharks specifically)
o the frequency of sharks caught
o whether they target sharks
o the importance of sharks to their business
o the primary method of shark interaction
o the species they are usually targeting when they interact with sharks.
• 3rd section: Likert-scale questions to examine discarding behaviour according to the Theory
of Planned Behaviour (TPB) principles.
Monitoring of Queensland’s shark catch for the net fishery, Department of Agriculture and Fisheries, 2021 8A pilot was conducted to trial the questionnaire and refine the questions for the final survey. Fourteen fishers partook in the pilot study. These fishers had a history of working closely with Fisheries Queensland’s monitoring staff. The pilot survey included extra open-ended questions for the purpose of gathering as much detail as possible to inform the final questionnaire. Several amendments were made to the survey questions following the pilot survey. A comprehensive summary of the methods is presented in Teixeira et al. (2018). Figure 3 A series of photographs illustrating retained catch sampling and the variety of product forms encountered (whole animals, barrels, trunks, and heads), highlighting the need for a novel approach to obtain accurate species identification Sampling the non-retained shark catch Fishery dependant sampling of the non-retained (or discarded) catch of shark is by direct observation of net fishery operations. Specific at-sea sampling events are scheduled with wide array of fishers to capture variation across gear-types, area, and season (Figure 5). Monitoring of Queensland’s shark catch for the net fishery, Department of Agriculture and Fisheries, 2021 9
ECIFFF
Periodic, fishery-dependent, surveys are undertaken at-sea to observe fishery operators checking and
hauling their nets (referred to in this report as rob events). Sampling spans the breadth of ECIFFF net
fishery which operates in coastal waters from QLD-NSW border to Lockhart Region (Figure 1).
Sampling aims to capture variation in region, season, and fishing method. However, sampling is
limited by vessel access permissions (i.e. participation in the monitoring program is voluntary), staff
safety considerations, and fishery operation size (e.g. small operators may have limited space for an
additional person and monitoring staff cannot replace a deckhand). Sampling can be considered
opportunistic and, while representative of a diversity of operators who will and can take monitoring
staff on board, it may not represent the overall fishery’s activity.
Data from each observed rob event (i.e. a net check or net haul) included catch location, fishing
method, date; net set details (e.g. net length, mesh size, soak time, fishing position), species
discarded and fate. Size, sex, and maturity are also recorded where possible. Fin clip and
photographic samples are collected to aid accurate species identification. See Appendix A for the
SHK01 datasheet and the Biological Sampling Protocol: Shark, 2018-2020 (Fisheries Queensland
2019) for further data collection methods.
For the ECIFFF, a new sampling season starts each January (commencing January 2019) and
continues through to December (finishing December 2020).
Sampling quarters are by calendar year:
    •   1st quarter: January to March
    • 2nd quarter: April to June
    • 3rd quarter: July to September
    • 4th quarter: October to December.

GOCIFFF
Periodic, fishery-dependent, surveys are undertaken at-sea to observe fishery operators checking and
hauling their nets (referred to in this report as rob events). Sampling spans inshore and offshore
components of the fishery across its spatial extent (Figure 1). Sampling aims to capture variation in
region, season, and fishing method. However, sampling is limited by vessel access permissions (i.e.
participation in the monitoring program is voluntary), staff safety considerations, and fishery operation
size (e.g. small operators may have limited space for an additional person on board and monitoring
staff cannot replace a deckhand). Furthermore, sampling fatigue needs to be avoided where there are
only a few operators in the fishery (e.g. offshore GOC). Sampling is therefore opportunistic and, while
representative of a diversity of operators who will and can take monitoring staff onboard it may not be
representative of the overall fishery activity.
Data from each observed rob event (i.e. a net check or net haul) included the catch location, fishing
method, date, net set details (e.g. net length, mesh size, soak time, fishing position), species
discarded and fate. Size, sex, and maturity are also recorded where possible. Fin clip and
photographic samples are collected to aid accurate species identification. See Appendix A for the
SHK01 datasheet and the Biological Sampling Protocol: Shark, 2018-2020 (Fisheries Queensland
2019) for further data collection methods.
For the GOCIFFF, a new sampling season starts each February (commencing February 2019) and
continues through to October (finishing October 2020). This fishery does not operate over the summer
months due to spawning closures. Sampling quarters are by calendar year:
    • 1st quarter - January to March,
    • 2nd quarter - April to June,
    • 3rd quarter - July to September,
    • 4th quarter - October to December.

Monitoring of Queensland’s shark catch for the net fishery, Department of Agriculture and Fisheries, 2021   10
Stratified to
Capture net set
capture seasonal,
characteristics
spatial & fishing
(soak time, net
method
length, position)
variations
Opportunistic Profile amount &
sampling of rob fate of shark
events at-sea discards
Characteristics Record biological
ECIFFF & GOCIFFF of the non- characteristics
(Calendar year) retained catch (species, size,
sex, maturity)
of shark
Figure 4 Summary of non-retained catch sampling
Project ethics
Animal ethics approval was sought to cover any interaction staff had with live sharks during the
sampling process, such as taking fin clip samples or photographing the animal (AEC reference: CA
2019/08/1309).
A human ethics self-assessment was completed for the phone survey, following the National
Statement on Ethical Conduct in Human Research 2007 and the Australian Code for the Responsible
Conduct of Research.
Species identification and verification
The monitoring program sought to collect high-quality data on species composition. Fisheries
Queensland monitoring staff were trained in shark species identification and provided with a range of
learning tools to minimise species identification errors in the field. Further, species identification in the
field was validated post sampling using photographic samples and genetic samples.
Visual species identification training and competency checks
Morphological based species identification is a practised skill. A suite of training materials was
developed to assist monitoring staff competently identify shark species using morphological features
and taxonomic keys. Fishery Monitoring staff initially participated in practical workshops hosted by
both researchers with high levels of experience in shark identification, and the Ichthyology curator at
the Queensland Museum. During the workshops, staff encountered a large variety of species of both
fresh and preserved samples. Monitoring staff then completed two further practice tasks, identifying
sharks from sets of 40 and 20 photos respectively, using taxonomic keys.
Monitoring of Queensland’s shark catch for the net fishery, Department of Agriculture and Fisheries, 2021 11Figure 5 A series of photographs illustrating at-sea data collection capturing the variation of fishery
operations that interact with shark
Fisheries Queensland’s monitoring staff also completed a series of desktop-based training and
competency testing modules specifically developed for the program. Species commonly encountered
in inshore net fishing operations were split into five groups with a training module and an
accompanying competency quiz available for each (Figure 6). The five groups cover:
• blacktip whaler species (6 species)
• hammerhead species (4 species)
• medium to large bodied whaler species (8 species)
• weasel sharks and small bodied whaler species (8 species)
• whitetip and iconic shark species (9 species)
The training modules help staff commit to memory species-specific anatomical features for 35
species. The testing modules employ a variety of question formats including both visual and text-
based questions to identify gaps in staff knowledge. Fishery monitoring staff complete a competency
check at least once annually and were encouraged to retrain after any break from fieldwork. If a result
lower than 80% is achieved on any quiz, staff are encouraged to spend more time training on the
related species group before retesting.
It is helpful to reference various published identification guides for shark and ray identification as each
guide can highlight different features and images. Reference materials, including Last and Stevens
(2009), Compagno et al. (2005) and Ebert et al. (2013), were used to aid both field identification and
identification of the photographic samples. In addition, a desktop-based non-linear key ‘Shark and
Ray ID Assist’ (Queensland Shark and Ray ID tool - Lucid Web Player (lucidcentral.org) was
developed and used to assist with species identification of the photographic samples. The tool is
based on knowledge compiled from existing taxonomic reference materials and is built in Lucid
(Figure 7). The mobile app version of ‘Shark and Ray ID Assist’, is in test phase and is capable of
working on the IOS and Android systems.
Monitoring of Queensland’s shark catch for the net fishery, Department of Agriculture and Fisheries, 2021 12Figure 6 An example competency test hosted in Microsoft Forms, allowing for online distribution and
automated feedback. A variety of question formats were used, incorporating both visual and text-
based questions
Photographic samples
Photographic samples are collected to address a few purposes, including:
• verifying field species identification
• identifying species on return from the field when monitoring staff require assistance with
positive identification of particularly challenging samples
• cross-referencing with the genetic species identification results.
In addition, photographic samples that have an accompanying genetic sample can be used in a
genetically verified image reference library.
Genetic species identification
Genetic samples are collected to verify the monitoring staff’s visual identification of sharks in the field.
Genetic samples are also collected to enable species identification where a visual identification was
not possible. For example, where the animal is incomplete (i.e. a trunk or barrel, Figure 3) or visual
identification is inconclusive to a species level.
The genetic sample is taken from the animal’s fin or body. Mitochondrial DNA is extracted from the
tissue, and the NADH dehydrogenase subunit 4 gene (NDH4) is amplified using polymerase chain
reaction (PCR). Purified PCR product is sent to a third party for Sanger Sequencing. For each
sample, sequence data is checked by eye, converted into consensus sequences using Geneious R11
(Geneious, 2018 https://www.geneious.com) and compared to reference sequence data using
GenBank (Figure 8). The genetic laboratory methods are described in detail in the Biological
Sampling Protocol: Shark, 2018-2020 (Fisheries Queensland 2019).
Monitoring of Queensland’s shark catch for the net fishery, Department of Agriculture and Fisheries, 2021 13Figure 7 Development of the Shark and Ray ID Assist tool Monitoring of Queensland’s shark catch for the net fishery, Department of Agriculture and Fisheries, 2021 14
Figure 8 Processing of genetic samples for species identification L-R (Top to Bottom): fin clip
samples. Extraction of mitochondrial DNA for polymerase chain reactions (PCR). Preparing gel
electrophoresis prior to enzymatic purification and sequencing. Analysis of sequencing results (in
Geneious) and plotting sequence divergence for species identification

Verification and quality assurance of the data
After each sampling event, monitoring staff undertake detailed data verification and checking. Care is
taken to ensure photographic samples and genetic samples are stored correctly and to remove field
data recording errors before data entry. For retained catch sampling at a seafood processor, the
fisher is contacted directly to verify the catch data and to check the data collected is a representative
sample of the fishers catch and not from a partial or graded catch. This is an important step as some
fishers will split their catch into ‘A’ grade and ‘B’ grade or send different product to different markets.
These splits can be based on species or size, which would bias the data if only one part of the catch
was sampled.
Where a species identity was not assigned visually in the field, the photographic samples are
consulted by trained staff to determine a species identity. Spot checks were also made to corroborate
the morphological species identity assigned in the field. Focusing on commonly misidentified species,
photographic samples are randomly cross-checked for species identification and compared to that
assigned in the field.
Entered data is checked using a range of tools developed specifically by Fisheries Queensland's
fishery monitoring team and includes a visual comparison of the raw dataset against the database as
well as a suite of checking queries.

Monitoring of Queensland’s shark catch for the net fishery, Department of Agriculture and Fisheries, 2021   15
Results
Supplementary documents to this report that cover procedural details of sampling and data handling,
as well as further technical data summaries, are available on request.

Program overview
The shark monitoring program provided a detailed investigation of the catches of shark in the ECIFFF
and GOCIFFF (Figure 9). The program addressed its core objectives of collecting data on the species
composition of the retained shark catch and developing a profile of the discarded shark catch within
the ECIFFF and GOCIFFF. Monitoring staff collected data from 202 retained catches and observed
601 individual rob events between 2018 and 2020. Across the program, 28 species of shark were
recorded in the monitoring data with the most frequently encountered species being the Australian
blacktip (Carcharhinus tilstoni, 21% of the program records by number), the spot-tail shark (C. sorrah,
17%), the common blacktip (C. limbatus, 12 %) and the Australian sharpnose shark (Rhizoprionodon
taylori) (9%). Together these species constituted 59% of the total program records by number. The
scalloped hammerhead (Sphryna lewini) was the most frequently encountered hammerhead species
in the data and contributed 7% of the total program records by number. The great hammerhead (S.
mokarran) and the winghead shark (Eusphyra blochii) each made up 1% of total records. Only one
smooth hammerhead (S. zygaena) was recorded in the monitoring program.

Figure 9 Monitoring program sampling overview

Across the program 8200 individual records were documented, when scaled for the percentage of the
catch representatively sampled, this represents a sample of 12 269 individuals. Of the 8200 animals
recorded, 8131 were shark species in Queensland catches, representing a scaled sample of 12 242
individual sharks. Of these records, 6878 (85%) had either genetic samples (5908) or images (970)
recorded to enable verification of species identity. Records, where the species identity remained
unknown, constituted 0.4%. Further to this, three samples could only be identified to the family level
(two = Orectolobidae, one = Sphyrnidae). In addition, C. tilstoni, C. limbatus and their hybrids are
recorded as a species complex in the data. An accurate split of C. tilstoni, C. limbatus and their
hybrids using CO1 was not attempted in the current study and these are grouped in the data as C.
tilstoni/limbatus complex for reporting purposes (see section on Genetic Species Identification for
further details).

Monitoring of Queensland’s shark catch for the net fishery, Department of Agriculture and Fisheries, 2021   16
The monitoring program did not separately record data on species of conservation interest (SOCI). If
a SOCI interaction did occur, staff reminded fishers of their SOCI reporting obligations. SOCI shark
species (white shark, shortfin mako, grey nurse shark or speartooth shark) were not observed in the
sampled retained or non-retained catch.

The smallest shark recorded in the program was a 35 cm (TL) Australian sharpnose shark. The
largest shark was a 310 cm (TL) scalloped hammerhead, followed by a 295 cm (TL) great
hammerhead. Multiple length measures (e.g. fork length, pre caudal length, total length and
interdorsal length) were taken for over 3300 individuals to establish length conversions. These length
conversions are useful for those records where a total length could not be recorded (e.g. where the
product form was a trunk or barrel). Length data is sufficient to provide a species length frequency for
at least ten species (e.g. spot-tail shark, scalloped hammerhead, blacktip sharks – C. tilstoni/limbatus
complex, bull shark, milk shark, Australian sharpnose shark, spinner shark, creek whaler, great
hammerhead and pigeye shark).

The monitoring data can be used:
     • to identify the species composition of the retained catch including seasonal patterns and
         regional trends
     • to identify size composition, sex ratio and maturity profiles for the retained catch overall and
         for more than eight species (spot-tail shark, scalloped hammerhead, blacktip shark C.
         tilstoni/limbatus complex, milk shark, Australian sharpnose shark, spinner shark, bull shark,
         pigeye shark)
     • to profile the species composition of the accessible non-retained (discarded) catch including
         seasonal patterns and regional trends
     • to profile the size composition, sex ratio, maturity, and fate characteristics for the accessible
         non-retained (discarded) catch
     • as a library of shark genetic tissue samples, extraction samples and sequence samples for
         use in future research projects, including shark population characteristics for 13 species
     • as a library of genetically validated species images for use in future species identification
         tools or machine learning identification projects.
A variety of regional, temporal and fishery strata are available for examining the monitoring data. For
this report, data will be primarily presented at the regional strata of shark quota regions (GOC, GBR,
SEC) and temporal strata of sampling year.

Genetic samples
The sequencing of genetic material collected from fin clips proved useful for determining the identity
of 28 species of chondrichthyans (26 sharks, two rays). Genetic sampling was especially critical when
monitoring staff sampled a catch that included animals missing key morphometric features (i.e. the
product form is not whole). Without this technique, sample sizes (number of catches sampled) for the
retained catch would have been greatly reduced across the entire monitoring program and confidence
in species identification data for the retained and non-retained catch would have been reduced. A
total of 5945 genetic samples were collected, of these 5913 were successfully processed through the
program (Table 2), 5908 were from sharks. Across the program only 14 samples returned a failed
sequence, and 18 samples were unprocessed as of December 2020.

Monitoring of Queensland’s shark catch for the net fishery, Department of Agriculture and Fisheries, 2021   17
You can also read