Family Companionship and Elderly Suicide: Evidence from the Chinese Lunar New Year* - web
←
→
Page content transcription
If your browser does not render page correctly, please read the page content below
Family Companionship and Elderly Suicide: Evidence from the Chinese Lunar New Year*
                                                    Hanming Fang
                             Department of Economics, University of Pennsylvania
                                          hanming.fang@econ.upenn.edu
                                                      Ziteng Lei
                      Department of Economics, University of California, Santa Barbara
                                             ziteng_lei@umail.ucsb.edu
                                                       Liguo Lin
              Institute for Advanced Research, Shanghai University of Finance and Economics
                                            lin.liguo@mail.shufe.edu.cn
                                                      Peng Zhang
         School of Management and Economics, The Chinese University of Hong Kong, Shenzhen
                                              zhangpeng@cuhk.edu.cn
                                                       Abstract
Mental health problems among the elderly have attracted increasing attention. The most serious mental health
problems may result in suicide, and lack of family companionship is often speculated to be a major cause. In this
paper, we use high-frequency suicide rate data and utilize a novel temporal variation in the lunisolar calendar to
provide evidence on the protective effects of the Chinese Lunar New Year (when the elderly people receive
unusually high level of family companionship) on elderly suicide. We find that elderly suicide rate decreases by
8.7% during the Chinese Lunar New Year. In addition, the protective effects are stronger in counties where the
typical level of daily family companionship for the elderly is lower. By contrast, we do not find similar protective
effects for young and middle-age cohorts. We consider a variety of alternative mechanisms, and conclude that
family companionship is an important channel for the protective effects of the Chinese Lunar New Year. Our
study calls for greater attention to the mental health status and suicide problem of the elderly, especially with the
rapid population aging and increasing prevalence of the “empty-nest” elderly in developing countries.

Keywords: Elderly suicide, mental health, family companionship, China

JEL Classification: J14, I12

*
  We thank Lucas Davis, Shelly Lundberg, Mike Orszag, Eric Zou, and seminar and conference participants at 2020 CUHK-
Shenzhen SME Research Conference, UCSB Applied Research Group, Penn Chinese Economy Reading Group, and
International Pension Research Association (IPRA) Webinar for helpful comments and suggestions.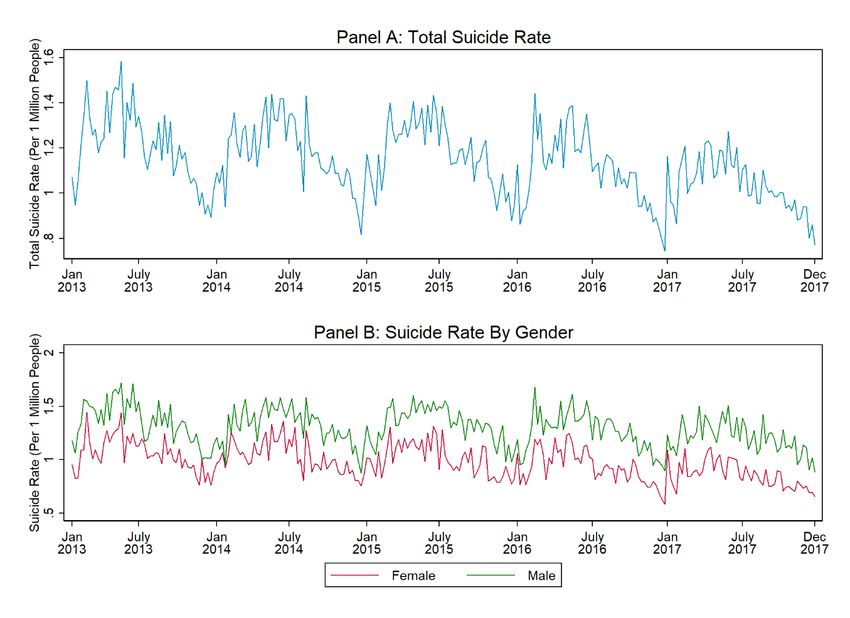
1 Introduction

    The prevalence of mental health problems and suicide among the elderly has attracted increasing attention.

Approximately 15% of adults age 60 and above suffer from mental disorders, and 6.6% of disability among

this group is attributed to mental and neurological disorders (WHO 2017).1 In the extreme form, these

mental disorder problems lead to suicide. The suicide rate is highest among people age 70 years old and

above (WHO 2014), and suicide and mental disorder are highly correlated among the elderly (Wærn et al.

2002).2 Severe mental disorder and suicide have large economic costs. For example, Shepard et al. (2016)

find that the total cost for all suicides and suicide attempts in the United States in 2013 is around $93.5

billion. The concern about mental health problems and suicide among the elderly is becoming increasingly

important as the population is aging rapidly (Bloom and Luca 2016). Between 2010 and 2050, the

proportion of the world’s population over 65 will nearly double, from 8% to 16% (WHO 2011).3 Therefore,

understanding the causes of mental health problems and suicide among the elderly, as well as providing

effective policy assistance, is urgent and crucial.4

    The concern about the mental health among the elderly is especially serious in developing countries.

Between 2010 and 2050, the elderly population in developing countries is projected to increase by more

than 250%, compared with a 71% increase in developed countries (WHO 2011). As a prominent example,

China is experiencing rapid population aging, and the share of elderly in the total population is expected to

increase from 12.6% in 2020 to 27.9% in 2050.5 At the same time, China’s national elderly suicide rates

are four to five times higher than the general Chinese population and more than twice the global average

(Li et al. 2009, Chen and Fang 2018). With rapid urbanization and increased internal migration, the

proportion of the “empty-nest” elderly who are left-behind also increases dramatically, from 50% in 2010

1
  https://www.who.int/news-room/fact-sheets/detail/mental-health-of-older-adults.
2
  https://www.who.int/mediacentre/news/releases/2014/suicide-prevention-report/en/.
3
  https://www.who.int/ageing/publications/global_health/en/.
4
  There is no absolute cutoff for the start age of the elderly people. Throughout the paper, we refer to the elderly people as
individuals age 65 or above.
5
  https://baijiahao.baidu.com/s?id=1679779779278495724&wfr=spider&for=pc (in Chinese).

                                                                  1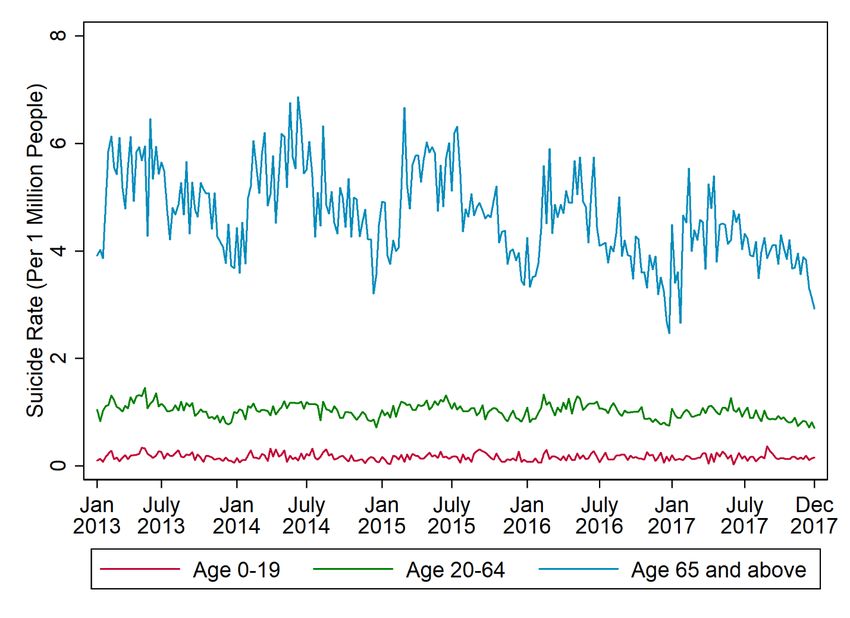
to nearly 90% in 2030.6 Therefore, the mental disorder and suicide problems for the elderly are extremely

challenging in China.

    Among numerous potential reasons for elderly mental disorder and suicide, lack of family companionship

is hypothesized to be a crucial one. Many news articles suggest the importance of family companionship

for the mental health of the empty-nest elderly in China.7 However, scientific research is lacking to establish

a convincing relationship between family companionship and elderly suicide. Previous studies have mostly

provided correlational evidence (Antman 2010, Chen and Short 2008, Zurlo et al. 2014) or suggested the

relationship between family companionship and the mental health of the elderly (Chen and Fang 2018).8 In

addition, those studies often hypothesize similar effects of family companionship for mental disorder and

for suicide (Chen and Fang 2018).

    In this study, we provide more direct evidence on the relationship between family companionship and

elderly suicide, using the Chinese Lunar New Year (hereinafter referred to as “CLNY”) as a social

experiment. The CLNY is one of the most important holidays in China, with family reunion as the most

central customs. Approximately 3 billion trips are being made each year during the “Spring Festival travel

rush” around the CLNY to reunite with families.9 During the CLNY, the elderly people, on average, receive

a considerably higher level of family companionship than normal weeks in the year. Our paper proceeds in

two steps. First, we estimate a causal effect of the CLNY on the elderly suicide rate. Second, we provide

suggestive evidence that increased family companionship during the CLNY is the main channel for the

reduction in elderly suicide rate.

6
  http://www.15lu.com/shijie/6158.html (in Chinese).
7
  For some examples, see https://opinion.huanqiu.com/article/9CaKrnJREXR, http://www.yidianzixun.com/article/0PVg0gE4,
and http://news.sohu.com/20100714/n273498420.shtml (in Chinese).
8
  Chen and Fang (2018) use the family planning policy in China and find that the family planning policy leads to fewer children
and worse mental health of the elderly, suggesting the importance of reduced family companionship for the elderly due to the
family planning policy. Antman (2010) finds that a child’s migration to the US is associated with a greater chance that his elderly
parent in Mexico will be in poor physical and mental health, also suggesting the importance of family companionship on the
mental health of the elderly. Chen and Short (2008) find that living alone is associated with lower subjective wellbeing of the
elderly, whereas co-residence with immediate family is associated with positive subjective wellbeing of the elderly in China.
Zurlo et al. (2014) find that family, community, and public support are significantly and negatively associated with depressive
symptoms of the Chinese elderly.
9
  https://baike.baidu.com/item/%E6%98%A5%E8%BF%90/329360#15 (in Chinese).

                                                                2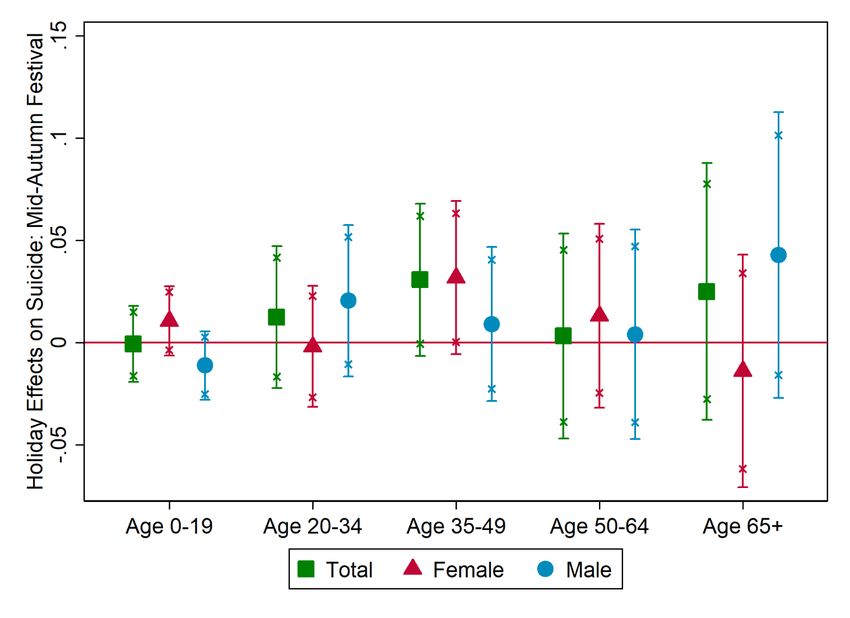
We use a uniquely grand new dataset from the Chinese Center for Disease Control and Prevention (CCDC),

which contains county-week suicide rate data by gender and age cohorts from 2013 to 2017. To distinguish

CLNY effect from a calendar week effect, we utilize a novel exogenous variation in the timing of the CLNY

because of the traditional Chinese lunisolar calendar. For example, during 1991–2020, the CLNY fell 11

times in January and 19 times in February, fell 4 times in the 3rd week, 6 times in the 4th week, 8 times in

the 5th week, 7 times in the 6th week, and 5 times in the 7th week of the year. Our identification strategy is

to compare the elderly suicide rates in otherwise similar weeks whose treatment status differs because of

the Chinese lunisolar calendar conditional on other flexibly temporal controls.

 We find that the elderly suicide rate decreases by 8.7% (or 0.52 cases per 1 million people) during the

CLNY, when the elderly people receive unusually high level of family companionship. We refer to this as

the protective effect of the CLNY. The effects are pronounced and are of similar magnitude for men and

women. By contrast, we do not find similar protective effects of CLNY for young and middle-age cohorts,

indicating that income shocks or underreporting are unlikely to drive all of our results.

 We utilize the geographical variations in the average daily family companionship that the elderly typically

receives throughout the year to provide suggestive evidence on the mechanisms underlying the protective

effect of the CLNY. We construct proxy measures of average daily family companionship for the elderly

based on the living arrangements with their children using two data sources, namely, individual-level data

from the 2010 Census, and 2011 China Health and Retirement Longitudinal Study (CHARLS) survey data.

We find that the protective effects of the CLNY for the elderly are stronger in counties with a lower level

of average daily family companionship, where the elderly people are expected to receive a more dramatic

increase in family companionship during the CLNY. A one standard deviation increase in the average daily

family companionship for the elderly people in typical weeks of the year reduces the protective effects of

the CLNY by 5%–7%. We also show that the alternative mechanisms, including short-term population

flows, symbolic effects of holidays, and self-discipline of the elderly, cannot fully explain our results.

                                                      3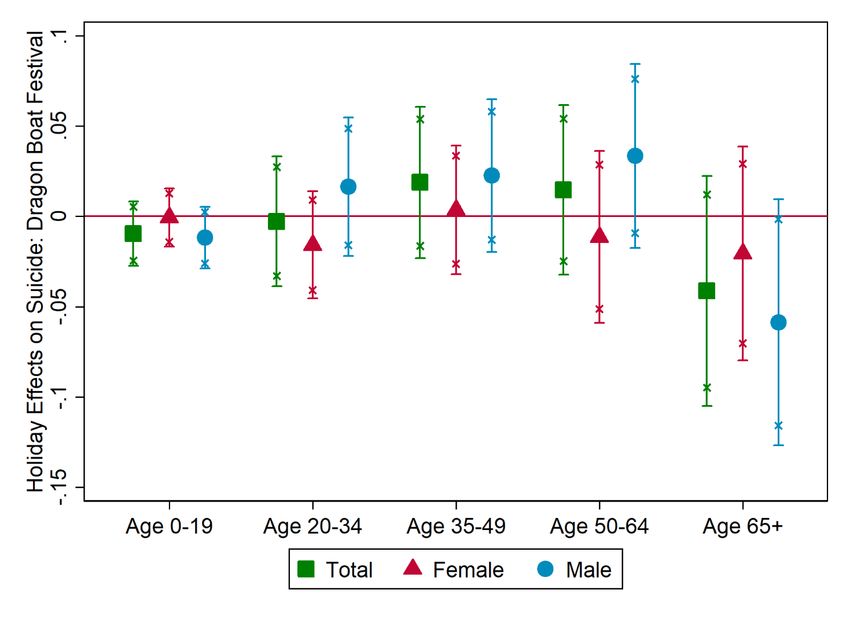
Next, we investigate the dynamic effects of the CLNY on elderly suicides by directly estimating the

treatment effects of weeks before and after the CLNY. We find that the protective effects start to emerge

two weeks prior to the CLNY weeks, and some weak evidence shows that female elderly suicide rate may

increase in the subsequent 1 to 2 weeks after the CLNY week. However, the average of the treatment effects

within the two-month window is -5.7% and statistically significant. These results suggest that the protective

effects are not fully offset by the temporal displacement and separation anxiety effects, and the extra family

companionship during the CLNY generally reduces elderly suicides, rather than simply postponing them.

 Finally, we use CHARLS data to examine whether children are aware of the importance of the

companionship, and how they respond to the deterioration of their elderly parents’ mental health. We find

that children may be aware of the mental health deterioration of their elderly parents and respond by

increasing wealth transfers to their parents. However, they are less likely to adjust their living arrangements

and provide more daily companionship. Overall, our results indicate that public policies calling for the

attention on family companionship for the elderly parents are urgently needed.

 The contributions of this study are two-fold. First, we contribute to the literature on family companionship

and the mental health of the elderly, and to the broad literature on the causes of mental disorder and suicide

(Case and Deaton 2015, Zou 2017, Carleton 2017, Burke et al. 2018, Pierce and Schott, 2020). We suggest

the relationship between family companionship and elderly mental health from a novel perspective, and

extend the previous literature by directly examining the effects on suicide. Second, we contribute to the

literature on the holiday effects on suicide (Jessen and Jensen 1999, Nishi et al. 2000, Beauchamp et al.

2014). We improve the identification by utilizing a novel timing variation of lunisolar calendar holidays

across different years to control for confounding temporal trends and provide convincing causal estimates.

 The remainder of this paper is organized as follows. In Section 2 we briefly introduce the background of

the Chinese Lunar New Year. In Section 3 we describe the data and the empirical strategy and present our

main results and discusses alternative explanations in Section 4. Finally, in Section 5 we conclude.

                                                      4
2 Background
The Chinese Lunar New Year (the Spring Festival) is the Chinese festival that celebrates the beginning of
a new year on the traditional Chinese lunisolar calendar. It is one of the most important holidays in China
(also in neighboring countries such as Korea and Vietnam). It is also celebrated worldwide in regions and
countries with significant overseas Chinese population, including Singapore, Indonesia, and Malaysia, as
well as many in North America and Europe.10 In China, the CLNY is a statutory holiday that starts from
the day before the New Year’s Day (Lunar New Year’s Eve) and lasts for seven consecutive days. The
exact timing of the CLNY varies across different years because of the variation generated by the Chinese
lunisolar calendar.
The CLNY is associated with many rituals and customs. The most important one is family reunion, similar
to Thanksgiving in the United States. The evening preceding the Chinese New Year’s Day is frequently
regarded as an occasion for Chinese families to gather for the annual reunion dinner. Around 3 billion trips
are being made each year during the Spring Festival travel rush around the CLNY to reunite with families.
Other rituals include house cleaning, paper-cutting, and lighting firecrackers, all having the meaning of
welcoming good luck.
3 Data and Empirical Strategy
3.1 Data
The main dataset used in this study is county–week suicide rate data by gender and age cohorts from the
CCDC. The sample covers 597 counties (if in rural area) or districts (if in urban area) (6-digit administrative
code) under the Disease Surveillance Point (DSP) system from 2013 to 2017.11 The system collects death
10
https://en.wikipedia.org/wiki/Chinese_New_Year.
11
The administrative division from high to low in China is follows: provinces/municipalities (2-digit administrative code),
prefectures (4-digit administrative code), counties/districts (6-digit administrative code).
5records from the surveillance locations and is representative at provincial and national levels. Under the
DSP system, deaths that occurred in hospitals and at homes are reported, and the causes of death are
determined according to a standard protocol by trained staff located in local hospitals or CCDC branches.
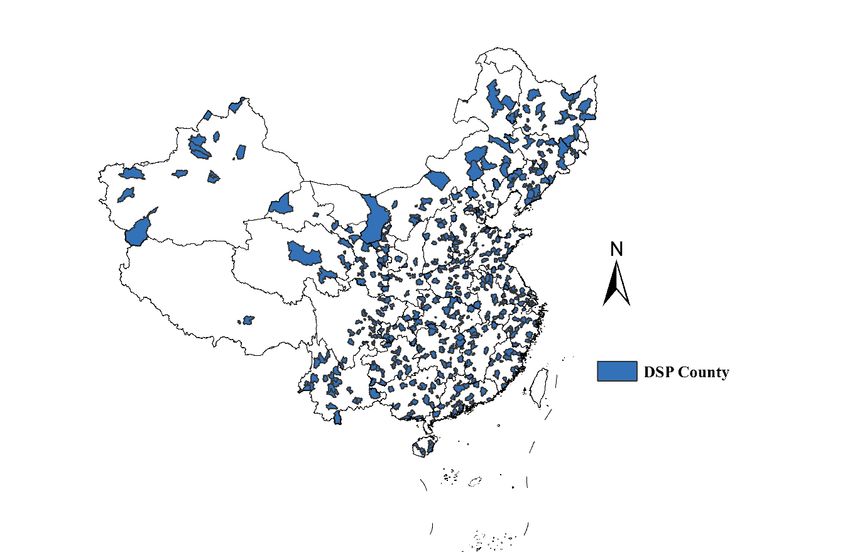
The DSP system covers more than 324 million people in China, accounting for 24.3% of the country’s
population. Figure 1 shows the geographical distribution of the counties/districts under the DSP system,
which illustrates the representativeness of our sample.
[Figure 1 About Here]
We also use two additional datasets to construct the proxy measures of average daily family
companionship for the elderly. The first data source is the microdata of the 2010 Chinese Population Census.
The dataset contains 4,400,367 individual observations, which are randomly drawn from the total
population in 2010. The dataset contains information on the number of people registered in the household,
which we refer to as household size, and we use the average household size of the elderly people at the
prefecture level (4-digit administrative code) as a proxy for the average level of daily family companionship
that the elderly people receive.12
The second data source is the CHARLS survey data, which contains detailed information on the living
arrangements of children of the elderly. CHARLS aims to collect a high-quality nationally representative
sample of Chinese residents age 45 and older. The baseline national wave of CHARLS was fielded in 2011
and includes about 10,000 households and 17,500 individuals in 150 counties/districts.13 We construct two
measures on daily family companionship. The first is the proportion of children living in the household.
For example, if a household has four children, and two of them live with the elderly parents, we define the
proportion for the household as 50%. We then take the average for all households in the prefecture. The
second is the proportion of the elderly people with at least one child living in the same household; that is,
we define a dummy variable that equals 1 if at least one child lives in the household, and then take the
12
We do not average at the county level because there are only a few individual observations in the county.
13
The CHARLS data can be accessed at http://charls.pku.edu.cn/index/en.html.
6average for all households in the prefecture.14 Note that these variables are measured at prefecture level (4-
digit administrative code) because only prefecture codes are publicly available for the CHARLS data, and
then matched with the counties or districts (6-digit administrative code) under that prefecture in our sample.
On average, each prefecture is linked with less than 2 counties in our sample. The underlying assumption
is that prefecture-level measures are good proxies for the characteristics of counties and districts within the
prefecture. These measures may contain classical measurement error, and our estimates may be biased
toward 0. Therefore, our estimates may serve as a lower bound for the true effects. More detailed
discussions are in Section 4.
Another assumption is that the elderly people receive more family companionship if they have children
living in the same household. Moreover, the variations in these proxy measures are cross sectional and only
capture the geographical variation in the average daily family companionship for the elderly, potentially
due to differences in labor markets, migration tendency, and social security service across different regions.
3.2 Empirical Strategy
We consider the fact that the timing of the CLNY varies across different years to estimate the causal
effects of the CLNY on suicide. The main specification is as follows:
!!"#$ = # + %&'(!"#$ + )! + *" + +# + ρ$ + ε!"#$ ,
where !!"#$ is the outcome variable of county . in year /, month 0, and week 1. Each observation is a
county–week combination. &'(!"#$ is a binary variable that equals 1 if the week of observation is during
the CLNY. The observation is at the week level that starts on Sunday and ends on Saturday, and the statutory
holidays of the CLNY last for seven days, which usually do not perfectly coincide with a Sunday–Saturday
14
We use baseline survey (2011) of CHARLS to construct the measures because they are closely comparable to measures
constructed from the microdata of the 2010 Population Census, and the baseline survey is most comprehensive and
representative.
7week. Thus, we define the week as in the CLNY if at least part of the week contains the statutory holidays.
Figures A1–A3 provide an illustration. As shown in Figure A1, the CLNY in 2013 was on February 10,
and February 9–15 were statutory holidays. Therefore, the two weeks in red in the calendar (February 3–9
and 10–16) are defined as in the CLNY. Figure A2 illustrates the case for 2016, when the statutory holidays
perfectly coincide with a Sunday–Saturday week (February 7–13), and it is thus the only week defined as
in the CLNY in 2016. The year 2016 is the only year in the sample that shows perfect coincidence and has
only one week defined as in the CLNY, whereas the other years all have two weeks defined to be in the
CLNY. To ensure that our results are not contaminated by week lengths, we conduct a robustness check by
excluding 2016, and our results are robust. Similarly, Figure A3 illustrates the case for 2017, when the
CLNY was in January, and two weeks (January 22–28 and January 29–February 4) are defined as in the
CLNY. It illustrates the temporal variation of the CLNY within our sample period, that is, the CLNY may
happen in different weeks and months across different years.
The main outcome of interest is suicide rate. We specify the inverse hyperbolic sine of suicide cases per
1 million people as the dependent variable. The inverse hyperbolic sine function, 345(7) = 9:;(7 +
√1 + 7 % ), is approximate to log function that the marginal effects can be interpreted as percentage changes
for small changes, but the function is well-defined at 0. This measure is commonly used in the literature
(Barreca et al. 2017, Card and Della Vigna 2017). We prefer the inverse hyperbolic sine model because
suicide is a rare event, and around 82% of the county-week observations have zeros in elderly suicide rate.15
Nevertheless, our results are robust if we use raw suicide rate.16
We include year fixed effects *" , month fixed effects +# , and week-of-month fixed effects >$ to control
for the possible time trends and seasonality of suicide.17 We also control for county fixed effects )! to
15
Throughout the rest of the paper, we use the inverse hyperbolic sine of suicide rate as the dependent variable unless explicitly
specified.
16
An alternative approach to model suicide events is to use nonlinear count models such as Poisson regression. However, as
discussed in Carleton (2017), modeling the data generating process as Poisson imposes the restriction that the mean and variance
of the suicide rates are identical, which is not the case in our sample, as shown in Table 1. Therefore, we do not report results of
nonlinear count models, but our results are still robust when using Poisson regression.
17
A strong temporal pattern and seasonality is observed in suicide rate, as shown in Figures 2 and 3.
8control for time-invariant differences across counties. The regression is weighed by county population, and
the standard errors are clustered at the county level.
Our identification strategy is that the timing of the CLNY is based on the traditional Chinese lunisolar
calendar, which varies across different years and allows us to address the potential confoundedness of
temporal trends by flexibly controlling for temporal fixed effects. Table A1 presents the distribution of the
timing of the CLNY in the past 30 years (1991–2020). The CLNY fell 11 times in January and 19 times in
February. The timing ranges from the 3rd week to the 7th week of the year, and the distribution is more or
less random. The temporal variation allows us to compare otherwise similar weeks whose treatment status
differs because of the Chinese lunisolar calendar. The assumption is that the potential temporal trends in
suicide are absorbed by temporal fixed effects based on the solar calendar.
One may be concerned that the temporal trends are based on the Chinese lunisolar calendar rather than the
solar calendar. We cannot test this hypothesis because our suicide data are based on the solar calendar.
However, Martin et al. (1992) find little evidence on the relationship between lunar cycles and suicide
attempts and completions. In addition, most individual and social activities are arranged based on the solar
calendar in China; thus, arguably, most time trends are absorbed by time fixed effects based on the solar
calendar. By contrast, most previous studies examining the holiday effects on suicide (Nishi et al. 2000,
Beauchamp et al. 2014) are unable to control for temporal trends as most solar calendar holidays appear on
the same days (or the same week) every year. Therefore, their results may be confounded by temporal trends,
such as seasonality.
94 Results
We start by presenting a set of descriptive evidence of the overall pattern of the suicide rate in China.
Figure 2 depicts the temporal trends in national-level suicide rate.18 Panel A shows the temporal trends in
total suicide rate. The overall weekly suicide rate is around 1–1.5 cases per 1 million people. The suicide
rate peaks in spring and summer and falls in autumn and winter, exhibiting strong seasonality. The strong
temporal trends in suicide rate further illustrate the advantage of our research design to eliminate the
confounding temporal trends. Panel B shows the temporal trends in suicide rate by gender. The suicide rate
of female and male follows similar temporal trends. Men, on average, have higher suicide rate than women.
Figure 3 shows the temporal trends in suicide rate by age cohort. The elderly (age 65+) have considerably
higher suicide rate than middle-age adults (age 20–64) and children and teenagers (age 0–19). The weekly
suicide rate of the elderly reaches 4–6 per 1 million people, which is 4 to 5 times higher than the general
population. Table 1 shows the summary statistics of weekly suicide rate by gender and age cohorts. The
average suicide rate for the elderly is 4.44 cases per 1 million population per week in our sample, with a
standard deviation of 13.29.
[Figures 2 and 3 About Here]
[Table 1 About Here]
4.1 Correlational Evidence
We first present a set of correlational evidence to illustrate the relationship between family companionship
and elderly suicide. If family companionship is effective in preventing elderly suicide, we should observe
a lower level of elderly suicide in counties where the elderly receives a higher level of average daily family
companionship. We construct proxy measures of average daily family companionship that the elderly
people receive in different counties from two data sources. The first data source is the microdata of the
18
The weekly suicide rate is aggregated at the national level by computing the weighted average of county-level suicide rates,
with county-level population as weights.
102010 Chinese Population Census, which contains information on the number of people registered in the
household.19 Our main measure on average daily family companionship is the average household size of
the elderly people. Our alternative measure is a dummy variable which takes value of 1 if the elderly people
live in households with at least three other people. We then average the two measures at prefecture level to
match with suicide data.
We also use a separate data source, CHARLS, which collects detailed information on the living
arrangements of the children of the elderly. We calculate the proportion of children that live in the
household, averaged at the prefecture level. We also define an alternative measure as the proportion of the
elderly people with at least one child living in the same household at the prefecture level. Note that these
variables are measured at prefecture level (4-digit administrative code), and then matched with the
counties/districts (6-digit administrative code) that belong to the prefecture in our sample, assuming that
prefecture-level measures are good proxies for the characteristics of counties and districts within the
prefecture. On average, each prefecture is linked with less than 2 counties/districts in our sample.
These four different proxy measures from two data sources are highly correlated and are expected to
capture the average daily family companionship that the elderly receive in different counties. The
underlying assumption is that the elderly people receive more family companionship if they have children
living in the same household. Note that the variations in these measures are cross sectional only, and capture
the geographical variation in the average daily family companionship for the elderly, potentially due to
differences in labor markets, migration tendency, and social security service across different counties.
We regress the elderly suicide rate on these average daily family companionship measures, controlling for
temporal fixed effects including year fixed effects, month fixed effects, and week-of-month fixed effects.
Note that we cannot control of county fixed effects in these regressions because the main variables only
have county-level variations. Table 2 presents the results. We exclude observations of all counties/districts
19
When constructing the proxy measures, observations with household size larger than or equal to 10 are dropped (less than 1%
of total observations).
11of direct-controlled municipalities (including Beijing, Shanghai, Tianjin, and Chongqing), as the
administrative level of these counties/districts are higher than the normal counties/districts of prefectures
and are thus not comparable.20 We control for a set of socioeconomic characteristics of these counties in
the baseline (Columns (1), (3), (5) and (7)). 21 We also include a set of labor market and demographic
characteristics of the elderly people as additional controls to assess the robustness of the results (Columns
(2), (4), (6) and (8)).22 All these control variables and measures of average daily family companionship are
standardized to have a mean of 0 and standard deviation of 1 to facilitate interpretation.23 In addition, a
dummy indicator for being an urban district rather than a rural county is included in all columns.
[Table 2 About Here]
The results in Table 2 provide consistent evidence that elderly suicide rate is negatively associated with
the average daily family companionship. The coefficients are negative and statistically significant in most
specifications. Estimates suggest that a one standard deviation increase in the average daily family
companionship is associated with around 10% decrease in elderly suicide rate. The results are robust to
different proxy measures of average daily family companionship. In addition, we find that the elderly
suicide rate is smaller in urban districts than in rural counties and decreases with regional economic
development (GDP per capita), healthcare access (number of hospital per capita), and educational
attainment of the elderly people. These results are correlational and may not be interpreted as causal
relationships. However, the correlational evidence still suggests that family companionship may have
20
The administrative levels in China include (from high to low) province–prefecture–county/district. However, the
counties/districts of direct-controlled municipalities (including Beijing, Shanghai, Tianjin, and Chongqing) are at the prefecture
administrative level and are thus not directly comparable with other counties/districts under prefectures.
21
These socioeconomic characteristics include regional GDP per capita, average rural income, and number of hospitals per capita
of the prefecture in 2012, retrieved from the China Statistical Yearbook for Regional Economy.
22
These additional control variables include the rate of employment of the city, the proportion of immigrants among the elderly,
and the average years of schooling of the elderly, calculated from the microdata of the 2010 Chinese Population Census.
23
Note that all these variables are measured at the prefecture level. Ideally, we would like to directly use county-level
characteristics, but county-level data for all Chinese counties are unavailable. Therefore, we use prefecture-level characteristics
instead and assume that it is a good proxy for the characteristics of counties and districts within the prefecture. In fact, when
excluding all direct-controlled municipalities, there are 565 counties in 315 prefectures; thus, on average, each prefecture is
linked with less than 2 counties in our sample. These characteristics may contain classical measurement error, and our estimates
may be biased toward 0. Therefore, our estimates may serve as a lower bound for the true effects.
12important protective effects on elderly suicide, even after controlling for socioeconomic and demographic
characteristics.
4.2 Main Results
In this section, we illustrate the protective effects of the CLNY on elderly suicide. Table 3 presents the
main results. Columns (1) and (2) show the results with total elderly (65+) suicide rate as the dependent
variable. In the preferred specification (Column (1)), we use the inverse hyperbolic sine of suicide rate as
the dependent variable. We also provide results using the level of suicide rate (per 1 million people) as the
dependent variable in Column (2). These results suggest that the elderly suicide rate decreases by 8.7% (or
by 0.52 cases per 1 million people) during the CLNY. Columns (3) to (6) further show the results separately
by gender. During the CLNY, the suicide rate of the female elderly decreases by 6.3% (or 0.44 cases per 1
million people), and the suicide rate of the male elderly decreases by 6.7% (or 0.61 cases per 1 million
people), which are statistically significant.24
[Table 3 About Here]
The effects are sizable compared with previous studies on causes of suicide. Zou (2017) shows that wind
farm installation in the United States leads to a 2% increase in suicide rate in the following years. Carleton
(2017) shows that for days above 20 °C in India, a 1 °C increase in a single day’s temperature during the
growing season increases annual suicides by 0.008 per 100,000 people, which translates to increase in
suicide rate by 3.5% for a standard deviation increase in temperature. Burke et al. (2018) show that suicide
rate increases by 0.7% in the United States and by 2.1% in Mexico for a 1 °C increase in monthly average
24
Note that the effect on total elderly suicide rate is out of the convex combination of the effect on female and male elderly
suicide rate, because of the inverse hyperbolic sine transformation. The results in the level form still have the property that the
effect on total elderly suicide rate is in the convex combination of the effect on female elderly suicide rate and the effect on male
elderly suicide rate, and the results are qualitatively similar.
13temperature. Our estimates are of similar magnitude or even more pronounced compared with previous
studies.
[Table 4 About Here]
In Table 4, we further examine the effects of the CLNY on suicide rate by gender and age cohort, no
longer restricted to the elderly (65+) group. Columns (1)–(3) present the results for age cohorts 0–19, 20–
64, and 65+, respectively; and Columns (4)–(6) further divide the 20–64 group into three subgroups (i.e.,
20–34, 35–49, and 50–64, respectively). Panel A presents the results for total suicide rate, and Panels B and
C present the results for female and male, respectively. We find no evidence to suggest that the suicide rate
decreases for teenagers or middle-age people during the CLNY. The estimates are all small in magnitude
and statistically insignificant.
[Table 5 About Here]
To assess the robustness of the results, Table 5 presents the estimation results of a few variants of the
baseline specification reported in Table 3. Panels A–C present the results for total, female, and male elderly
suicide rate, respectively. We report the baseline estimates in Column (1) as a comparison. First, we test
the robustness of our treatment definition. In Column (2), instead of defining treatment status as a dummy
variable in our baseline, we define the treatment as the proportion of days in the week that are during
statutory holidays for the CLNY. The proportion variable changing from 0 to 1 indicates changing from the
case that no day in the week is during statutory holidays to the case that all seven days in the week are
during statutory holidays. The results are qualitatively similar, suggesting that the elderly suicide rate
decreases by 9.8% if the whole week is during the statutory holidays of the CLNY.
Second, we test the robustness of temporal fixed effects. One may be concerned that month fixed effects
and week-of-the-month fixed effects cannot sufficiently capture the temporal trends in suicide rate, as the
first week of the month may have different effects in different months. Therefore, in Column (3), we
consider a more conservative specification and replace week-of-the-month fixed effects with week-of-the-
14year fixed effects, which fully captures the temporal trends across weeks in a year. The results are generally
smaller and less precisely estimated, because the residual variation is smaller in the more saturated model.25
However, we still find a 5.7% decrease in total elderly suicide rate during the CLNY, and it is statistically
significant at the 5% level.
Third, we test the robustness of weighing the regression. Our baseline weighs the regression by county-
level population. In Column (4), we do not weigh the regression. We expect to find similar results because
the variation in treatment does not change at the county level; thus, weighing should matter less as we
already control for county fixed effects. The results are consistent with our expectation.
Fourth, we test the robustness of clustering of standard errors. Our baseline model clusters standard errors
at the county level, which controls for autocorrelation within each county. In Column (5), we cluster the
standard errors at the province level to control for both auto and spatial correlation within each province,
and we obtain similar results because the treatment does not vary across geographical units. In Column (6),
we use two-way clustering at the county and week levels to control for autocorrelation within each county
and spatial correlation within each week. Our results are generally robust.
Lastly, we test the robustness of sample construction. In Column (7), we exclude observations of year
2016, because this is the only year that the statutory holidays perfectly coincide with a Sunday–Saturday
week, such that only one week in the year is defined to be during the CLNY. The results are highly similar.
In Column (8), we exclude observations of all counties/districts of direct-controlled municipalities, because
the administrative level of these counties/districts are higher than the normal counties/districts of
prefectures. We lose approximately 5% of observations, but the results are similar. Finally, as shown in
Table A1, the CLNY mostly happen during January and February, and one may be concerned that weeks
in other months are incomparable. Thus, we restrict the sample to only weeks in January to February in
Column (9), and the results are similar.
25
Thus, we do not choose this model as the baseline model.
154.3 Heterogenous Effects and Mechanisms
As family reunion is the most important custom of the CLNY, increase in family companionship and
emotional support from family members is the largest change for the elderly people during the CLNY. To
reunite with families, around 3 billion trips are being made each year during the Spring Festival travel rush
around the CLNY. Survey evidence suggests that 80% of people go back home to reunite with their families,
and 70% agree that family reunion during the CLNY is a traditional custom and they keep celebrating with
families every year.26 Therefore, we can hypothesize that family companionship is one important channel
for the protective effects of the CLNY on elderly suicide documented in Tables 3 and 5. However, many
other contemporaneous changes also occur during the CLNY, which makes it difficult to precisely pinpoint
the family companionship as the only driver for the protective effects of the CLNY for the reduction in the
elderly suicides. Indeed, our intention is not to argue that family companionship is the only channel for the
protective effects of CLNY on the elderly. In this section, we examine heterogeneous effects across
geographical regions and provide suggestive evidence that at least the family companionship mechanism is
one of the key channels. The other competing mechanisms may also be operating, but they alone cannot
explain the set of facts we documented in this paper.
The key fact we consider is that change in family companionship during the CLNY is not homogeneous
for all the elderly people. For the elderly who do not live with children in the same household and receive
low level of daily family companionship, the change in family companionship during the CLNY is
considerably more dramatic. Therefore, in counties where the elderly people receive a lower level of daily
family companionship, on average, the aggregate protective effects should be larger.27
26
http://finance.sina.com.cn/consume/xiaofei/2018-02-13/doc-ifyrpeie1483601.shtml (in Chinese).
27
Ideally, we would like to investigate whether the protective effects of CLNY are different for individuals living in households
with different sizes, but no such individual-level data are available in the Chinese context. Therefore, we can only investigate the
relationship at the aggregate (i.e. county) level.
16[Table 6 About Here]
We examine the hypothesis in Tables 6 and 7. We regress elderly suicide rate on the interaction term of
the CLNY dummy and proxy measures of average daily family companionship, and we hypothesize that
the coefficient of the interaction term should be positive (i.e., the protective effect of the CLNY is less
pronounced in counties with more daily family companionship). In this part of the analysis, again, we
exclude observations of all counties/districts of direct-controlled municipalities. In Columns (1) to (4) of
Table 6, we use the average household size as the proxy measure. In Columns (5) to (8), we measure daily
family companionship using the proportion of the elderly people living in household with at least three
other people. In all regressions, we include the proxy measure itself, the interaction, the CLNY dummy, a
dummy variable for whether the unit is rural county or urban district, and the interaction between the CLNY
dummy and the urban-rural dummy.28 We also control for the year, month, and week-of-month fixed effects.
We start with omitting county fixed effects and economic controls in Column (1). We find that the
interaction term is indeed positive and statistically significant, which agrees with our hypothesis. In Column
(2), we control for the county fixed effects, and thus the cross-sectional measure of average daily family
companionship is omitted. The results are highly stable. In Columns (3) and (4), we further include
interaction terms of the CLNY dummy and other county characteristics, including regional GDP per capita,
average rural income, number of hospitals per capita, employment rate, the proportion of immigrants among
the elderly, and the average years of schooling of the elderly, to allow for heterogeneous effects. The results
on the interaction term of the CLNY dummy and proxy measures of average daily family companionship
are robust to the inclusion of these additional interaction controls. More importantly, the estimates on the
other additional interactions controlling themselves are insignificant, thereby suggesting that heterogeneity
in daily family companionship plays a dominant role.
28
Our results are robust if we drop the urban dummy and the urban-CLNY interaction.
17In Columns (5) to (8), we repeat the same analysis but use the proportion of the elderly people living in
household with at least three other people as the proxy measure. The results are robust to this alternative
measure. Overall, the results in Table 6 suggest that a one standard deviation increase in the proxy measure
of the average daily family companionship for the elderly reduces the protective effects of the CLNY by
5%–7%.
[Table 7 About Here]
One may be concerned that the household size constructed from the census data is not a good measure on
daily family companionship. Here, we repeat the analysis using a more direct measure, which is the
proportion of children living in the household, from CHARLS. Note that CHARLS only covers around 100
prefectures; thus, the sample size is reduced by more than a half. In Column (1) of Table 7, we first repeat
the main regression using the subsample. We find a significant yet considerably larger effect than the full-
sample estimate. In Columns (2) to (5), we repeat the same analysis as in Table 6, and we find significantly
positive estimates on the interaction terms between the CLNY dummy and the proxy measure. Through
Columns (6) to (9), we use a dummy variable on whether having children living in the household as the
proxy measure and find similar effects. These results suggest that a one standard deviation increase in the
measure of the average daily family companionship for the elderly people reduces the protective effects of
the CLNY by 6%–9% in this subsample. We also repeat these analyses by gender and report them in Tables
A2–A5. The results are qualitatively similar, and the effects are more pronounced for elderly men.
Although there may exist alternative explanations for the protective effects of the CLNY, the alternative
explanations should be able to explain several important aspects of our main finding as follows:
(1) The suicide rate of the elderly is reduced during the CLNY.
(2) No change is observed in the suicide rate of other age groups.
(3) The protective effects decline as the average daily family companionship for the elderly increases.
18Now, we discuss several competing explanations as follows.
Short-run population flows and Spring Festival travel rush
One potential explanation for the reduction of the elderly suicide rate during the CLNY is short-term
travels. Billions of individuals in China travel during the CLNY season to reunite with their families.29 The
reduction of suicide rate may simply reflect that individuals travel out of counties and will not be recorded
as committing suicide in the county. However, this hypothesis is unlikely to explain the results for several
reasons. First, the protective effects are only for the elderly group, which is the least likely group to
participate in the Spring Festival travel rush. Children of the elderly are more likely to travel to visit the
elderly, instead of the other way around. Second, as shown in Tables 6 and 7, the protective effects do not
change with the proportion of the elderly immigrants (as a proxy for the intensity of potential outflows
during the Spring Festival travel rush). Therefore, short-term population flows are unlikely to explain the
results.
Changes in income during the CLNY
Another competing explanation is that the income of the elderly may change during the seven-day
statutory holiday. However, most of the elderly group has already retired and is unlikely to face income
shocks or other labor market shocks during the CLNY.30 In addition, we find no effects for the middle-age
group who is more likely to face labor market shocks. Therefore, labor market shocks cannot explain the
results. Another potential source of income shock is the custom of giving “red-envelope money” and gift
giving during the CLNY.31 The elderly people may give out red-envelope money to their children and their
grandchildren or may also receive red-envelope money from their children who have jobs, and the net
wealth change due to the exchange of red-envelope money may depend on local customs. Nevertheless,
despite the possibility that the elderly may receive positive income shocks from red-envelope money and
29
http://www.gov.cn/xinwen/2015-03/16/content_2835003.htm (in Chinese).
30
The retirement age in China is 60 for men, and is either 55 or 50 for women depending on her occupations.
31
A red envelope (also known as hongbao) is a monetary gift usually given during the CLNY, which has the symbol of good
luck. See https://en.wikipedia.org/wiki/Red_envelope for more introduction on the custom of red envelope.
19gifts during the CLNY, this does not invalidate the mechanism of family companionship. That is, red-
envelope money and gifts are often from family members, usually given in person, and may be perceived
as a particular form of family companionship. It is worthwhile to point out that generally the potential
income shocks from red-envelope money and gifts should be independent of the level of daily family
companionship received by the elderly, thus the red-envelope money and gift alone cannot explain the
results of heterogeneous effects by itself.
Changes in healthcare institution access during the CLNY
Another explanation is that access to healthcare institutions may change during the seven-day statutory
holiday. However, even during the seven-day statutory holidays, many public hospitals remain open and
provide emergency services. Moreover, even if such effects are observed, they should lead to more, not
less, attempted suicides resulting in deaths. Thus, it should only bias the results downward. In addition, we
do not find evidence that the protective effects depend on healthcare institution access, measured by number
of hospitals per capita (Tables 6 and 7).
Underreporting of suicide during the CLNY
Another concern is that suicide cases may be underreported during the CLNY, potentially due to lack of
officials to record the suicide deaths during statutory holidays. However, if the reduction of suicide rate is
due to underreporting, we should observe similar effects for all age cohorts, which is not the case.
Symbolic effects of holidays
Another potential explanation of the protective effects is that holidays may represent a good symbol that
improves mental health. However, it cannot explain why the protective effects depend on daily family
companionship. In addition, we directly examine this hypothesis by investigating the effects of other
Chinese lunisolar calendar holidays, including Dragon Boat Festival and Mid-Autumn Festival, on elderly
suicide rate. Note that the timing of these lunisolar calendar holidays also varies across different years,
which enables us to control for temporal trends. The specifications are similar to our baseline specification
20for the CLNY. Different from the CLNY, Dragon Boat Festival and Mid-Autumn Festival are only a one-
day holiday, and the day off is sometimes adjusted.32 Young and middle-age people are considerably less
likely to return home to visit their parents during these statutory holidays.
[Figures 4 and 5 About Here]
Figures 4 and 5 show the effects of Dragon Boat Festival and Mid-Autumn Festival on suicide rate by
gender and age cohort. Little evidence supports the protective effects of Dragon Boat Festival and Mid-
Autumn Festival on elderly suicide, thus casting doubt on the symbolic effects as a mechanism.
Here, we further discuss why strong protective effects exist for the CLNY, but not for the Dragon Boat
Festival and Mid-Autumn Festival. The potential explanation is still the family companionship story.
Family reunion is the core value of the CLNY. To reunite with families, around 3 billion trips are being
made each year during the Spring Festival travel rush around the CLNY. Survey evidence suggests that 80%
of people go back home to reunite with their families, and 70% agree that family reunion during the CLNY
is a traditional custom and they keep practicing celebrating with families every year (see Footnote 26). The
seven-day statutory holiday enables most people to travel and reunite with families.
By contrast, although other traditional Chinese lunisolar calendar holidays, such as Dragon Boat Festival
and Mid-Autumn Festival, also have symbols of family reunion, the statutory holidays last for only three
days, which impedes many people from going back home. For example, survey evidence suggests that 58%
of people cannot go back home and visit their parents during the Mid-Autumn Festival.33 In addition, survey
evidence suggests that 53% of young and middle-age people living outside of hometown are only able to
32
For example, if the day of the holiday is next to a weekend, then that day will usually be specified as the day off. If the day of
the holiday is far from weekends, then it may be adjusted that people work on the holiday and have a three-day long weekend. As
our data are at the week level, we specify the week that has the actual additional day off as the treatment week for Dragon Boat
Festival and the Mid-Autumn Festival.
33
https://news.qq.com/a/20110912/000360.htm (in Chinese).
21pay visitation to their parents for 3–10 days a year, which also suggests that people are less able to reunite
with their families in holidays other than the CLNY.34
Self-discipline of the elderly to avoid suicide during happy events
Another alternative explanation is that the elderly people may have self-discipline to avoid committing
suicide during happy events, which may create additional sadness for their family. However, as previously
discussed, no similar evidence shows the protective effects for other Chinese lunisolar calendar holidays.
In addition, this mechanism cannot explain why the protective effects differ across different levels of daily
family companionship. If self-discipline is driving the results, then the effects should be similar regardless
of whether children are living in the households.
Social companionship during the CLNY
Another potential confounding mechanism is the increased social companionship during the CLNY. Some
local communities may visit the elderly people in poverty or living alone, and help them prepare for the
CLNY, and the additional social companionship may also contribute to the reduction of elderly suicide
rate. 35 We cannot acquire measures of social companionship and cannot directly test the hypothesis.
However, the increased social companionship only covers a small proportion of elderly people, whereas
the increased family companionship covers most of the elderly people during the CLNY. In addition, this
explanation alone cannot explain the heterogeneous effects results. Even if the protective effects come
through additional social companionship during the CLNY, it still suggests the importance of
companionship and highlights the concern of aging population and increasing proportion of the empty-nest
elderly.
34
https://cj.sina.com.cn/articles/view/1704103183/65928d0f020017mno (in Chinese).
35
See https://baijiahao.baidu.com/s?id=1623729898423645282&wfr=spider&for=pc (in Chinese) and
https://www.sohu.com/a/222845573_100014930 (in Chinese) for examples of news reports on social companionship activities.
22To conclude, most contemporaneous changes during the CLNY and alternative mechanisms cannot fully
explain our results. Therefore, the results suggest family companionship as a crucial mechanism of the
protective effects of the CLNY on elderly suicide.
4.4 Dynamic Effects
In this section, we explore the dynamic effects of the CLNY. There could be several reasons for why there
are changes in elderly suicide rate in the weeks before and after the CLNY. First, there may exist an
anticipation effect, that is, anticipating the family companionship in the upcoming CLNY weeks may
improve the mental health of the elderly people. Previous studies (Rutledge et al. 2014) have found that
expectations for happy events can contribute to individuals’ happiness before they even occur.36 Similar
effects may exist for the anticipation of family companionship, and in that case, we expect to observe a
decrease in elderly suicide rate before the CLNY. Second, there may exist a temporal displacement of
suicide, that is, the elderly may simply postpone their suicides to later weeks. In that case, we expect to
observe an increase in elderly suicide rate after the CLNY. Testing temporal displacement is important in
the sense that if all the protective effects are driven by temporal displacement, the social benefit of these
protective effects will be considerably smaller. Third, there may exist separation anxiety (Wijeratne and
Manicavasagar 2003) for the elderly people after the CLNY, and separating with children after the CLNY
may worsen the mental health of the elderly people. In that case, we also expect to observe an increase in
elderly suicide rate after the CLNY. Finally, there may exist a long-lasting effect of companionship, that is,
the companionship during the CLNY may improve the mental health of the elderly people even after the
holiday. In that case, we expect a decrease in elderly suicide rate after the CLNY.
Therefore, the direction of dynamic effects is ex-ante unclear. We investigate the dynamic effects by
directly estimating the treatment effects of weeks before and after the CLNY. We exclude year 2016
36
https://psychcentral.com/blog/expecting-to-be-happy-makes-you-happier/.
23throughout this analysis, such that two weeks will be defined as in the CLNY for every year in the sample.37
Then, we define dummy variables indicating 1 to 4 weeks prior to the first week defined as in the CLNY
and dummy variables indicating 1 to 4 weeks after the last week defined as in the CLNY, and we include
all of them into the regression.38
[Figure 6 About Here]
Figure 6 shows the results. We find that the protective effects of the CLNY start to exhibit 2 weeks prior
to the CLNY weeks, and there is some evidence that elderly suicide rate increases in the following 1 to 2
weeks after the CLNY weeks, especially for female. By contrast, we do not find evidence that suicide rate
of the male elderly increases after the CLNY.
These results strongly support the anticipation effect, and some evidence supports temporal displacement
and separation anxiety, especially for female. Note that we cannot separately identify these mechanisms.
However, we are able to estimate the average of the treatment effects of the CLNY weeks and other weeks
within the two-month window to examine the overall effects.39 The average effect is a 5.7% decline (p-
value of 0.025) in elderly suicide rate, and a 6.0% decline (p-value of 0.022) in suicide rate of the male
elderly. However, we cannot reject the null hypothesis that the overall effect is 0 for the female elderly
(average effect of −0.9%, p-value of 0.675). Therefore, even with the existence of temporal displacement
and separation anxiety, the protective effects are not fully offset, especially for male, and the CLNY is
effective at preventing elderly suicide. In addition, gender difference in dynamic effects suggests that the
male elderly may be more sensitive to family companionship than the female elderly, which is consistent
with the findings in previous studies (Stokes and Levin 1986) that the loneliness of men is more sensitive
to social network density than women.
37
Year 2016 is excluded because it is the only year in our sample that only one week is defined to be during the CNLY, and the
results are hard to interpret when year 2016 is included as the weeks before and after the CNLY weeks are not comparable in
year 2016 and in other years. Nevertheless, the results are overall very similar when year 2016 is included in the analysis.
38
There are in general no effects for weeks beyond the scope of this two-month time window.
39
The average of effects is defined as 1/10 ∗ (&!" + &!# + &!$ + &!% + 2 ∗ && + &% + &$ + &# + &" ), because two weeks will
take the value of 1 for the CLNY dummy.
24You can also read