Demographic Profile: 2018 Census, Population of Counties Manukau - An Overview - Prepared: Population Health Team
←
→
Page content transcription
If your browser does not render page correctly, please read the page content below

Demographic Profile: 2018 Census,
         Population of
       Counties Manukau

An Overview

Prepared: Population Health Team   Counties Manukau Health
Disclaimer
Information within the report may be freely used provided the source is acknowledged.
Every effort has been made to ensure that the information in this report is correct.

Counties Manukau Health and the authors will not accept any responsibility for information which is
incorrect, or any actions taken as a result of the information in this report.

Published in June 2021

By Counties Manukau Health
Private Bag 94052
South Auckland Mail Centre
Manukau City
New Zealand

ISBN 978-0-9876500-9-2
Suggested citation:
Lees J, Lee M, Winnard D (2021) Demographic Profile: 2018 Census, Population of Counties Manukau.
Auckland: Counties Manukau Health.

Double vowels are used rather than macrons where appropriate in Te Reo Maaori words in keeping with the
Tainui convention, as mana whenua of the Counties Manukau district.

Acknowledgements

The authors would like to acknowledge the helpful peer review and feedback of Dr Gary Jackson.

                                              Page 2 of 74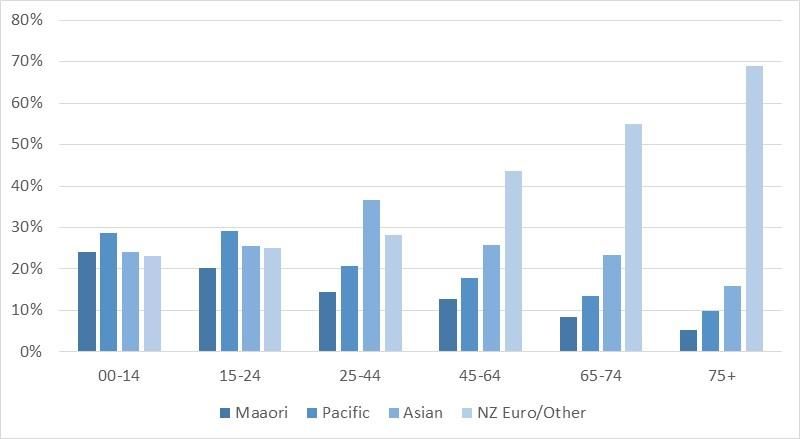
Executive Summary
The Counties Manukau Health strategic goal is “achieving healthy equity for our community”.
It is critical that we understand and appreciate the demography of the population and context
in which whaanau and communities live. This information supports health service design,
advocacy and prevention initiatives of CM Health, to best meet the needs of the populations
we serve.

The population served by Counties Manukau Health (CM Health) has many unique features
compared to other District Health Board (DHB) populations. The population we serve is young,
vibrant, connected and ethnically diverse. It is also a population that has many socioeconomic
challenges.

The purpose of this report is to provide information about the demography and the social and
economic conditions that impact the health and wellbeing of the CM Health population, using
data from the 2018 Census, and population estimates based on the 2018 Census. Because of
the limitations of the 2018 Census response rates and the different methodology used to
produce the 2018 Census data, many variables are difficult to directly compare to the 2013
Census.

This summary focuses on whole of population data for the main (aggregated) ethnic groups
of the CM Health population, along with a short section on the demography of the CM Health
service localities.

Key findings

    •   CM Health has a large population relative to most other DHBs. In 2018, the estimated
        resident population served by CM health was 567,000 people, representing 11% of
        the total NZ population.

    •   The CM Health population is ethnically diverse. In 2018, 16% of the population served
        by CM Health identified as Maaori, 22% as Pacific, 28% as Asian and 34% as NZ
        European/Other groups (on the basis of prioritised ethnicity as commonly used in the
        health sector).

    •   The ethnic makeup of the population served by CM Health varies with age. Younger
        populations have higher proportions of Maaori and Pacific peoples compared with the
        population aged 75 years and over (where over two thirds are NZ European/Other
        groups).

    •   Compared with other DHBs, CM Health has the largest Pacific population, and the
        second largest Maaori population.

    •   Half (50%) of the Pacific population in CM Health identified as Samoan at the time of
        the 2018 Census, a quarter as Tongan (25%) and 21% as Cook Island Maaori (total
        response ethnicity).

    •   Around 21% of New Zealand’s Asian population live in CM Health. Nearly half of these
        identified themselves as Indian in 2018 (48%) and a third as Chinese (32%).

                                        Page 3 of 74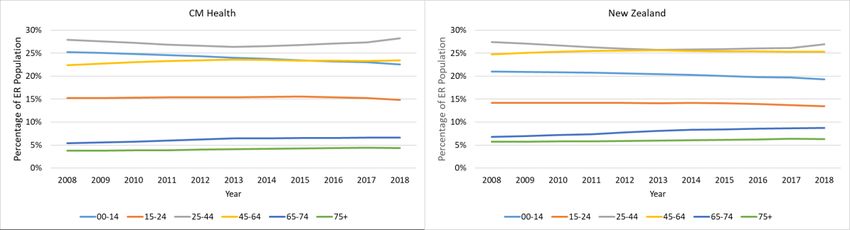
•   CM Health has a relatively young population. People aged 65 years and older made
    up 11% of the CM Health population, while 23% of the population was aged 14 years
    or younger in 2018. The respective figures for NZ population were 15% and 19%.

•   CM Health is divided into four localities for planning and service provision –
    Maangere/Ootara, Manukau, Eastern and Franklin. These localities differ substantially
    in terms of population size and demography, with details in the body of this report.

•   CM Health covers one of the fastest growing regions in New Zealand, adding on
    average 10,000 people per year over the past 10 years, around 2% per annum.
    Growth is higher in older age groups, with the population aged 65 years and over
    growing at approximately 4% per year.

•   The ethnic populations of the CM Health area have been growing at different rates.
    The Asian population has had the fastest growth followed by Pacific, while the NZ
    European/Other group has actually reduced in size over time. This means the CM
    Health population in 2018 was considerably more multi-ethnic than in 2008.

•   New Zealand was identified as the country of birth for 60% of the CM Health
    population in the 2018 Census. Approximately 60% of those born overseas had been
    living in NZ for 10 or more years at the time of the 2018 Census.

•   Within CM Health, 22% of people who identified as Maaori aged 15 years and over
    were reported to be able to speak about everyday things in Te Reo Maaori. 42% of
    Maaori aged 65 years and older were reported to be able to speak about everyday
    things in Te Reo Maaori.

•   A high proportion of those who identify with one or more of the Pacific and Asian
    populations in older age groups are reported to be able to speak their heritage
    language (e.g. over 80% of Samoan, Chinese and Korean residents aged 45 years and
    older, and over 70% of those who are Tongan of that age group).

•   Overall, 92% of the CM Health population were reported as having conversational
    English. However, conversational English was less common for Pacific (90%), Asian
    (84%) and MELAA (Middle Eastern, Latin American and African) (87%) ethnic groups,
    particularly in older age groups (e.g. 73% of Samoan, 65% of Tongan and 69% of Indian
    residents aged 65 years and older were reported as having conversational English;
    only 40% of Chinese and 46% of Korean people of that age were reported as having
    conversational English).

•   Family size differs by ethnicity, with smaller two to four person families being more
    common in NZ European/Other groups, while 15% of Maaori and 27% of Pacific
    families in CM Health consisted of six or more people in 2018.

•   Multi-family households are more common in the CM Health district compared to the
    rest of NZ. Within CM Health, 14% of households contained two families, and 2% of
    households contained 3 or more families in 2018. This compared with 7% and 1%,
    respectively, for national data.

                                    Page 4 of 74
• Just over 45% of CM Health respondents identified with a Christian religion and almost
37% of respondents identified with no religion; these figures varied considerably
across ethnicities.
• The CM Health population has high levels of socioeconomic hardship. In 2018, 37% of
the CM Health population lived in NZDep2018 deciles 9 and 10 / quintile 5 (areas
defined as the most socioeconomically challenged). ‘All things being equal’ this figure
would be 20%. The percentage living in NZDep2018 Deciles 9 & 10 / quintile 5 was
much higher for Maaori (58%) and Pacific peoples (74%) than for NZ European/Other
(19%), Asian (24%) and MELAA (27%) groups, and higher for children (44% for those
aged under 15 years) than for older people (25% for those aged 65 years and over).
• Just under 50% of the CM population aged 25 years and over did not own the
residence they were living in; this was higher for Maaori (68%) and Pacific peoples
(73%).
• Overcrowding is a significant issue for households in the CM Health district. Twenty
two percent (22%) of Counties Manukau residents were living in a crowded or severely
crowded household in 2018. This figure was higher for Maaori (32%) and Pacific
peoples (48%) than for those in Asian groups (19%), and NZ European/Other groups
(5%).
• Household crowding was patterned by age. Among CM Health residents less than 15
years old, 29% lived in a crowded or severely crowded home. In contrast, 9% of CM
Health residents aged 65 years and over lived in a crowded or severely crowded home.
• Low incomes are more common in the CM Health district compared to the NZ
population. Just under half (49%) of the CM Health population aged 15 years and over
had a personal income of $30,000 or less per year. This compares with 35% for the
total NZ population of that age.
• 50% of those aged 15 years and over were employed full time, 11-14% were in part
time employment, 31% were not in the labour force, and 5% were unemployed. 9%
of Maaori, 7% of Pacific people and 6% in MELAA groups in CM Health were
unemployed at the time of the 2018 Census, compared with 3% and 4% for NZ
European/Other and Asian populations.
• 27% of the CM Health population aged 15 years and older held a post-school
qualification (excluding university) in 2018; for Maaori and Pacific peoples the figures
were 35% and 29% respectively. 21% of the population aged 15 years and above held
a L7 or Bachelor degree, or above, the highest levels being reported amongst Asian
residents (35%). Maaori and Pacific peoples were less likely to hold a Bachelors/Level
7 qualification or above (9% and 9% respectively).
• 3% of residents reported no access to a motor vehicle; Maaori and Pacific residents
were less likely to have access to a vehicle (7% and 5% respectively).
Page 5 of 74• Most CM Health residents have access to some form of telecommunication device in
the place they live. Based on Census 2018 data approximately 1% of people in CM
Health region had no access to telecommunications at home. Overall, 94% of Counties
Manukau residents reported having access to a mobile phone and this was fairly
consistent across ethnicities. Internet access at home was present for 90% of CM
Health residents; this was notably lower for Maaori and Pacific peoples (83% and 81%)
and patterned by age group with lower access at home for those who are older.
Page 6 of 74Table of Contents
Executive Summary ................................................................................................................... 3
Key findings ........................................................................................................................... 3
Table of Contents ...................................................................................................................... 7
List of Figures ............................................................................................................................. 9
List of Tables ............................................................................................................................ 10
Abbreviations .......................................................................................................................... 12
Introduction ............................................................................................................................. 13
Use and interpretation of data ................................................................................................ 14
The 2018 Census.................................................................................................................. 14
Census counts and populations ........................................................................................... 16
Sex and gender data ............................................................................................................ 17
Ethnicity data ....................................................................................................................... 18
Geographic boundaries and locality data............................................................................ 19
NZDep2018 .......................................................................................................................... 21
Demography ............................................................................................................................ 22
Gender composition by age ................................................................................................ 22
Ethnic composition and age structure ................................................................................ 22
Pacific, Asian and MELAA subgroups................................................................................... 27
Ethnic composition and age structure of the CM Health localities ..................................... 29
Population Change – age and ethnicity ............................................................................... 32
Birthplace ............................................................................................................................ 34
Years since arrival in New Zealand ...................................................................................... 34
Languages spoken ............................................................................................................... 36
Family size ........................................................................................................................... 38
Household composition....................................................................................................... 39
Religion ................................................................................................................................ 40
Socioeconomic Determinants of Health.................................................................................. 42
New Zealand Deprivation Index 2018 ................................................................................. 42
Housing ................................................................................................................................ 47
Residential Mobility ......................................................................................................... 47
Housing Tenure ............................................................................................................... 48
Household crowding ........................................................................................................ 50
Page 7 of 74Housing quality ................................................................................................................ 52
Home heating .................................................................................................................. 53
Income ................................................................................................................................. 54
Personal Income .............................................................................................................. 54
Income Source ................................................................................................................. 55
Workforce status ................................................................................................................. 57
Education ............................................................................................................................. 59
Transport ............................................................................................................................. 61
Household vehicles .......................................................................................................... 61
Travel to Work ................................................................................................................. 61
Travel to education.......................................................................................................... 62
Telecommunications access ................................................................................................ 63
Appendices .............................................................................................................................. 67
Appendix One: Population pyramids for CM Health ER populations by ethnicity .............. 67
Appendix Two: Pacific and Asian language analysis ............................................................ 69
Pacific languages ............................................................................................................. 69
Asian languages ............................................................................................................... 71
Appendix Three: Additional Household Crowding Analysis for children ............................ 73
Page 8 of 74List of Figures
Figure 1 The definitions of the population measures from Stats NZ ...................................... 16
Figure 2 Service localities for Counties Manukau Health ........................................................ 20
Figure 3 Distribution of NZDep2018 scores for the whole of NZ, with the NZDep2018 decile
scale superimposed ................................................................................................................. 21
Figure 4 ER population by ethnicity for the Northern Region DHBs and NZ total population in
2018 ......................................................................................................................................... 23
Figure 5 Ethnicity patterns within age groups of the ER population of CM in 2018 .............. 25
Figure 6 Age-sex pyramid for total CM ER population based on the 2018 Census ................. 26
Figure 7 Ethnic mix of Asian populations across the metro Auckland DHBs........................... 28
Figure 8 Indicative number of residents within CM Health localities by prioritised ethnic
groups ...................................................................................................................................... 30
Figure 9 Estimated population of CM Health by age group 2008-2018 .................................. 32
Figure 10 Estimated population of CM Health and NZ, percentage in age groups 2008-201832
Figure 11 Estimated population of CM Health by ethnicity 2008-2018 .................................. 33
Figure 12 Estimated population of CM Health and NZ, percentage by ethnicity 2008-2018 . 33
Figure 13 Years since arrival in New Zealand (at the time of the 2018 Census) for the CM
Health overseas-born population by prioritised ethnicity ...................................................... 35
Figure 14 Family size for the CM population in the 2018 Census by prioritised ethnicity,
proportion of families.............................................................................................................. 39
Figure 15 Religion identified for the CM population in the 2018 Census by prioritised
ethnicity ................................................................................................................................... 41
Figure 16 Percentage of CM Health residents living in NZDep2018 deciles, 2018 ................. 43
Figure 17 Percentage of CM Health residents living in NZDep2018 deciles 9 & 10 by age and
ethnicity ................................................................................................................................... 46
Figure 18 Housing tenure for CM Health residents aged 25 years and over in 2018 by
prioritised ethnicity ................................................................................................................. 49
Figure 19 Household crowding for CM Health residents in 2018 by prioritised ethnicity ...... 51
Figure 20 Personal income, CM residents aged 15 years and over in 2018 by total response
ethnicity ................................................................................................................................... 55
Figure 21 Workforce status for the CM population aged 15 years and over in 2018 by total
response ethnicity ................................................................................................................... 58
Figure 22 Highest level of academic qualification for the CM population aged 15 years and
over in the 2018 Census by prioritised ethnicity ..................................................................... 60
Figure 23 Access to telecommunications at home for CM Health residents in 2018 by
prioritised ethnicity ................................................................................................................. 64
Figure 24 Access to telecommunications at home, CM Health residents, 2018 by age group 65
Figure 25 Access to the internet at home, CM Health residents, 2018 by age group and
ethnicity ................................................................................................................................... 66
Figure 26 Population pyramid for CM Health Maaori 2018 ER population ............................ 67
Figure 27 Population pyramid for CM Health Pacific 2018 ER population .............................. 67
Figure 28 Population pyramid for CM Health Asian 2018 ER population ............................... 68
Figure 29 Population pyramid for CM Health NZ European/Other 2018 ER population ........ 68
Figure 30 Household crowding for CM Health children in 2018 by prioritised ethnicity ........ 74
Page 9 of 74List of Tables
Table 1. External Panel data quality ratings for variables in the Census 2018 ....................... 15
Table 2 Gender composition within age groups of the ER population of CM in 2018 ............ 22
Table 3 ER population by ethnicity for the Northern Region DHBs and NZ total population in
2018 ......................................................................................................................................... 23
Table 4 Ethnicity patterns within age groups of the ER population of CM in 2018 ................ 24
Table 5 Ethnicity patterns across age groups of the ER population of CM in 2018 ................ 25
Table 6 CM Health Pacific population by level 3 total response ethnic groups ...................... 27
Table 7 CM Health Asian population by level 3 total response ethnic groups........................ 27
Table 8 2018 Estimated resident population by CM Health locality ....................................... 29
Table 9 Ethnicity distribution within CM Health localities in 2018 ......................................... 29
Table 10 Ethnicity distribution across CM Health localities in 2018 ....................................... 30
Table 11 Indicative number of residents within CM Health localities by prioritised ethnic
groups ...................................................................................................................................... 30
Table 12 Age structure of the CM Health localities in 2018 .................................................... 31
Table 13 Birthplace for the CM population in Census 2018 for prioritised ethnic groups ..... 34
Table 14 Years since arrival in New Zealand (at the time of the 2018 Census) for the overseas
born UR CM population by prioritised ethnicity ..................................................................... 35
Table 15 Te Reo Maaori speakers in CM Health and NZ, by age and Maaori ethnicity in the
2018 Census............................................................................................................................. 36
Table 16 Percentage* of English speakers by ethnic group .................................................... 37
Table 17 Family size for the CM population in the 2018 Census by prioritised ethnicity ....... 39
Table 18 Household composition for the CM population in the 2018 Census ....................... 40
Table 19 Religion/belief/philosophy identified for the CM population in the 2018 Census for
prioritised ethnic groups ......................................................................................................... 41
Table 20 Distribution of residents across NZDep2018 deciles for the three Auckland DHBs . 43
Table 21 Distribution of residents across NZDep2018 quintiles for the three Auckland DHBs
................................................................................................................................................. 43
Table 22 Indicative number of residents in 2018 across NZDep2018 deciles for Auckland,
Counties Manukau and Waitematā DHBs ............................................................................... 44
Table 23 Distribution of CM Health residents across NZDep2018 deciles by total response
ethnicity ................................................................................................................................... 45
Table 24 Indicative number of CM Health residents across NZDep2018 deciles by total
response ethnicity, 2018 ......................................................................................................... 45
Table 25 Percentage of CM Health residents living in NZDep2018 deciles by age group ....... 46
Table 26 Residential mobility for CM Health residents at five years before the 2018 Census 48
Table 27 Housing tenure for CM Health residents aged 25 years and over in 2018 by
prioritised ethnicity ................................................................................................................. 49
Table 28 Household crowding for CM Health residents in 2018 by prioritised ethnicity ....... 50
Table 29 Indicative number of CM Health residents living in crowded homes in 2018 by
prioritised ethnicity ................................................................................................................. 51
Table 30 Household crowding for CM Health residents in 2018 by age groups ..................... 52
Table 31 Housing dampness for the CM Health and NZ population in 2018 .......................... 52
Table 32 Home heating among CM Health residents in 2018 by prioritised ethnicity ........... 53
Table 33 Personal income, CM residents aged 15 years and over in 2018 by total response
ethnicity ................................................................................................................................... 54
Table 34 Sources of income in the 12 months prior to the 2018 Census for the CM population
aged 15 years and over ........................................................................................................... 56
Table 35 Government benefit sources of income in the 12 months prior to the 2018 Census
for the CM population aged 15 years and over....................................................................... 56
Page 10 of 74Table 36 Workforce status for the CM population aged 15 years and over in 2018 by total
response ethnicity ................................................................................................................... 57
Table 37 Highest level of academic qualification for the CM population aged 15 years and
over in 2018 by prioritised ethnicity ....................................................................................... 59
Table 38 No motor vehicle in the home for CM Health residents in 2018 by prioritised
ethnicity ................................................................................................................................... 61
Table 39 Means of travel to work for employed CM Health residents aged 15 years and over
in 2018 ..................................................................................................................................... 62
Table 40 Means of travel to education for CM Health residents in 2018 ............................... 62
Table 41 Access to telecommunications at home, CM Health residents, 2018 by prioritised
ethnicity ................................................................................................................................... 63
Table 42 Access to telecommunications at home, CM Health residents, 2018 by age group 64
Table 43 Access to the internet at home, CM Health residents, 2018 by age group and
ethnicity ................................................................................................................................... 65
Table 44 Language indicators for the CM Health Samoan population from the 2018 Census,
by age group ............................................................................................................................ 70
Table 45 Language indicators for the CM Health Tongan population from the 2018 Census,
by age group ............................................................................................................................ 70
Table 46 Language indicators for the CM Health Cook Island Māori population from the 2018
Census, by age group............................................................................................................... 70
Table 47 Language indicators for the CM Health Niuean population from the 2018 Census, by
age group ................................................................................................................................. 70
Table 48 English language speaking for total Pacific population from the 2018 Census, by age
group ....................................................................................................................................... 70
Table 49 Language indicators for the CM Health Indian population from the 2018 Census, by
age group ................................................................................................................................. 71
Table 50 Language indicators for the CM Health Chinese population from the 2018 Census,
by age group ............................................................................................................................ 71
Table 51 Language indicators for the CM Health Filipino population from the 2018 Census, by
age group ................................................................................................................................. 72
Table 52 Language indicators for the CM Health Korean population from the 2018 Census, by
age group ................................................................................................................................. 72
Table 53 English language speaking for total Asian population from the 2018 Census, by age
group ....................................................................................................................................... 72
Table 54 Household crowding for CM Health children aged 0-14 years in 2018 by prioritised
ethnicity ................................................................................................................................... 73
Table 55 Indicative number of CM Health children living in crowded homes in 2018 by
prioritised ethnicity ................................................................................................................. 74
Page 11 of 74Abbreviations
CM Counties Manukau
CM Health Counties Manukau Health = CMDHB
DHB District Health Board
ER Estimated resident population
IDI Integrated data infrastructure - Stats NZ managed collation of
NZ governmental datasets – see page 14
NZ New Zealand
NZDep2018 New Zealand small-area index of relative socioeconomic
deprivation based on the 2018 Census – see page 21
TR Total response – people who have multiple ethnicities are
counted in each category. Percentages add up to more than
100. Compare with the default for this report, where possible,
to count each person once via a standard way of prioritising
ethnicity used in the health sector – see page 18
UR Usually resident population
SA1 Statistical Area 1 – new Stats NZ geographical area. Used for
2018 Census datasets, largely replacing the meshblock (MB)
datasets released in previous censuses (although each SA1 is
made up of a grouping of meshblocks) – see page 19
SA2 Statistical Area 2 – new Stats NZ geographical area, each SA2 is
a grouping of SA1s, largely replacing the Census Area Unit
(CAU) datasets released in previous censuses – see page 19
Stats NZ Stats New Zealand, government department
Page 12 of 74Introduction
The population of CM Health is young, vibrant, connected and ethnically diverse. It is also a
population that has many socioeconomic challenges.
The Counties Manukau Health strategic goal is to achieve health equity for our community.
The purpose of this report is to provide information about the demography and the social and
economic conditions that impact the health and wellbeing of the CM Health population. This
information supports health service design, advocacy and prevention initiatives of CM Health,
to best meet the needs of the populations we serve and achieve equitable health outcomes.
This report summarises information about the population living in the area served by CM
Health. It provides information captured in the 2018 Census at the level of the whole CM
Health district population, for the four main (level 0) ethnic groups reported in most health
sector data (Maaori, Pacific, Asian, NZ European/Other). The ethnic make-up of the four CM
Health localities is also provided. This report also uses population estimates based on the 2018
Census in describing the demography of the CM Health population.
In this report comparisons are also made between the Counties Manukau population and the
total New Zealand population in the text narrative (for the most part, New Zealand data are
not shown in the tables). This report is complementary to other publicly available reports on
the demography and population profile of the Auckland region. Counties Manukau is part of
Auckland city, but the southern part of the district also includes parts of Waikato and Hauraki
local authorities. In addition, Auckland region analyses can mask the unique aspects of the
Counties Manukau population and the differences across Auckland.
We recognise that the data in this report are important for health service planning, but are
only one piece of the puzzle. These data do not provide an understanding of the details of
individual lives and the values, strengths and challenges of the whaanau and communities in
the CM Health region. Therefore, this profile is intended to be used in conjunction with other
sources of information – in particular listening to the voices of the population we serve, about
their priorities and values.
Page 13 of 74Use and interpretation of data
In reading and using the information presented in this report, it is important to understand
some key issues about the populations described in relation to the census, the way ethnicity
is recorded and used, and how the CM Health localities are defined.
Firstly, we recognise that much of the data in this profile speaks to the challenges faced by the
populations we serve. Largely, the strengths, resourcefulness and resilience of the populations
we serve are not well captured in these data. For example, these data do not provide much
insight into community connection and cultural capital in our communities.
Additionally, material deprivation, education and employment challenges faced by many
people in CM Health region have occurred in the context of a long history of systemic and
structural barriers to equity, including colonisation, racism and discrimination in this country.
It is critical that this historic context is understood when interpreting and using data in this
profile. It is also important that this profile is used to progress our strategic goal of achieving
health equity for the populations we serve.
The 2018 Census
The 2018 Census was the first ‘digital-first’ census undertaken in New Zealand. This change
was a part of modernising and streamlining the census process. Unfortunately, the 2018
Census had very low response rates for Maaori and Pacific peoples. The response rate was
approximately 68% for Maaori and 65% for Pacific peoples.1
As a result of the low response rates, administrative data from the New Zealand government
integrated data infrastructure (IDI) was used to supplement census data and mitigate the
impact of low response rates. The IDI incorporates data from tax, health, education,
immigration and other government data sources including the 2013 Census. This has allowed
Stats NZ to count people who were missed by the 2018 Census. In addition to using
administrative data, data have also been imputed from population modelling. For example,
language data are modelled based on household language use, age and sex.
The result of using the IDI to supplement census data is that total population counts and the
subnational distributions (e.g. across DHBs) from Census 2018 are closer to other counts of
the CM Health population (see later re the Health Service Utilisation population) than previous
census outputs. This is particularly important for addressing historic undercounting of Maaori
and Pacific peoples.2 However, there is still an undercount, and there are key limitations in
the quality of other variables in the 2018 Census.
1 Stats NZ (2018) 2018 Census collection response rates unacceptably low.
https://www.stats.govt.nz/methods/2018-census-collection-response-rates-unacceptably-low
2
Despite the improved counts there remains an apparent shortfall between Census figures and counts of unique
health service users with addresses in the CM Health district. This seems to particularly affect Pacific families, and
will be examined more closely in a future document.
Page 14 of 74The 2018 Census External Data Quality Panel provided guidance on the quality of key variables
in the Census.3 Variables that are of special significance to this report, and their quality rating
from the expert panel are summarised below (Table 1). In particular, data on iwi affiliation
have not been released because of poor quality so are not available for this report. Where the
expert data quality panel have not provided an assessment, the Stats NZ data quality rating
has been used.
A discussion of the important changes to the design of the forms and questions, including new
questions, can be found online.4
Table 1. External Panel data quality ratings for variables in the Census 2018 5
Quality rating Variable
Very high Age
Sex
Usually resident population count
High Birthplace
Maaori decent
Personal income source
Religious affiliation
Total personal income
Moderate Ethnicity
Heating type
Housing quality variables
(access to basic amenities, dampness, and mould)
Housing tenure
Number of motor vehicles
Telecommunication access
Travel to education
Work and labour force status
Years since arrival in NZ
Moderate to Qualification variables
poor Study participation
Poor Individual home ownership6
Travel to work
Usual residence five years ago
Usual residence one year ago7
Very poor Family type and household composition
Iwi affiliation – these data have not been released because of poor quality
Languages spoken – this ranges from very high to poor, depending on the
language. See the discussion on language data (page 36) for more information.
3 2018 Census External Data Quality Panel (2020). Final report of the 2018 Census External Data Quality Panel.
Retrieved from www.stats.govt.nz
4 Stats NZ (2018). 2018 Census: Design of forms. Retrieved from www.stats.govt.nz.
5 2018 Census External Data Quality Panel (2020). Final report of the 2018 Census External Data Quality Panel.
Retrieved from www.stats.govt.nz
6 Stats NZ Quality rating. https://www.stats.govt.nz/methods/data-quality-ratings-for-2018-census-variables
7 Stats NZ Quality rating. https://www.stats.govt.nz/methods/data-quality-ratings-for-2018-census-variables
Page 15 of 74Census counts and populations
This report outlines key features of the CM Health population using data from the 2018
Census. Stats NZ report three distinct population measures that relate to census data
Figure 1). These are the census night population count, the census usually resident population
count (UR) and the estimated resident population (ER).
Figure 1 The definitions of the population measures from Stats NZ8
Census usually
Census night resident Estimated resident
population count population count population (ER)
(UR)
Visitors from
overseas in the area
on census night
Residents of other
areas of New
Zealand in the area
on census night
Residents of that Residents of that Residents of that
area in the area on area in the area on area in the area on
census night census night census night
Residents Residents
elsewhere in New elsewhere in New
Zealand on census Zealand on census
night night
Residents missed by
census (net census
undercount)
Residents
temporarily
overseas on census
night
Births, deaths, and
net migration since
census night (to 30
June)
Unless otherwise stated, percentages in this report for social and economic variables are
derived from census UR population counts as obtained in a customised 2018 Census extract
from Stats NZ for use by the four Northern Region District Health Boards and their support
organisation9. In calculating percentages, responses that cannot be classified (e.g., ‘not stated’,
‘response unidentifiable’, ‘response out of scope’) are excluded from the denominator.
8Chan, WC. (2019) Census technical summary. Population Health Team, Counties Manukau Health.
9Supplied to CM Health, Auckland District Health Board, Waitematā District Health Board, Northland District
Health Board, and Northern Regional Alliance
Page 16 of 74To calculate the absolute numbers for these variables for planning purposes, the percentages
derived from the 2018 Census UR population data have been applied to the estimated resident
population for 2018 (ER). For the ethnicity and age group description in the first section, the
ER population has been used (see further page 22).
A more detailed explanation of the interpretation of census data can be found in the ‘Census
technical summary (2019)’ produced by the CM Health Population Health Team.10
Because of the limitations of the 2018 Census response rates and the different methodology
used to produce the 2018 Census data, many variables are not able to be directly compared
to the 2013 Census.
Numbers in this report have been rounded to protect confidentiality and also, for the
population numbers, to reinforce the estimated nature of the figures presented. Individual
figures may not add up to totals, and values for the same data may vary in different tables
because of this rounding.
Some analyses produced by CM Health also use another population, the Health Service
Utilisation (HSU) population. The HSU population is constructed through linkage of
anonymised health system data, identifying all people who had some contact with the health
system within the year in question. Essentially this is a large subset of the administration data
from the IDI that Stats NZ drew on to supplement the Census 2018 responses as described
above. HSU data is not reported in this profile, but has been used to cross check a number of
the variables reported, where appropriate.
Sex and gender data
Despite the fact that ‘sex’ and ‘gender’ are often used interchangeably in general use, these
are distinct concepts. Gender refers to a social and personal identity, whereas sex refers to
biological characteristics. 11
The 2018 Census asked whether respondents were male or female. No other response options
were available. This question is likely to be interpreted in a range of ways by respondents
because there is a lack of clarity about whether sex or gender data are being sought. For
example, it is unclear for transgender people whether this question is referring to sex at birth,
or identified gender. Additionally, the responses to this question align with a binary approach
to gender identity and are not inclusive of people who identify as gender diverse, intersex,
transgender or with an indigenous sexual and gender identity12.
10 Chan, W. C. (2019) Census technical summary. Population Health Team, Counties Manukau Health.
11 Sex and gender identity statistical standards: Consultation. 2020. Tatauranga Aotearoa - Stats New Zealand.
https://www.stats.govt.nz/consultations/sex-and-gender-identity-statistical-standards-consultation
12 There are a range of Maaori and Pacific terms commonly used in Aotearoa New Zealand to describe indigenous
sexual and gender identities. These include: Maaori - whakawahine, tangata ira tāne, takatāpui, Samoan –
Fa’afafine, Tongan – fakaleiti, Cook Islands – ‘akava’ine, Fijian – vakasalewalewa, Niuean – fakafifine.
Page 17 of 74In line with census data collection, this report presents demography data by male and female.
However, we recognise the above issues and limitations to its interpretation. Stats NZ is
currently reviewing sex and gender data to bring this in line with best practice and the values
and experience of people in Aotearoa New Zealand.13
Ethnicity data
Ethnic identity is an important dimension of social and cultural experience, and plays a
significant role in health and wellbeing. Importantly, ethnicity is ‘a social construct of group
affiliation and identity’.14 It is distinct from one’s ancestry/heritage or one’s nationality.
Ethnicity data is critical for monitoring progress on achieving health equity and to support
service design and planning.
In the 2018 Census, people were asked to self-identify the ethnic group or groups which they
belong to, with the ability to mark more than one ethnicity. This standard ethnicity collection
question has been consistently used since the 2001 Census and is also the standard for the
health and disability sector. This report preferentially presents prioritised ethnicity data where
this is available; this is routine in the health sector (in most other settings total response
ethnicity is used).15
The population served by CM Health is multi-ethnic with high numbers and proportions of
Maaori, Pacific and Asian peoples compared to other DHBs. This report outlines the ethnicity
profile of the CM Health population at a district level. Throughout this report, the four
aggregated ethnicity groups used in most health system reporting (Maaori, Pacific, Asian and
NZ European/Other; level 0 groups) are predominantly used.
The Pacific and Asian population groups in New Zealand are heterogeneous. The main
subgroups of each of the aggregate Pacific and Asian populations are described in this report.
Ideally data are presented for all Pacific and Asian subgroups; however, this is outside of the
scope of this report. Previous analyses indicate that many demographic and socioeconomic
factors are similar across Pacific subgroups.16 However, there are substantial differences
across Asian subgroups for these variables.17 In particular, Indian communities (the largest
South Asian subgroup in the Auckland population) have different health and socioeconomic
profiles to Chinese and other Asian groups. Because of these differences, some analyses in
this report are also disaggregated for the Asian population..
13 Sex and gender identity statistical standards: Consultation. 2020. Tatauranga Aotearoa - Stats New Zealand.
https://www.stats.govt.nz/consultations/sex-and-gender-identity-statistical-standards-consultation
14 Ministry of Health (2004) Ethnicity data protocols for the Health and Disability Sector. Wellington: Ministry of
Health.
15 Each respondent is allocated to a single ethnic group based on a prioritising system. For health this is as
follows: Maaori, Pacific peoples, Asian, other groups except NZ European, and NZ European.
16 Novak B. (2007) Ethnic-Specific Health Needs Assessment for Pacific People in Counties Manukau. Manukau
City: Counties Manukau District Health Board. Jackson G, Minster J. (2012) Metro-Auckland Pacific Population
Health Profile. Auckland: Health Partners Consulting Group.
17 Mehta S (2012) Health needs assessment of Asian people living in the Auckland region. Auckland: Northern DHB
Support Agency
Page 18 of 74Maaori and NZ European/Other groups are also aggregate groups. As noted above, iwi data
has not been released for Census 2018 because of low quality, so those of Maaori ethnicity
are not further broken down in this report. The NZ European/Other group includes the group
termed MELAA by Stats NZ (Middle Eastern, Latin American and African). Clearly the ethnic
groups included in MELAA are widely diverse. The overall make-up of the MELAA group in
Counties Manukau is reported, but numbers are small and are not otherwise disaggregated in
this report18.
Geographic boundaries and locality data
Statistical Area 1 (SA1) and Statistical Area 2 (SA2) are units used by Stats NZ to analyse data
in geographic units. SA1 typically have about 100-200 residents, and a maximum of 500
residents. They are made up of one or more meshblocks, and are now the smallest geographic
unit by which Census data is usually presented. SA2s are an aggregate of SA1s, equating to
small suburbs. SA2s will have varying number of residents. It may be fewer than 1,000
residents in rural areas, or between 2,000 to 4,000 residents in urban centres.
Most of the geographic area served by CM Health is part of the territorial authority of
Auckland Council. However small areas of the southern aspect of CM Health rohe are part of
Waikato District and Hauraki District territorial authorities.
For the purposes of service planning and integration, the area served by CM Health is divided
into four localities – Maangere/Ootara, Eastern, Manukau and Franklin (Figure 2). Within each
locality, there are two populations of note in relation to planning – the people who live in the
locality and the people who are enrolled in primary care practices in the locality. These two
populations overlap but are not the same. This report focuses on the population who live in
the locality.
18A report on the health status of people in the MELAA group in the Auckland region can be found at
https://countiesmanukau.health.nz/assets/About-CMH/Performance-and-planning/health-
status/8c7903cc7e/2011-health-assessment-middle-east-latin-american-african-people-living-in-auckland.pdf
Page 19 of 74Figure 2 Service localities for Counties Manukau Health
Page 20 of 74NZDep2018
NZDep2018 is an area-based measure of relative socioeconomic deprivation. It is based on
nine variables from the 2018 Census which cover eight different dimensions of socioeconomic
hardship. These variables relate to home internet access, receipt of welfare benefits,
household income, employment, qualifications, home ownership, family structure, household
crowding and housing quality. NZDep2018 gives a deprivation score for each meshblock, and
for each SA1.19
Meshblock scores are grouped into deciles. Decile 1 represents the 10% of areas with the least
socioeconomic deprivation and decile 10 the 10% of areas with the most socioeconomic
deprivation.20 The NZDep deciles are often combined and reported as five quintiles, with
quintile 1 representing the 20% of areas with the least and quintile 5 the 20% of areas with
the most socioeconomic deprivation. Importantly, NZDep scores refer to areas, not
individuals, and are relative - 10% of areas will always be the most socioeconomically
deprived, relative to other areas in New Zealand.
It is also necessary to understand that for both decile 1 and 10 there is no outer bound. This
means that for decile 1 and 10, there is a much larger range in the underlying level of
deprivation (or advantage) compared with other deciles. This is particularly important when
considering decile 10 in the CM Health region. Within decile 10 there is a ‘long tail’ of very
high deprivation scores (Figure 3), indicating that some of the areas within this decile have
significantly higher levels of deprivation on a range of measures compared with those at the
lower end of the decile threshold. CM Health analyses have demonstrated that the scores in
decile 10 are particularly skewed towards higher levels of socioeconomic deprivation for the
CM Health population compared with other DHBs.
Figure 3 Distribution of NZDep2018 scores for the whole of NZ, with the NZDep2018 decile scale
superimposed21
19 Atkinson J, Salmond C, Crampton P (2019). NZDep2018 Index of Deprivation, Interim Research Report,
December 2019. Wellington: University of Otago.
20 Note the NZDep scores are the opposite of the decile system used in the education sector.
21 Atkinson J, Salmond C, Crampton P (2019). NZDep2018 Index of Deprivation, Interim Research Report,
December 2019. Wellington: University of Otago.
Page 21 of 74Demography
Age, sex and usually resident (UR) population count are rated as very high quality data by the
2018 Census External Data Quality Panel. However, as discussed in the chapter on use and
interpretation of data, ethnicity data from the 2018 Census have been graded as moderate
quality (page 14). Importantly, the Census is likely to underestimate the proportion of the CM
Health population who identify as Maaori, Pacific and Asian ethnicities.
For this section on ethnic and age composition, the estimated resident (ER) population for
2018 of the CM Health rohe (area) has been used rather than the census UR population. This
is in keeping with Stats NZ advice, that where available, the ER population is the most
appropriate source to use for planning purposes22.
Gender composition by age
As for the total New Zealand population, the gender composition of the CM Health population
is relatively equally split between female and male for younger and middle-aged populations.
However, in those aged 75 years and over, 56% of the population are female (Table 2). This
reflects the shorter life expectancy of males; for example, in 2019 the life expectancy at birth
for females in the CM Health population was 83.2 years compared with 79.4 years for males.
Table 2 Gender composition within age groups of the ER population of CM in 2018
0-14 yrs 15-24 yrs 25-44 yrs 45-64 yrs 65-74 yrs 75 yrs & Total
over
Female 62,070 40,230 80,970 67,840 19,200 13,710 284,020
49% 48% 51% 51% 51% 56% 50%
Male 65,870 43,990 78,960 65,170 18,220 10,780 282,889
51% 52% 49% 49% 49% 44% 50%
Total 127,940 84,220 159,930 133,010 37,420 24,490 567,010
100% 100% 100% 100% 100% 100% 100%
Source: 2020 Stats NZ Pop Projections. Projections produced by Statistics New Zealand according to
assumptions specified by the Ministry of Health.
Ethnic composition and age structure
The CM Health population is a young and ethnically diverse population. In 2018 the ER
population served by CM Health was 567,000 people, 11% of the New Zealand population. In
the CM Health region, based on the ER population for 2018, 16% of people identified as
Maaori, 22% identified as Pacific, 28% as Asian and 34% as NZ European or an ‘Other’ ethnicity
(Table 3). Compared with other DHBs in the Northern Region and the NZ population as a
whole, the population of CM is considerably more multi-ethnic, with a much lower percentage
of the population identified as part of the NZ European/Other group (Table 3 and Figure 4).
22 Stats NZ (2007) A Report on the 2006 Post-enumeration Survey. Wellington: Stats NZ
Page 22 of 74Table 3 ER population by ethnicity for the Northern Region DHBs and NZ total population in 2018
Northland DHB Waitematā DHB Auckland DHB CM Health NZ total
Maaori 36% 10% 8% 16% 17%
Pacific 2% 7% 11% 22% 7%
Asian 4% 25% 32% 28% 15%
NZ Euro/ Other 58% 58% 48% 34% 61%
Total 100% 100% 100% 100% 100%
Source: 2020 Stats NZ Pop Projections. Projections produced by Statistics New Zealand according to
assumptions specified by the Ministry of Health.
Figure 4 ER population by ethnicity for the Northern Region DHBs and NZ total population in 2018
Source: 2020 Stats NZ Pop Projections. Projections produced by Statistics New Zealand according to
assumptions specified by the Ministry of Health.
The ethnic mix of the CM population varies by age. Within CM Health, younger age groups
have a higher proportion of Maaori, Pacific and Asian peoples compared with the population
aged 65 years and over. Among the CM Health population under age 15 years, 24% identify as
Maaori, 29% as Pacific, 24% as Asian and 23% as NZ European/Other (Table 4). In contrast,
55% of CM Health residents aged 65 to 74 years, and 69% of CM Health residents aged 75
years and over, identify as NZ European/Other groups (Table 4 and Figure 5).
Page 23 of 74You can also read