Examining the Change of Human Mobility Adherent to Social Restriction Policies and Its Effect on COVID-19 Cases in Australia - MDPI
←
→
Page content transcription
If your browser does not render page correctly, please read the page content below
International Journal of
           Environmental Research
           and Public Health

Article
Examining the Change of Human Mobility Adherent
to Social Restriction Policies and Its Effect on
COVID-19 Cases in Australia
Siqin Wang 1, * , Yan Liu 1, *            and Tao Hu 2
 1    School of Earth and Environmental Sciences, The University of Queensland, St Lucia QLD 4067, Australia
 2    Center for Geographic Analysis, Harvard University, Cambridge, MA 02138, USA; taohu@g.harvard.edu
 *    Correspondence: s.wang6@uq.edu.au (S.W.); yan.liu@uq.edu.au (Y.L.)

 Received: 7 September 2020; Accepted: 27 October 2020; Published: 29 October 2020

 Abstract: The policy induced decline of human mobility has been recognised as effective in controlling
 the spread of COVID-19, especially in the initial stage of the outbreak, although the relationship
 among mobility, policy implementation, and virus spread remains contentious. Coupling the data
 of confirmed COVID-19 cases with the Google mobility data in Australia, we present a state-level
 empirical study to: (1) inspect the temporal variation of the COVID-19 spread and the change of
 human mobility adherent to social restriction policies; (2) examine the extent to which different
 types of mobility are associated with the COVID-19 spread in eight Australian states/territories;
 and (3) analyse the time lag effect of mobility restriction on the COVID-19 spread. We find that
 social restriction policies implemented in the early stage of the pandemic controlled the COVID-19
 spread effectively; the restriction of human mobility has a time lag effect on the growth rates of
 COVID-19, and the strength of the mobility-spread correlation increases up to seven days after policy
 implementation but decreases afterwards. The association between human mobility and COVID-19
 spread varies across space and time and is subject to the types of mobility. Thus, it is important for
 government to consider the degree to which lockdown conditions can be eased by accounting for this
 dynamic mobility-spread relationship.

 Keywords: human mobility; COVID-19 spread; global pandemic; social restriction policy; Australia

1. Introduction
      A novel coronavirus disease, called COVID-19 by the World Health Organisation (WHO), was
first monitored and reported in December 2019 by the Chinese health authorities [1]. The outbreak
of COVID-19 has spread across China and infected 72,436 Chinese people, of which 1868 died by
17 February [2]. Since 11 March 2020 when WHO announced the COVID-19 outbreak as a global
pandemic, the confirmed COVID-19 cases have been spreading, with up to 118,000 cases in 114 countries,
including Italy, Spain, Iran, the United States, Germany, France, and South Korea, which were the
top eight infected nations in the early stages of the pandemic [1]. Australia, as an island country in
the Global South, had its first confirmed COVID-19 case on 25 January 2020, a Victorian resident in
their early 50s returning from Wuhan, China. COVID-19 spread rapidly in Australia to 298 confirmed
cases by 15 March 2020 [3]. Since then, the Australian Government has implemented a series of
“lockdown” policies to limit the transmission of COVID-19 infection by restricting human mobility,
keeping social distances, shutting down local communities, and encouraging residents to stay at home
with the exceptions of limited outdoor activities in local neighbourhoods [3]. As the growth rate of
confirmed cases declined since early April and the growth curve further flattened in May, some national
restrictions were lifted on 12 May. However, Australia experienced the second wave of the pandemic in

Int. J. Environ. Res. Public Health 2020, 17, 7930; doi:10.3390/ijerph17217930    www.mdpi.com/journal/ijerph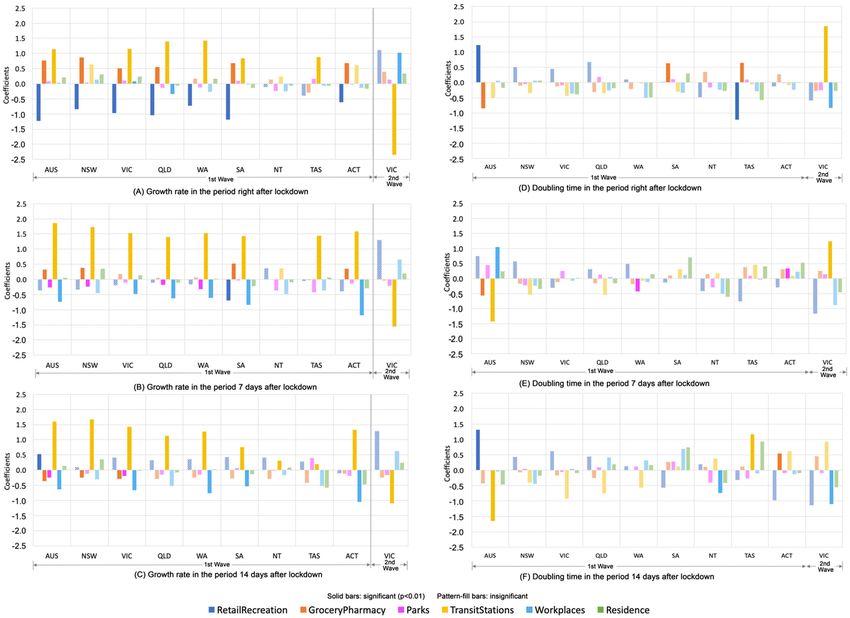
Int. J. Environ. Res. Public Health 2020, 17, 7930                                                   2 of 17

mid-June due to international travellers coming back to Victoria. A series of local closure policies were
re-introduced, mainly in Victoria and New South Wales, while other state’s borders remain closed.
     With the two-wave pattern in Australia, a growing debate has emerged regarding the efficacy of
the lockdowns, how much these policies affect human mobility, when and how the lockdowns should
be eased, and whether it is possible to lift restrictions without unleashing additional waves of infection.
An assessment of how the change of human mobility is adherent to social restriction policies and how
mobility levels are associated with the growth rate of COVID-19 cases has been, and continues to be,
urgently required and valuable in helping to navigate the policy dilemma and understanding the
determinants of controlling the infection. In response to this pressing need, this study aims to achieve
three objectives: (1) examining the temporal variation of COVID-19 spread and the change of mobility
levels adherent to social restriction policies in eight Australian states/territories; (2) modelling and
assessing the extent to which different types of mobility are associated with the COVID-19 spread;
and (3) evaluating the time lag effect of mobility restriction on the COVID-19 spread.
     To tackle these three objectives, we utilise data from the Google mobility report [4]. Google mobility
data provides GPS-derived indices of how visits and length of stay at different places change compared
to a pre-pandemic baseline, reflecting a behavioural switch to social restriction policies that are
increasingly being implemented [4]. The advantage of Google mobility data is its large coverage of
more than 130 countries at the national level and partially at the state or municipal level in some
countries. Google mobility data has been used in some national-level studies e.g., [5–8], as well as
studies at a smaller scale, revealing within-country variations over time e.g., [9,10]. In the context
of Australia, there are limited empirical studies using survey data to investigate the relationship
among transmission of COVID-19, social restriction policies, and human mobility [10,11]. In addition,
Zachreson et al. used Facebook mobility data to produce spatial transmission risk assessment in local
government areas in Melbourne [12]. However, the cross-state variation of the relationship between
mobility change and virus spread is less explored, which is the focus of our study.
     Methodologically, agent-based modelling has been employed in survey-based studies in the
Australian context by using mobility and case confirmation data at the individual level [13,14].
For empirical studies at the aggregated population level, some common regression models that have
been used in current scholarship include a negative binomial regression [15] with the dependent
variable as categorized groups of the infected population due to the non-normal, highly-skewed,
and non-continuous nature of COVID-19 data; a multiple linear regression model linking the number
of daily confirmed cases to multi-dimensional variables [16]; and a panel regression model with
consideration of a certain number of days after the case confirmation date [5]. The most relevant work
to ours is the three-country comparison study by Tran et al., which focuses on the intensive lockdown
period at the initial stage of the pandemic, with Australia as one of the case studies at the national
level [7]. Employing a similar approach as used in their work, our study is central to the dynamics of
the relationship between virus spread and human mobility at the state level across a longer timeline
of the pandemic, emphasising the comparison of the first and second wave in Australia. Moreover,
we also extend the examination of the time lag effect to include three timeframes (right after lockdown
and 7 and 14 days after lockdown) to have a more holistic picture of the relationship between virus
spread and mobility change.
     Our analytical results show that the social restriction policies implemented in the early stage
of the first wave controlled the COVID-19 spread effectively, and the restriction of human mobility
has a time-lag effect on growth rates, which is more effective in controlling COVID-19 spread within
seven days after the implementation of restrictions. In contrast, the types of mobility associated with
the COVID-19 spread vary across the two waves and the Australian states/territories. We interpret
these results with caution and link them to the findings from other countries for a discussion of
policy implications.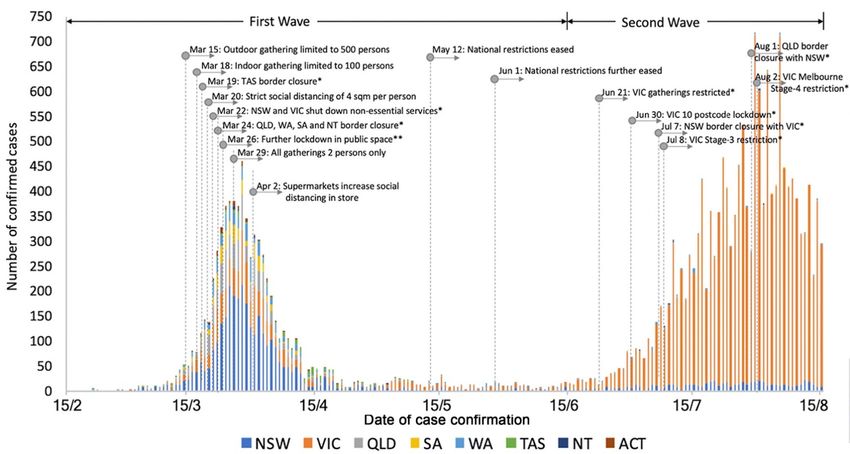
Int. J. Environ. Res. Public Health 2020, 17, 7930                                                                 3 of 17

2. Materials and Methods
      We collected the daily confirmed COVID-19 cases from 15 February to 15 August 2020 from the
Department of Health, Australian Government [3]. Mobility data were retrieved from Google COVID-19
Community Mobility Reports in the same period of time [4]. Google provides GPS-derived location
information about the amount of time people spent in six types of locations, including workplaces,
residential, parks, grocery and pharmacy, retail and recreation, and transit stations. Accordingly,
mobility measures are divided into six categories with accessibility to these six types of locations,
such as mobility to parks. Each type of data stream is encoded as a percentage change in the mobility
metric, based on a baseline derived for the period of 3 January to 6 February 2020. These mobility data
are regularly updated and released to the public for the express purpose of supporting public health
bodies in their response to COVID-19. All of these datasets are fully anonymised and aggregated at
the level of the Australian state/territory over each day.
      Since 15 March 2020, the Australian Government has started to implement a series of travel
restrictions, self-isolation, social distancing, and lockdown policies at the national level, with border
closure policies implemented by state governments (Table 1). After the growth curve of COVID-19
flattened in May, some national restrictions were lifted on 12 May, but were reintroduced in mid-June
in the state of Victoria due to the second wave of the pandemic. A series of local closure policies were
implemented again, mainly in Victoria and New South Wales, while other states’ borders remain closed.
Considering this unique two-wave pattern, our inspection of the temporal variation of COVID-19,
mobility levels, and policy implementation at the first stage focuses on the full timeline from 15 February
to 15 August, while the examination of the relationship between COVID-19 and mobility levels is
divided into 2 periods, covering Australia as a whole and all states/territories in the 1st wave (15 March
to 15 June) and focusing on Victoria as the main source of confirmed cases in the 2nd wave (15 June to
15 August).

            Table 1. Social restriction policies implemented at the national and state level in Australia.

               Date                                                   Policy Restrictions
            March-15:                                Outdoor gatherings limited to 500 persons
            March-18:                                 Indoor gatherings limited to 100 persons
            March-19:                                           Tasmania border closure
            March-20:                               Strict social distancing of 4 sqm per person
            March-22:                        New South Wales and Victoria shut down non-essential services
            March-24:              Queensland, West Australia, South Australia, and Northern Territory border closure
                                   Further lockdown of restaurants, cafes, food courts, auction houses, open house
            March-26:
                                         inspections; weddings restricted to 5 people; funerals to 10 people
            March-29:                                       All gatherings 2 persons only
             April-2:                  Australian supermarkets increase in store social distancing measures
             May-12:                                         National restrictions eased
              June-1:                                    National restrictions further eased
             June-21:                                        Victoria gatherings restricted
             June-30:                                        Victoria 10 postcode lockdown
              July-7:                                New South Wales border closure with Victoria
              July-8:                                         Victoria Stage 3 restriction
            August-1:                           Queensland border closure with New South Wales again
            August-2:                                   Victoria Melbourne Stage 4 restriction
                               Note: italic: Policies are implemented at the state level; Source: [3].

     Methodically, we first generated a combined mobility index (CMI) to represent the overall mobility
change in a day compared to the pre-pandemic period, calculated as the mean of the mobility of each
type i in a day t:
                                                P6
                                                     Mobilityi
                                       CMI(t) = i=1            .                                    (1)
                                                       6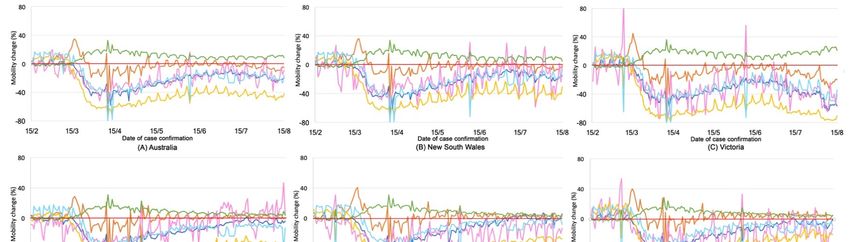
Int. J. Environ. Res. Public Health 2020, 17, 7930                                                        4 of 17

     For COVID-19 cases, we examined its change over time alongside the implementation of the key
policy interventions. Next, we calculated the growth rate and the doubling time of COVID-19 cases.
Growth rate (percentage) at day t is calculated as [7]:

                                                               C(t) − C(t − 1)
                                                     GR(t) =                   ,                             (2)
                                                                  C(t − 1)

where C(t) is the cumulative number of confirmed cases at day t.
      We also calculated the doubling time as another measure of virus spread. Compared to the growth
rate as a percentage value, the doubling time as a typical epidemic measure indicates how long it
will take for the infected population to double in size. It has also been commonly used in previous
COVID-19 studies (e.g., [7]) to inform the impact of policy interventions on epidemic transmission,
especially at the initial stage of the exponential growth. The doubling time (day) of confirmed cases at
day t is calculated as:
                                                       Ln(2)
                                          DT(t) =                .                                   (3)
                                                   Ln(1 + GR(t))
     It has been acknowledged that the median incubation period was estimated to be 5.1 days, and 97.5%
of COVID-19 patients develop symptoms within 11.5 days of infection [17]. Therefore, we selected three
scenarios, accounting for the delays in reporting from the illness onset date, testing, and incubation over
three time periods—right after the lockdown date, 7 days after the lockdown date, and 14 days after
the lockdown date—to examine the relationship between mobility change and growth rate/doubling
time of COVID-19 cases. We then conducted a correlation analysis between CMI and the growth
rates/doubling time of COVID-19 cases and further investigated the association between each of the
six types of mobility measures and growth rates/doubling time in Australia as a whole and in each
state/territory via a series of ordinary least square regression models, accounting for the time lag effect:

                         COVs,t = αS + βi Mobi, s,t−n + γt + εs,t            (n = 0, 1, . . . , t − 1),      (4)

where COV denotes the growth rate/doubling time of COVID-19 cases in the state s on date t as
described above; Mobi denotes each type i (i = 1, 2 . . . 6) of mobility; and Mobi, s,t−n is the mobility
index in state s on the date (t − n). In this research, n equals 0, 7, and 14. βi is the standardised
coefficient for each type of mobility; ε is the standardised error; αS denotes the fixed place effect of
state s and γt denotes the fixed date effect for a transmission period after date t.
     In our interpretation of the regression model, we emphasise the magnitude and significance of
the coefficients, indicating the extent of the association between COVID-19 spread and the different
types of mobility, rather than the fixed place effect and fixed date effect, denoting the variations of
unobserved potential confounders underlying virus spread across space and time.

3. Results

3.1. The Change of Human Mobility and Policy Intervention
     We first examine the two-wave pattern of the COVID-19 spread in Australia alongside the timeline
of policy implementation (Figure 1). It is observed that COVID-19 cases increased exponentially from
early March to 1 April 2020. Since 15 March, the Australian Government started to implement a
series of travel restrictions, self-isolation, social distancing, and lockdown policies at the national level,
including outdoor gatherings being limited to 500 people on 15 March; indoor gatherings being limited
to 100 people on 18 March; further lockdown of restaurants, cafes, food courts, auction houses, and open
house inspections on 26 March; and all gatherings of 2 persons only on 29 March. Simultaneously,
Tasmania State Government closed its border on 19 March; New South Wales and Victoria shut down
non-essential services on 22 March; Queensland, West Australia, South Australia, and Northern
Territory State Government also implemented border closure policies on 24 March to prevent virus
Int. J. Environ. Res. Public Health 2020, 17, 7930                                                  5 of 17

transmission across states. After almost two weeks since the first social restriction implemented on
15 March, daily confirmed cases reached a peak of 311 on 31 March as the turning point and started to
decrease afterwards. With the prompt response of governments at the different levels and the control
of human mobility, the daily confirmed cases have dropped from 611 on 23 March to 7 on 12 May.
National restrictions were eased on 13 May and further eased on 1 June. However, daily confirmed
cases started to increase again in mid-June, mainly caused by international travellers coming back
to Victoria [18], leading to the second wave of the pandemic after three months of control. Victoria
Government locked down 10 postcode areas on 30 June, applied Stage 3 Stay at Home restrictions
on 8 July, and then upgraded to Stage 4 restriction on 2 August after it reached the peak of 717 daily
confirmed cases on 30 July. Overall, the restriction policies implemented in the early stage of the 1st
wave controlled the COVID-19 spread effectively. Although international travel led to the 2nd wave,
domestic policies have been reintroduced to quickly intervene local transmission and reduce the daily
confirmed cases to 293 on 15 August.
      Following this timeline, we examine the average CMI within 3 days after the implementation of the
key policies (Figure 2). The CMI in all states/territories have decreased consistently with the increasing
restrictions of travel bans, social distancing, and self-isolation from 15 March to 2 April. After the
turning point on 2 April, the CMI in all states/territories started to increase and the sharpest increase
of mobility appeared in Northern Territory from 2 April to 12 May. After 1 June, the CMI of each
state/territory varied over time. The human mobility in Tasmania remained in a relatively low level
(e.g., around −20% on 30 June and afterwards) compared to the CMI in Northern Territory increasing
from 0% on 15 May to 13.3% on 1 August. It may be possible that the weather in Northern Territory on
winter days (May to August in Australia) is warmer and more inviting for outdoor activities compared
to cold winter days in Tasmania, making people less active and mobile. It is noteworthy that the CMI
in Victoria started to decrease after 21 June and so too for New South Wales and Australian Capital
Territory after 8 July. This means that the re-introduction of restriction policies in Victoria responding
to the second wave of the pandemic also affects the mobility in the adjacent state/territory.
      We further examine each type of mobility in each state/territory (Figure 3). The pattern of mobility
clearly presents a regular variation across weeks, evident as weekly cycles in most types of mobility
with couples of “outliers”, indicating a substantial change of mobility on public holidays. Compared to
the baseline (the period of 3 January to 6 February 2020 before the global COVID-19 pandemic), there are
some common changes of mobility observed in all states/territories: the mobility to residence increased,
indicating that more people stayed at home; the mobility to transit stations and retail/recreation
decreased, reflecting that people used public transport and recreational facilities less; the mobility to
workspace dropped substantially from 15 March to 15 April but started to increase from 15 April to
15 August, except in Victoria, indicating that people have been getting back to their work/business
routines; the mobility to grocery/pharmacy substantially increased right after the implementation
of the social restriction policy on 15 March, which coincided with the “panic-buying” where people
stockpiled groceries and medicines to cope with the virus [19]. Finally, the mobility to parks varies
across states/territories. The overall trend of mobility to parks decreased from 15 March to 15 April in
all states but turned to increase slightly after 15 April. Compared to the time before the COVID-19
outbreak, most states have less mobility to parks from 15 March to 15 June, while the Northern Territory
has more since May. Australian Capital Territory is observed to have a clear weekly circle with a
substantial increase of mobility to parks over weekends. Some spikes are also observed in Victoria,
New South Wales and South Australia on 14 June, Queen’s Birthday, reflecting the increase of park
visiting on public holidays. It is noteworthy that the CMI in Victoria declined after 21 June as a result
of the reintroduction of social restriction policies responding to the resurge of cases starting in early
June. Then, the CMI in Victoria continued to decline but was accompanied by an increasing number
of confirmed cases; such contrast trends reflect the complex relationship between virus spread and
human mobility. It may be possible that the reintroduction of gathering limits in Victoria in early
June was not restrictive enough to control the virus spread; Victoria did not completely lock down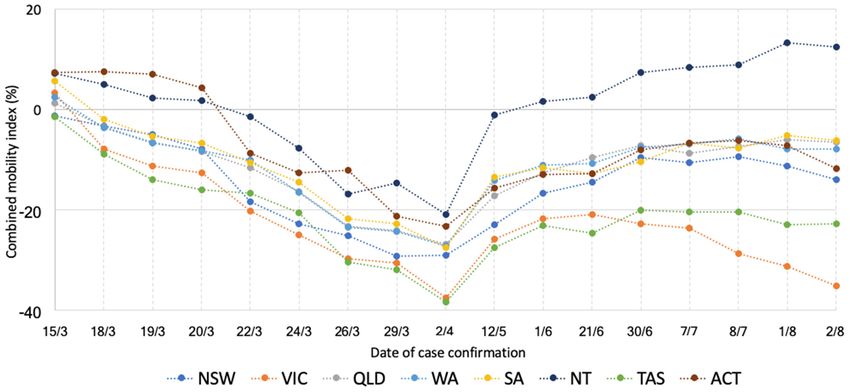
Int. J. Environ. Res. Public Health 2020, 17, 7930                                               6 of 17

the hot spot, the inner city in Melbourne, until 2 August. In other words, the stringency and types of
social restriction policy and the areas where policies were implemented collectively affect the virus
spread. In sum, the implementation of social restriction policies at the early stage of the COVID-19
outbreak largely reduced human mobility to public facilities and spaces and such a reduction has
been gradually eased with the lifting of restrictive policies, although the overall mobility during the
COVID-19 outbreak remained lower than that in the period before the outbreak.
Int. J. Environ. Res. Public Health 2020, 17, 7930                                                                                                                                  7 of 17
 Int. J. Environ. Res. Public Health 2020, 17, x                                                                                                                                     7 of 18

       Figure1.1. Confirmed
      Figure      Confirmed COVID-19
                              COVID-19 cases
                                          cases in
                                                 in each
                                                    each state/territory
                                                         state/territory and
                                                                         and aatimeline
                                                                                timeline of
                                                                                         of policy
                                                                                             policyintervention.
                                                                                                    intervention. Note:
                                                                                                                  Note: NSW:
                                                                                                                        NSW: New
                                                                                                                               New South
                                                                                                                                     South Wales;
                                                                                                                                            Wales; VIC:
                                                                                                                                                     VIC: Victoria;
                                                                                                                                                           Victoria; QLD:
                                                                                                                                                                      QLD: Queensland;
                                                                                                                                                                           Queensland;
      SA:
       SA: South Australia; WA: West Australia; TAS: Tasmania; NT: North Territory; ACT: Australian Capital Territory; *: Policies at the state level; **: Furtherlockdown
           South   Australia; WA:  West Australia;   TAS:  Tasmania;  NT:  North  Territory; ACT:  Australian  Capital Territory; *: Policies at the state level; **: Further lockdown
      includes  the closure  of restaurants, cafes, food  courts, auction houses,  open  house  inspections; weddings   restricted to 5 people;  funerals  to 10
       includes the closure of restaurants, cafes, food courts, auction houses, open house inspections; weddings restricted to 5 people; funerals to 10 people.  people.
Int. J. Environ. Res. Public Health 2020, 17, 7930 8 of 17
Int. J. Environ. Res. Public Health 2020, 17, x 8 of 18
Figure
Figure 2. Combined mobility
2. Combined mobility index
index (CMI)
(CMI) within
within 33 days
days after
after the
the implementation
implementation of each policy.
of each policy. Note:
Note:
italic
italic policies
policies are
are at
at the
the state
statelevel.
level. March-15:
March-15: Outdoor
Outdoor gatherings
gatherings limited
limited to
to 500
500 persons;
persons; March-18:
March-18:
Indoor to 100 persons; March-19: Tasmania border closure;
Indoor gatherings limited to 100 persons; March-19: Tasmania border closure; March-20: Strict
gatherings limited March-20: Strict social
social
distancing
distancing ofof 44 sqm
sqm per
per person; March-22: New
person; March-22: New South
South Wales
Wales and
and Victoria
Victoria shut
shut down non-essential services;
down non-essential services;
March-24: Queensland, West Australia, South Australia, and Northern Territory borders closure; March-26:
March-24: Queensland, West Australia, South Australia, and Northern Territory borders closure; March-26:
Further lockdown of restaurants, cafes, food courts, auction houses, open house inspections; weddings
Further lockdown of restaurants, cafes, food courts, auction houses, open house inspections;
restricted to 5 people; funerals to 10 people; March-29: All gatherings 2 persons only; April-2: Australian
weddings restricted to 5 people; funerals to 10 people; March-29: All gatherings 2 persons only; April-
supermarkets increase in store social distancing measures; May-12: National restrictions eased; June-1:
2: Australian supermarkets increase in store social distancing measures; May-12: National restrictions
National restrictions further eased; June-21: Victoria gatherings restricted; June-30: Victoria 10 postcode
eased; June-1: National restrictions further eased; June-21: Victoria gatherings restricted; June-30:
lockdown; July-7: New South Wales border closure with Victoria; July-8; Victoria Stage 3 restriction; August-1:
Victoria 10 postcode lockdown; July-7: New South Wales border closure with Victoria; July-8; Victoria Stage 3
Queensland border closure with New South Wales again; August-2: Victoria Melbourne Stage 4 restriction.
restriction; August-1: Queensland border closure with New South Wales again; August-2: Victoria Melbourne
Stage 4 restriction.Int. J. Environ. Res. Public Health 2020, 17, 7930 9 of 17
Int. J. Environ. Res. Public Health 2020, 17, x 9 of 18
Six types
Figure 3. Six types of
of mobility
mobility in
in each
each Australian
Australian state/territory.Int. J. Environ. Res. Public Health 2020, 17, 7930 10 of 17
Int. J. Environ. Res. Public Health 2020, 17, x 10 of 18
3.2. The
3.2. The Association
Association between
between Human
Human Mobility
Mobilityand
andCOVID-19
COVID-19 Spread
Spread
Figure44shows
Figure showsthe thepattern
patternofofthe
theCMI,
CMI,growth
growthrates,
rates,and
anddoubling
doublingtime time of
of COVID-19
COVID-19 confirmed
confirmed
casesduring
cases duringthethepandemic
pandemicin inAustralia
Australiaandandinin each
each state/territory.
state/territory.The
Thegrowth
growthrate
rateof
of confirmed
confirmedcases
cases
reached peaks in most states/territories (except Northern Territory and Australian Capital
reached peaks in most states/territories (except Northern Territory and Australian Capital Territory) Territory)
before 15
before 15 March
March whenwhenthe thesocial
socialrestriction
restrictionpolicies
policiesstarted
startedto
tobe
beimplemented.
implemented. Two Two weeks
weeks ofof the
the
increasinglevel
increasing levelofof social
social restrictions
restrictions fromfrom 15 March
15 March to 30 to 30 March
March (light
(light and and
dark dark
grey grey shadowed
shadowed periods
periods
in Figurein4)Figure
largely4)reduced
largely reduced
the growththe growth
rate andrate and lengthened
lengthened the doubling
the doubling time oftime of confirmed
confirmed cases,
cases, accompanied
accompanied by a substantial
by a substantial decrease decrease
of humanof humanThe
mobility. mobility.
growthThe rategrowth
after 15rate
Aprilafter 15 April
remained at
aremained
low levelatinaall
low level in all states/territories
states/territories except Victoria, except
where Victoria, wherecurve
an increasing an increasing
of growth curve
rate of growth
appeared
rate appeared
after 15 June but after 15 Juneflattened
gradually but gradually
towardsflattened towards 15 August.
15 August.
Figure 4. Combined mobility index, growth rates, and doubling time in each Australian state/territory.
Figure 4. Combined mobility index, growth rates, and doubling time in each Australian
Note: In each graph, Y-axis on the left denotes doubling time (day); Y-axis on the right denotes growth
state/territory. Note: In each graph, Y-axis on the left denotes doubling time (day); Y-axis on the right
rates (%); A combined mobility index is shown on the Y-axis on the right of each row.
denotes growth rates (%); A combined mobility index is shown on the Y-axis on the right of each row.
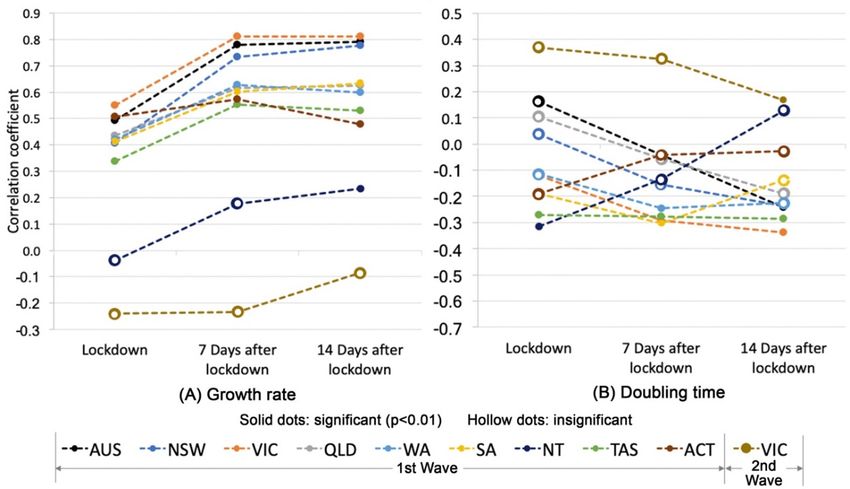
The correlation coefficients between CMI and growth rates in the first wave (15 March to 15 June)
The correlation
are significantly coefficients
(p < 0.01) positivebetween CMI except
in most states and growth rates inTerritory
the Northern the first (Figure
wave (15 March
5A), to 15
indicating
that a higher level of mobility is associated with a higher level of growth rates. The magnitude5A),
June) are significantly (p < 0.01) positive in most states except the Northern Territory (Figure of
indicating that a higher level of mobility is associated with a higher level of growth rates. The
magnitude of correlation coefficients in most states increases from the period right after lockdown toInt. J. Environ. Res. Public Health 2020, 17, 7930 11 of 17
Int. J. Environ. Res. Public Health 2020, 17, x 11 of 18
the period seven
correlation days after
coefficients in mostlockdown, reflectingfrom
states increases that the
the period
incubationrightperiod from 7 days
after lockdown to 14period
to the days
brings in a time-lag
seven days effect of human
after lockdown, mobility
reflecting onincubation
that the growth rates. However,
period from 7the correlation
days to 14 days between
bringsCMIin a
and growth
time-lag rates
effect is insignificant
of human mobilityinonVictoria
growthinrates.
the second wave
However, the(15 June to 15between
correlation August). Different
CMI from
and growth
growth rates, the correlation
rates is insignificant in Victoriabetween CMI wave
in the second and doubling
(15 June to time (Figure 5B)
15 August). is insignificant
Different from growth in most
rates,
states for both between
the correlation waves. The CMIsignificant
and doublingcorrelations
time (Figureonly5B)
appear in three scenarios
is insignificant in Tasmania,
in most states while
for both waves.
there is no substantial
The significant change
correlations onlyofappear
the magnitude of correlation
in three scenarios over time.
in Tasmania, whileThis indicates
there that the
is no substantial
relationship
change of the between
magnitudethe doubling time and
of correlation overmobility
time. Thisvaries across the
indicates thattimeline of the pandemic.
the relationship betweenThis the
result is different from the findings by Tran et al. [7] where their report shows
doubling time and mobility varies across the timeline of the pandemic. This result is different from that the number of
confirmed
the findings cases afteretthe
by Tran al. lockdown date report
[7] where their was significantly
shows that associated
the numberwith an increase
of confirmed in doubling
cases after the
time, particularly
lockdown date was atsignificantly
the initial stage of the pandemic.
associated This isinpossibly
with an increase doubling due to the
time, fact that the
particularly number
at the initial
of confirmed
stage cases at the
of the pandemic. initial
This stage tends
is possibly be in
due to the anthat
fact exponential
the number pattern but has more
of confirmed casesvariations at
at the initial
the later
stage tendsstage of in
to be the
anpandemic,
exponential correspondingly
pattern but has being more difficult
more variations at thetolater
explain
stagebyof the pandemic,
change of
mobility.
correspondingly being more difficult to explain by the change of mobility.
Figure 5.
Figure Correlation between
5. Correlation between CMICMI and
and growth
growth rates
rates (A),
(A), and
and between
between CMI
CMI and
and doubling
doubling time
time (B)
(B) in
in
Australia and
Australia andeach state/territory
each overover
state/territory threethree
periods of time.ofNote:
periods time.the values
Note: theof values
correlation coefficients
of correlation
are provided in Supplementary Materials.
coefficients are provided in Supplementary Materials.
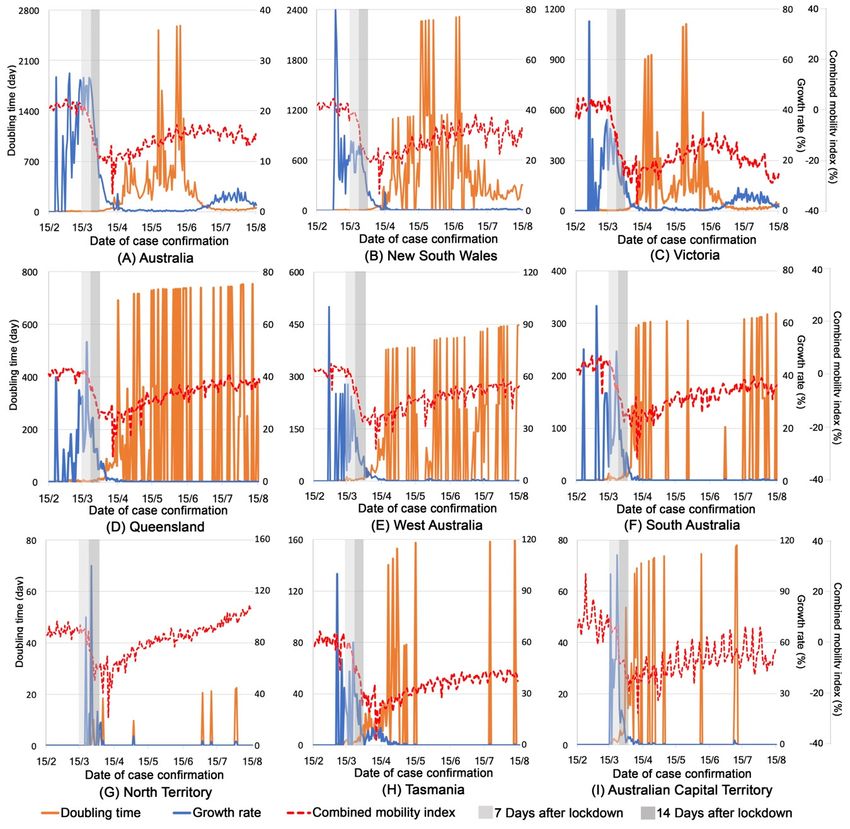
Figure 6 compares the regression coefficients of each type of mobility in each state/territory over
Figure 6 compares the regression coefficients of each type of mobility in each state/territory over
three periods of time (right after, 7 days after the lockdown date, and 14 days after the lockdown date).
three periods of time (right after, 7 days after the lockdown date, and 14 days after the lockdown
In the first wave, the growth rate of confirmed cases has a negative association (significant at p < 0.01)
date). In the first wave, the growth rate of confirmed cases has a negative association (significant at p
with the mobility to retail/recreation only in the period right after lockdown (Figure 6A) and with
< 0.01) with the mobility to retail/recreation only in the period right after lockdown (Figure 6A) and
the mobility to workspaces in most states only in the period in the period seven days and 14 days
with the mobility to workspaces in most states only in the period in the period seven days and 14
after lockdown (Figure 6B,C); while the mobility to transit stations is positively (significant at p < 0.01)
days after lockdown (Figure 6B,C); while the mobility to transit stations is positively (significant at p
associated with growth rates in all states across three periods of time and its magnitude increases over
< 0.01) associated with growth rates in all states across three periods of time and its magnitude
time (Figure 6A–C), indicating that a higher level of public transit usage is linked to a higher level of
increases over time (Figure 6A–C), indicating that a higher level of public transit usage is linked to a
growth rates. Such a linkage becomes stronger after a seven day incubation period and slightly weaker
higher level of growth rates. Such a linkage becomes stronger after a seven day incubation period
after a 14 day incubation period, reflecting the time lag effect of mobility on COVID-19 spread and the
and slightly weaker after a 14 day incubation period, reflecting the time lag effect of mobility on
delay of policy intervention.
COVID-19 spread and the delay of policy intervention.
Different to the first wave, the mobility to transit stations in Victoria in the second wave is
significantly and negatively associated with growth rates across three periods of time (Figure 6A–C)
and positively associated with doubling time (Figure 6D,E); while the mobility to workspaces is
positively associated with growth rates only in the period right after lockdown (Figure 6A) but
negatively associated with doubling time (Figure 6D). This indicates that growth rates are largely tiedInt. J. Environ. Res. Public Health 2020, 17, 7930 12 of 17
Int. J. Environ. Res. Public Health 2020, 17, x 13 of 18
Figure 6. Regression coefficients of six types of mobility in Australia and each state/territory over three periods of time. Note: Regression coefficients are provided in
Figure 6. Regression coefficients of six types of mobility in Australia and each state/territory over three periods of time. Note: Regression coefficients are provided
Supplementary Materials.
in Supplementary Materials.Int. J. Environ. Res. Public Health 2020, 17, 7930 13 of 17
Different to the first wave, the mobility to transit stations in Victoria in the second wave is
significantly and negatively associated with growth rates across three periods of time (Figure 6A–C)
and positively associated with doubling time (Figure 6D,E); while the mobility to workspaces is
positively associated with growth rates only in the period right after lockdown (Figure 6A) but
negatively associated with doubling time (Figure 6D). This indicates that growth rates are largely tied
to the increasing level of people getting back to workspaces after three months of working at home in
the second wave of the pandemic.
4. Discussion
Drawing on the COVID-19 data and Google mobility data, our study contributes an empirical
study of the relationship among human mobility, social restriction policies, and COVID-19 spread in
Australia. Due to the transmission dynamics and confounders underlying the epidemiological studies,
we interpret our findings with caution and link them to the empirical experiences in other countries
for a more holistic understanding of how human mobility intertwines with COVID-19 spread and for
better policy implications.
First, a visual inspection of the COVID-19 cases and mobility level alongside the timeline of policy
interventions in Australia suggests that social restriction policies controlled the COVID-19 spread
effectively in the early stage of the first wave of the pandemic, during which the substantial decrease of
human mobility as a consequence of the increasing level of social restriction was followed by a steep
drop in growth rates and a sharp increase in doubling time of COVID-19 spread. This dramatic decline
of growth rates could potentially reflect the fundamental association between the dynamics of the
intense lockdown orders and virus transmission in the initial stage of the pandemic, also observed
by [14]. The reduction of mobility has been gradually eased with the lifting of restriction policies in
mid-May. However, the overall mobility still remained at a low level afterwards and has not been fully
restored to the prepandemic level after the national restrictions were lifted. Moreover, there are also
imperfect correspondences between social restriction and mobility levels to some degree, with mobility
declining prior to formal restriction and in certain circumstances, increasing prior to formal restrictions
easing and such observations have also been found in other countries including China, U.S., Sweden,
and South Korea [7,20,21]. People may have intended to reduce access to public facilities and spaces
with the precautions of virus spread before the implementation of social restrictions.
Second, the control of mobility has a time lag effect on COVID-19 spread as the span of the
mobility-spread relation lasts from 7 to 14 days, which is possibly tied to the incubation period.
We observe an increase in the strength of the mobility-spread correlation over the period from the time
when restriction policies were implemented to 7 days after the policy implementation, but a decline in
correlation from 7 days to 14 days after the policy implementation. There are more mixed patterns of
mobility-spread correlation after the initial stage of intensive lockdowns. A possible explanation is that
social restriction policies may influence virus spread not merely because of their direct effect on mobility
levels, but also through their impact on other forms of individual behaviours, including individual
social distancing, hygiene, and mask wearing [5]. The government level supervision and the efficacy
of policy implementation, together with environmental conditions (such as changes in weather
conditions) also affect growth rates in a manner that weakens the association between mobility and
virus spread [14,22]. For example, the increase of mobility in Northern Territory after 1 April was
followed by a well-controlled flat curve of growth rates compared to an obvious increase of growth
rates in Tasmania in the same circumstance, possibly as the temperature on winter days in Northern
Territory is much higher than that in Tasmania, which helps to control the virus spread.
Third, there exists a dynamic association between mobility in different types and COVID-19
spread, and the magnitude of such an association varies across space and time. In the first wave,
growth rates were positively associated with the mobility to public transit and grocery/pharmacy in
most states, but negatively associated with the mobility to retail/recreation and workspaces. With the
growth of COVID-19 cases, people prefer to stay at home and avoid places of retail/recreation. In theInt. J. Environ. Res. Public Health 2020, 17, 7930 14 of 17
meantime, they are required to work from home instead of workspaces. Such a finding has also been
observed by Kissler et al. [23] in their study of New York City where the reduction in commuting
movements is negatively correlated with COVID-19 prevalence. Furthermore, the mobility to public
transit appears to be the only factor positively linked to the rise of growth rates over three periods of
time in most states and such a linkage becomes stronger after the 7 day incubation period. However,
different to the first wave, the mobility to public transit was negatively associated with the COVID-19
spread in the second wave of the pandemic in Victoria, where the rise in growth rates may be more
subject to the increasing number of people moving back to workspaces after 3 months of working at
home. This inconsistent relationship between mobility and COVID-19 spread reflects the fact that
virus spread is not only relevant to variation in mobility levels, but is also subject to variation in other
forms of preventative behaviours and perceptions, whether voluntary or government enforced [24].
Without consideration of the complexity of other potential confounders, which may have tangible and
intangible impacts on COVID-19 spread, it would be arbitrary to conclude that any observed drop in
growth rates is attributed to changes in mobility levels.
While the interpretation of our analytical results provides by no means definitive conclusions,
it serves as an initial attempt that draws on publicly available measures of human mobility and
COVID-19 data to study an epidemiological question with enormous social importance. There are
certain limitations, imposing challenges in understanding the mobility-spread relationship. First,
Google mobility data provides a relative measure of mobility change compared to the period from
3 January to 6 February 2010 as the baseline. The selection of the baseline may introduce some biases
across different geographic contexts where human mobility may start to decline as an early reaction to
COVID-19 and thus, it may not be representative of the prepandemic level. Second, the measure of
CMI can be extended from the mean value as is used in this study to a weighted measure responding
to the risk level of mobility by type. For example, based on the assumption that the mobility to the
workspace is subject to a higher level of infection risk than the mobility to parks, we can assign higher
weight to the former, which may result in a more realistic measure of CMI. Third, there are several
types of delays that need to be considered in future analysis to reduce the data bias, including the delay
between the date of the real-time mobility measure by Google data and the reported date of confirmed
cases, the reporting delay from the illness onset date, and the delay further introduced by incubation
and testing. Future work needs to examine over a longer period, ideally ranging from 1 day up to
21 days, with an incremental one day interval to provide a more detailed assessment of the time lag
effect of mobility on virus spread. Moreover, the estimated growth rate from the incidence date should
take into account the delay period to better quantify the impact of lockdown on the transmission
dynamics. Fourth, further attention can be given to the exploration of the fixed place and date effect
in the regression model to capture the temporal variation in potential confounders that may occur
within geographic contexts over time. Since Google only provides state/regional level mobility reports,
other data sources such as Geotagged Tweets can also help estimate human mobility changes in fine
scale geographic areas [25–27]. Fifth, it is necessary to have a comparative study on the mobility-spread
relation between Australia and those highly populated countries that have successfully contained the
COVID-19 spread (e.g., South Korean, Japan and UK) for policy implications. For example, the Oxford
COVID-19 Government Response Tracker (OxCGRT) systematically collects information on several
different common policy responses that governments have taken to respond to the pandemic and
proposes a stringency index for each country [28]. The quantitative policy index provides a new way
to explore the associations among policies, human mobility, and the COVID-19 spread in future work.
Nevertheless, a great deal of caution must be exercised in understanding our findings, which
may not be sufficient to indicate any causal direction between mobility control and virus spread.
Although there is no straightforward way to infer policy prescriptions from our analytical results,
we find suggestive evidence, which may help to mitigate virus spread, especially in the initial stage of
the pandemic. First, the implementation of robust contact tracing systems and self-isolation within the
14 day incubation period would be crucial to attenuate the strength of the mobility-spread relation.Int. J. Environ. Res. Public Health 2020, 17, 7930 15 of 17
Second, the dynamics between the initial lockdown and the later phase of the outbreak driven by
individual behavioural changes reflect the importance of government level supervision and policy
implementation should last for a longer period of time to maintain its efficacy. Third, as the span of
the relationship between mobility and virus spread is suggested to be up to 14 days in our study, it is
important for governments to consider the degree to which lockdown conditions can be eased by
accounting for this window of time.
5. Conclusions
Drawing on data of confirmed COVID-19 cases and Google mobility data in Australia, we present
a state level empirical study to examine how the change of human mobility is adherent to social
restriction policies and how such changes affect COVID-19 spread. Our findings show that social
restriction policies implemented in the early stage of the pandemic controlled the COVID-19 spread
effectively, which largely reduced mobility levels. The overall mobility still remained at a low level
afterwards and has not been fully restored to the prepandemic level after the national restrictions were
lifted at a later stage. The restriction of human mobility has a time lag effect on growth rates in the
initial stage as the strength of the mobility-spread correlation increases up to seven days after policy
implementation but decreases afterwards. However, there are more mixed patterns of mobility-spread
correlation after the initial stage of intensive lockdowns. The association between mobility and
COVID-19 spread varies across space and time and is subject to the types of mobility. Thus, it is crucial
for governments and policy makers to consider the degree to which lockdown conditions can be eased
by accounting for this dynamic mobility-spread relationship.
Supplementary Materials: The following are available online at http://www.mdpi.com/1660-4601/17/21/7930/s1,
Table S1: Correlation coefficients; Table S2. R square of each regression model; Table S3-1. Coefficients of each
type of mobility with growth rate as the dependent variable; Table S3-2. Coefficients of each type of mobility with
doubling time as the dependent variable.
Author Contributions: Conceptualization, S.W. and Y.L.; Data curation, S.W. and T.H.; Formal analysis, S.W.;
Funding acquisition, Y.L.; Methodology, S.W., Y.L., and T.H.; Supervision, Y.L.; Writing—original draft, S.W.;
Writing—review & editing, Y.L. and T.H. All authors have read and agreed to the published version of
the manuscript.
Funding: This research was funded by an Australian Research Council Grant [DP170104235].
Acknowledgments: We would like to thank Shuming Bao in China Data Institute, USA for giving suggestions on
the data collection.
Conflicts of Interest: The authors declare no conflict of interest.
References
1. World Health Organization. Coronavirus Disease 2019 (COVID-19) Situation Report—67. Available
online: https://apps.who.int/iris/bitstream/handle/10665/331613/nCoVsitrep27Mar2020-eng.pdf (accessed on
6 September 2020).
2. NHCPRC (National Health Commission of the People’s Republic of China). COVID-19 Report. Available
online: http://www.nhc.gov.cn/xcs/yqtb/list_gzbd.shtml (accessed on 6 September 2020).
3. Department of Health, Australian Government. Coronavirus (COVID-19) Current Situation and Case
Numbers. Available online: https://www.health.gov.au/news/health-alerts/novel-coronavirus-2019-ncov-
health-alert/coronavirus-covid-19-current-situation-and-case-numbers (accessed on 6 September 2020).
4. Google LLC. Google COVID-19 Community Mobility Reports. Available online: https://www.google.com/
covid19/mobility/ (accessed on 6 September 2020).
5. Bergman, N.K.; Fishman, R. Mobility Levels and Covid-19 Transmission Rates. medRxiv 2020. Available
online: https://www.medrxiv.org/content/10.1101/2020.05.06.20093039v2.full.pdf (accessed on 6 September 2020).
[CrossRef]
6. Maloney, W.; Taskin, T. Determinants of social distancing and economic activity during COVID-19: A global
view. World Bank Group eLibrary 2020. [CrossRef]Int. J. Environ. Res. Public Health 2020, 17, 7930 16 of 17
7. Tran, T.H.; Sasikumar, S.; Hennessy, A.; O’Loughlin, A.; Morgan, L. Interpreting the effect of social restrictions on
cases of COVID-19 using mobility data. Med J. Aust. 2020, 1. Available online: https://www.mja.com.au/system/
files/2020-09/Tran%20mja20.00505%20-%2014%20September%202020.pdf (accessed on 6 September 2020).
8. Yilmazkuday, H. Stay-at-Home Works to Fight Against COVID-19: International Evidence from Google
Mobility Data. Available online: https://ssrn.com/abstract=3571708 (accessed on 6 September 2020).
9. Wang, H.; Yamamoto, N. Using a partial differential equation with Google Mobility data to predict COVID-19
in Arizona. Math. Biosci. Eng. 2020, 17, 4891–4904. [CrossRef]
10. Golding, N.; Shearer, F.M.; Moss, R.; Dawson, P.; Gibbs, L.; Alisic, E.; McVernon, J.; Price, D.J.; McCaw, J.M.
Estimating Temporal Tariation in Transmission of COVID-19 and Adherence to Social Distancing Measures in
Australia. Available online: https://www.doherty.edu.au/uploads/content_doc/Technical_report_15_Maypdf.
pdf (accessed on 6 September 2020).
11. Beck, M.J.; Hensher, D.A. Insights into the Impact of Covid-19 on Household Travel, Working, Activities And
Shopping in Australia—The Early Days under Restrictions. Available online: https://ses.library.usyd.edu.au/
bitstream/handle/2123/22247/ITLS-WP-20-09.pdf?sequence=3&isAllowed=y (accessed on 6 September 2020).
12. Zachreson, C.; Mitchell, L.; Lydeamore, M.; Rebuli, N.; Tomko, M.; Geard, N. Risk mapping for COVID-19
outbreaks using mobility data. arXiv 2020, arXiv:2008.06193.
13. Rockett, R.J.; Arnott, A.; Lam, C.; Sadsad, R.; Timms, V.; Gray, K.A.; Eden, J.-S.; Chang, S.; Gall, M.; Sim, E.;
et al. Revealing COVID-19 transmission by SARS-CoV-2 genome sequencing and agent based modelling.
bioRxiv 2020. [CrossRef]
14. Chang, S.L.; Harding, N.; Zachreson, C.; Cliff, O.M.; Prokopenko, M. Modelling transmission and control of
the COVID-19 pandemic in Australia. arXiv 2020, arXiv:2003.10218.
15. Oztig, L.I.; Askin, O.E. Human mobility and coronavirus disease 2019 (COVID-19): A negative binomial
regression analysis. Public Health 2020, 185, 364–367. [CrossRef] [PubMed]
16. Cartenì, A.; Di Francesco, L.; Martino, M. How mobility habits influenced the spread of the COVID-19
pandemic: Results from the Italian case study. Sci. Total Environ. 2020, 741, 140489. [CrossRef] [PubMed]
17. Lauer, S.A.; Grantz, K.H.; Bi, Q.; Jones, F.K.; Zheng, Q.; Meredith, H.R.; Azman, A.S.; Reich, N.G.; Lessler, J.
The incubation period of Coronavirus Disease 2019 (COVID-19) from Publicly Reported Confirmed Case:
Estimation and Application. Ann. Intern. Med. 2020, 172, 577–582. [CrossRef] [PubMed]
18. Health and Human Services, Victoria State Government. Available online: https://www.dhhs.vic.gov.au/
information-overseas-travellers-coronavirus-disease-covid-19 (accessed on 6 September 2020).
19. Prentice, C.; Chen, J.; Stantic, B. Timed intervention in COVID-19 and panic buying. J. Retail. Consum. Serv.
2020, 57, 102203. [CrossRef]
20. Chinazzi, M.; Davis, J.T.; Ajelli, M.; Gioannini, C.; Litvinova, M.; Merler, S.; Piontti, A.P.; Mu, K.; Rossi, L.;
Viboud, C. The effect of travel restrictions on the spread of the 2019 novel coronavirus (COVID-19) outbreak.
Science 2020, 368, 395–400. [CrossRef] [PubMed]
21. Gupta, S.; Nguyen, T.D.; Rojas, F.L.; Raman, S.; Lee, B.; Bento, A.; Simon, K.I.; Wing, C. Tracking Public and
Private Response to the COVID-19 Epidemic: Evidence from State and Local Government Actions. Natl. Bur.
Econ. Res. Work. Pap. No. 27027 2020. [CrossRef]
22. Tosepu, R.; Gunawan, J.; Effendy, D.S.; Lestari, H.; Bahar, H.; Asfian, P. Correlation between weather and
Covid-19 pandemic in Jakarta, Indonesia. Sci. Total Environ. 2020, 725, 138436. [CrossRef] [PubMed]
23. Stephen, M.K.; Kishore, N.; Prabhu, M.; Goffman, D.; Beilin, Y.; Landau, R.; Bianco, A. Reductions in Commuting
Mobility Predict Geographic Differences in SARS-CoV-2 Prevalence in New York City; Harvard University Library:
Boston, MA, USA, 2020; Available online: http://nrs.harvard.edu/urn-3:HUL.InstRepos:42665370 (accessed
on 6 September 2020).
24. Wang, J.; Tang, K.; Feng, K.; Lv, W. High Temperature and High Humidity Reduce the Transmission of
COVID-19. Available online: https://ssrn.com/abstract=3551767 (accessed on 6 September 2020).
25. Huang, X.; Li, Z.; Jiang, Y.; Li, X.; Porter, D. Twitter, human mobility, and COVID-19. arXiv 2020,
arXiv:2007.01100.
26. Yang, C.; Sha, D.; Liu, Q.; Li, Y.; Lan, H.; Guan, W.W.; Tao, H.; Li, Z.; Zhang, Z.; Wang, Z.; et al. Taking the
pulse of COVID-19: A spatiotemporal perspective. Int. J. Digit. Earth 2020, 1–26. [CrossRef]
27. Hu, T.; Guan, W.; Zhu, X.; Shao, Y.; Liu, L.; Du, J.; Liu, H.; Zhou, H.; Wang, J.; She, B.; et al. Building an Open
Resources Repository for COVID-19 Research. Data Inf. Manag. 2020, 4, 130–147.Int. J. Environ. Res. Public Health 2020, 17, 7930 17 of 17
28. Thomas, H.; Angrist, N.; Cameron-Blake, E.; Hallas, L.; Kira, B.; Majumdar, S.; Petherick, A.; Phillips, T.;
Tatlow, H.; Webster, S. Oxford COVID-19 Government Response Tracker. Available online: https://www.bsg.ox.
ac.uk/research/research-projects/coronavirus-government-response-tracker (accessed on 6 September 2020).
Publisher’s Note: MDPI stays neutral with regard to jurisdictional claims in published maps and institutional
affiliations.
© 2020 by the authors. Licensee MDPI, Basel, Switzerland. This article is an open access
article distributed under the terms and conditions of the Creative Commons Attribution
(CC BY) license (http://creativecommons.org/licenses/by/4.0/).You can also read