Adhering to the 2017 Dutch Physical Activity Guidelines: A Trend over Time 2001-2018
←
→
Page content transcription
If your browser does not render page correctly, please read the page content below
International Journal of
           Environmental Research
           and Public Health

Article
Adhering to the 2017 Dutch Physical Activity
Guidelines: A Trend over Time 2001–2018
Marjolein Duijvestijn *, Saskia W. van den Berg and G. C. Wanda Wendel-Vos
 National Institute for Public Health and the Environment (RIVM), P.O. Box 1, 3720 BA Bilthoven,
 The Netherlands; saskia.van.den.berg@rivm.nl (S.W.v.d.B.); wanda.vos@rivm.nl (G.C.W.W.-V.)
 * Correspondence: marjolein.duijvestijn@rivm.nl; Tel.: +31-30-274-3969

 Received: 10 December 2019; Accepted: 17 January 2020; Published: 21 January 2020

 Abstract: Recently, new physical activity (PA) guidelines were adopted in the Netherlands consisting
 of two components: (1) addressing duration of moderate and vigorous PA, (2) bone and muscle
 strengthening activities. The aim of this study is to retrospectively assess the long-term trend in
 fulfilling the criteria of the new PA guidelines and to gain insight into which activities contribute
 to changes over time. Data were available for 2001–2018 of a nationally representative sample of
 approximately 7000 Dutch citizens aged 12 years and over using the Short Questionnaire to Assess
 Health-enhancing physical activity (SQUASH). Multiple logistic regression analysis was performed
 by age, sex, and level of education. Overall, a positive trend was found from 39.9% adherence in 2001
 to 46.0% in 2018. Adherence levels among adolescents decreased and increased among adults and
 seniors. Intermediate and higher educated groups showed positive trends over time whereas a stable
 trend was observed among lower educated. Activities contributing most to changes over time were
 sports, leisure time walking, and strenuous occupational activities. In the period 2001–2018, though
 an increasing trend was found, less than half of the population was sufficiently active. Special effort
 is necessary to reach adolescents, seniors, and lower educated groups in PA promotion programs.

 Keywords: physical activity; guideline; exercise; health; trend; bone and muscle strengthening
 activities; cross-sectional

1. Introduction
     Non-communicable diseases (NCD) are a major health problem that could be countered by the
elimination of physical inactivity [1]. In 2016, 28% of the world population was considered inactive,
with a prevalence twice as high in Western countries [2]. It was estimated that 6%–10% of the burden
of disease from NCD is attributable to physical inactivity [3]. In addition, the economic burden of
physical inactivity on global health care costs has been conservatively estimated at 54 billion dollars
in 2013 [4]. Insight into levels of physical activity and the trend over time, including preferences
for certain types of activity among particular population groups is of crucial importance for policy
makers [5].
     In 2018, the World Health Organization (WHO) launched the global action plan on physical
activity with the aim to help countries to scale up policy actions to promote physical activity [6].
The action plan provides a framework of effective and feasible policy actions at all levels. The goals
set by the WHO for reducing physical inactivity are a relative reduction of 10% by 2025 and 15% by
the year 2030 [6]. WHO has identified ten key areas for supporting countries in reaching these goals,
one of which is to ‘monitor progress and impact of physical activity’ [6]. Currently in the Netherlands,
three policies focus on sport and physical activity. First, the national sport agreement aims to preserve
and strengthen the sport infrastructure, ensuring a safe environment for everyone to have fun and
enjoy physical activity and sport [7]. Second, the cycling agenda comprehends increasing cycling

Int. J. Environ. Res. Public Health 2020, 17, 681; doi:10.3390/ijerph17030681     www.mdpi.com/journal/ijerph
Int. J. Environ. Res. Public Health 2020, 17, 681                                                                2 of 16

kilometers with 20% (2017–2027) and to motivate an extra 200,000 employees to take up cycling to
work [8]. Third, the Prevention Agreement states, among others, that adherence to the Dutch physical
activity guidelines should increase to a level of 75% of the general population in 2040 as opposed to
47% in the year 2017 [9].
     The current Dutch physical activity guidelines were adopted in 2017 as a result of an advisory
report from the Dutch Health Council [10,11]. Table 1 shows the different elements of these guidelines.

                                  Table 1. Dutch physical activity guidelines 2017 [10,11].

 Adults and Older People ≥18 Years of Age                       Children and Adolescents 4–18 Years of Age
 •      Physical activity is good for you—the more,             •    Physical activity is good for you—the more,
        the better                                                   the better
 •      Engage in physical activity of moderate intensity       •    Engage in physical activity of moderate intensity
        for at least 150 min every week, spread over                 for at least one hour every day. The longer you
        several different days. For example, walking and             are physically active, and the more frequent
        cycling. The longer you are physically active,               and/or more vigorous the activity, the more your
        and the more frequent and/or more vigorous the               health will benefit.
        activity, the more your health will benefit.            •    Do activities that strengthen your muscles and
 •      Do activities that strengthen your muscles and               bones at least twice a week. Older people
        bones at least twice a week. Older people                    should combine these with balance exercises.
        should combine these with balance exercises.            •    And: avoid spending long periods sitting down.
 •      And: avoid spending long periods sitting down.

      This article will describe the second and third element: the time spent on physical activity of at
least moderate intensity and the frequency of activities that strengthen muscles and bones. Both these
components must be met to adhere to the physical activity guidelines. Compared to the former
Dutch physical activity guidelines, the second component addressing bone and muscle strengthening
activities is newly added [12]. To evaluate goals on adherence to the physical activity guidelines,
monitoring and analysing trends over time are necessary [13–15].
      Multiple studies have reported physical (in) activity levels at country [16–21], European [15,22],
and/or global level [2,14,23]. A number of studies have also considered the development over
time [2,18–20,24]. All studies included a national representative sample and reported separately on
sex [2], age [18–20,24], and several on level of education as well [19,20,24]. However, these studies often
only assessed a few time points over a period of less than 15 years [18,19,24]. A study by Guthold et al.
(2018) was the first to assess a global long-term trend (2001–2016) of physical inactivity, distinguishing
sex and income level [2]. They had to make many assumptions due to the use of several different
questionnaires and only 55% of countries having data available for more than one time point [2]. In our
study, annual data were available from 2001 to 2018. During this period, the same questionnaire
was used. The large sample size of the dataset enables a selection for subgroups. Furthermore,
the questionnaire items allow us to gain insight in the relative contribution of specific activities. To our
knowledge, only few studies had this opportunity [25]. As far as we know, we are the first to combine
yearly time points to assess long-term trends in adhering to a physical activity guideline and addressing
activities that underlie changes over time.
      In other countries, the bone and muscle strengthening component of a guideline rarely is
measured in national surveillance systems and therefore most of the time not considered when
calculating national prevalence estimates [26]. One study in Scotland has made an effort to provide
detailed national representative information on the proportions meeting muscle strengthening
guidelines [25]. They assessed the prevalence of muscle strengthening guidelines and participation
in muscle strengthening guideline-specific exercises [25]. However, they did not integrate this
measure with moderate to vigorous physical activity (MVPA). Another national study in Australia
and the United States did examine incorporating muscle strengthening activities into their physical
activity guideline. This resulted in lower adherence levels compared to the guideline of only
Int. J. Environ. Res. Public Health 2020, 17, 681                                                       3 of 16

MVPA [16,21]. To date, only limited knowledge is available concerning the attribution of bone and
muscle strengthening exercises, to a guideline consisting of a combination of MVPA and bone and
muscle strengthening exercises.
     The overall aim of the present study is to gain more insight into adherence to the Dutch physical
activity guidelines and its separate components addressing moderate and highly intense physical
activity, and bone and muscle strengthening activities. Doing so by assessing the trend over time
in the prevalence of adhering to the Dutch physical activity guidelines and underlying components.
Additionally, to identify underlying physical activities that may be responsible for changes over time
observed in adherence to the guidelines.

2. Materials and Methods

2.1. Study Design and Participants
     From the year 2001, physical activity levels of the Dutch population were assessed on a yearly
basis as part of a cross-sectional survey called the Dutch Health Survey/Lifestyle Monitor by Statistics
Netherlands in collaboration with the National Institute for Public Health and the Environment [27–30].
In this survey, a two-stage stratified sampling design (1. municipalities and 2. individuals) was used
to select participants from the Dutch Personal Records Database [31]. The sample was spread out
over all months of the year [29]. Participants were requested to fill in the survey on paper or online,
non-responders were approached face-to-face or by phone for an interview [27–29]. After weighting
based on demographic characteristics such as age, sex, and marital status, the data are nationally
representative of the Dutch population [32]. For comparability reasons, the present study used data
from citizens aged 12 years and older, a sample of approximately 7000 Dutch citizens each year.
Approval of the medical ethical committee was not necessary.

2.2. Demographic Characteristics
     Participant characteristics (age, sex, level of education) were derived from the survey. Age groups
were defined as adolescents (12 to 17 year old’s), adults (18 to 64 year old’s), and seniors
(65 years and over). Highest attained level of education was classified as low (no, elementary,
or low vocational/secondary schooling), intermediate (intermediate vocational or intermediate/higher
secondary schooling), or high (higher vocational schooling or university) from the age of 25.
Although information on the attained education was available bellow the age of 25, it was considered
that most people would not have attained their highest level of education yet.

2.3. Physical Activity
      Physical activity levels were assessed with the validated Short Questionnaire to Assess
Health-enhancing physical activity (SQUASH) [33]. The SQUASH has been validated for adults
(r = 0.43) [33], adolescents (r = 0.50) [34], older adults (r = 0.48) [35], and patient groups (r = 0.67) [36]
by using double labelled water [34], accelerometer data [33,36], or another physical activity
questionnaire [35]. The SQUASH domains and activities are presented in Table 2 [33]. Based on these
items, using a standardized algorithm, adherence to the Dutch physical activity guidelines (Table 1)
was calculated. In the algorithm, activities and sports were categorized as low (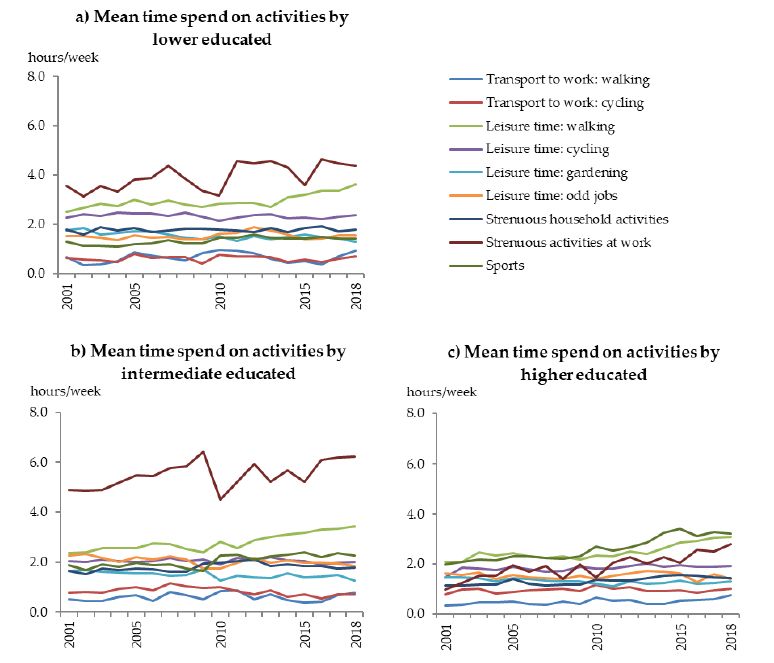
Int. J. Environ. Res. Public Health 2020, 17, 681                                                                           4 of 16

by an expert group. Appendix A gives an overview of the MET scores corresponding to the activities
and the categorization for bone and muscle strengthening activities.

      Table 2. Domains and activities of the Short Questionnaire to Assess Health-enhancing physical activity
      (SQUASH) [33].

              Domain                    Activities †            Domain                          Activities †
                                 Walking to work/school  †                          Working activities, light/moderate *
      Transport to work/school                               At work/school
                                 Cycling to work/school †                            Working activities, strenuous *
                                 Walking in leisure time †                         Household activities, light/moderate †
                                 Cycling in leisure time †    Household
            Leisure time                                                             Household activities, strenuous †
                                       Gardening †
                                       Odd jobs †                Sports                      Sports (max. 4) †
      † assessed in number of days per week and hour/minutes on those days. * assessed in hours per week and for
      intensity: light/moderate activities at work were defined as sitting/standing work with occasional walking such as
      office work or walking during work with light loads, strenuous activities were defined as walking during work or
      work for which heavy loads must be lifted regularly.

2.4. Data Analysis
     General population characteristics for each year were described (age, sex, level of education).
Weighted prevalence were calculated for (i) meeting the full physical activity guidelines, (ii) meeting
the MVPA component, (iii) meeting the bone and muscle strengthening component.
     To analyze the trend over time, a logistic regression was performed with adhering to the overall
guidelines or component as the dependent variable, resulting in three separate models. Time, the year
of the measurement, was added to the model as a continuous independent variable. To investigate
interaction by sex, age (in categories), and level of education (in categories) interaction terms were
added one by one to the model. Data from 124,823 participants of 12 years and older were available
for analysis of which 101,260 participants were from the age of 25. When the terms were statistically
significant, stratified analysis was performed for subgroups. Adjusted odds ratios (ORs) and their
95% confidence intervals (CIs) were presented with three decimals, as ORs were interpreted per year,
thereby expecting small ratios.
     To get insight in the underlying activities that could explain observed trends, weighted mean
time spent on activities (hours/week) was further investigated. The mean time spent on activities was
assumed to represent duration and frequency and was presented for relevant subgroups (age, sex,
level of education). Difference between years in time spent on activities of at least 0.5 h per week were
considered to be relevant. Statistical analysis was conducted using IBM SPSS 22.0 statistical software
(SPSS Inc. an IBM Company, Chicago, IL, USA). For all statistical tests, a p-value of
Int. J. Environ. Res. Public Health 2020, 17, 681 5 of 16
Table 3. Population size (n) for each year included in the analysis stratified by age, sex, and by level of education (#%) and the prevalence of adherence to the Dutch
physical activity guidelines and components: (1) moderate and vigorous intense physical activity, (2) bone and muscle strengthening activities, for all subgroups (#,#%).
Total (n) Age Group (%) * Sex (%) * Level of Education (%) †,δ
Adolescents Adults Seniors
Year ≥12 Years ≥25 Years Male Female Lower Intermediate Higher
(12–17) (18–64) (65+)
2001 5971 4915 9 75 16 48 52 43 34 23
2002 5834 4775 9 74 17 47 53 42 34 24
2003 6566 5409 10 74 16 48 52 41 34 25
2004 7584 6157 10 74 16 48 52 31 39 30
2005 7128 5930 9 73 18 48 52 42 34 24
2006 6733 5601 9 73 18 48 52 41 34 25
2007 5951 4953 9 72 19 47 53 41 33 26
2008 6212 5170 9 72 20 48 52 39 34 27
2009 5962 3248 8 71 21 48 52 37 34 29
2010 7218 6085 7 72 21 47 53 38 30 32
2011 6262 5238 7 71 22 48 52 39 29 32
2012 6349 6085 7 71 22 47 53 34 33 34
2013 6444 5241 7 70 23 46 54 26 41 33
2014 7859 6331 9 69 23 51 49 30 40 30
2015 7783 6272 9 69 22 52 48 30 40 30
2016 7646 6137 9 68 23 48 52 30 38 31
2017 8819 6598 9 66 25 49 51 28 40 32
2018 8502 7115 8 70 22 49 51 26 39 35
Prevalence rates for adherence to the physical activity guidelines in 2018 (#,#%)
Overall 46.0 46.2 33.9 50.1 37.0 48.1 43.9 34.3 45.5 56.5
Component 1 52.4 52.8 37.1 56.9 43.1 55.7 49.1 42.5 52.8 61.3
Component 2 78.2 77.6 84.2 79.1 72.9 78.2 78.3 67.4 77.3 86.3
δ
* Based on population size of ≥12 years old † Based on population size of ≥25 years old and categorized by highest attained level of education low (no, elementary, or low
vocational/secondary schooling), intermediate (intermediate vocational or intermediate/higher secondary schooling), or high (higher vocational schooling or university).Int. J. Environ. Res. Public Health 2020, 17, 681 6 of 16
In 2018, 46.0% of the total population aged 12 years and over adhered to the physical activity
guidelines, 48.1% males and 43.9% females (Table 3). Adults adhered the most (50.1%), followed by
seniors (37.0%) and adolescents (33.9%). For level of education, the adherence levels increased with a
higher level of education (low (34.3%), intermediate (45.5%), and high (56.5%)).
In general, adherence levels for component 2, bone and muscle strengthening activities (78.2% in
2018), are higher compared to component 1, time spent on moderate to vigorous activities (52.4% in
2018, Table 3). In that sense, component 1 determines the level of adherence to the physical activity
guidelines for the larger part. However, still a proportion of the individuals does adhere to component
1 and not to component 2 as adherence to the overall guidelines (46.0% in 2018) is lower compared to
component 1 (52.4% in 2018).
Between 2001 and 2018, adherence to the Dutch physical activity guidelines increased from 39.9%
to 46.0%, showing a stable to slightly increasing pattern (Figure 1a). This trend was similar for men
and women (p > 0.01). For both adherence to the overall physical activity guidelines and the separate
components, an interaction with age group was observed (p < 0.01). All prevalence data (2001–2018)
Int.found
can be J. Environ.
inRes. Public Health
Appendix B.2020, 17, 681 7 of 18
Figure 1. Adherence levels to the Dutch physical activity guidelines (%) consisting of component
Figure 1. Adherence levels to the Dutch physical activity guidelines (%) consisting of component 1;
1; 150150
moderate-and
moderate-andvigorous
vigorous intense physicalactivity
intense physical activity
perper week
week for for adults,
adults, one one
hourhour per for
per day day for
adolescents and component
adolescents and component2; two times
2; two per week
times bonebone
per week andand
muscle strengthening
muscle strengthening activities forfor
activities adults,
threeadults,
times three
for adolescents, stratified
times for adolescents, by ageby
stratified groups (12–17,
age groups 18–64,
(12–17, 65+)
18–64, and
65+) andlevel
level of education. (a)
of education.
Adherence to guidelines
(a) Adherence for age groups,
to guidelines for age (b) adherence
groups, to component
(b) adherence 1 for age1 groups,
to component for age (c) adherence
groups, (c) to
adherence
component to age
2 for component
groups,2 (d)
for age groups, to
adherence (d)the
adherence to the
guidelines byguidelines by level of education.
level of education.
Among adolescents, a small negative trend over time was found with an odds for adherence to
the overall guidelines of 0.979 [95% confidence interval (CI) 0.972:0.986] per year between 2001 and
2018 (34.3% and 33.9%). A similar trend was seen for component 1 (p < 0.01), whereas no trend wasInt. J. Environ. Res. Public Health 2020, 17, 681 7 of 16
found for component 2 (p = 0.27, Figure 1). The decreasing trend may be explained by changes in time
spent on specific activities (Figure 2a). Time spent on sports showed the largest difference between
2001 (i.e., 5.7 h/week) and 2018 (i.e., 4.6 h/week). Also, time spent on cycling to school/work clearly
decreased during this period (4.2 vs. 3.6 h/week). On the other hand, an increase was seen
Int. J. Environ. Res. Public Health 2020, 17, 681
in time
8 of 18
spent on walking to work/school (0.7 vs. 1.3 h/week) and during leisure time (1.0 vs. 2.1 h/week).
Figure 2. Mean time spend on activities at work or school, in household, during leisure time and sports
per Figure
week for2. Mean time (2001–2018)
each year spend on activities at work
stratified for ageorgroups,
school, in
(a)household,
adolescentsduring
(12–17leisure
years time
old),and
(b) adults
sports
(18–64 per old),
years week (c)
forseniors
each year (2001–2018)
(65+ stratified for age groups, (a) adolescents (12–17 years old),
years old).
(b) adults (18–64 years old), (c) seniors (65+ years old).
For adults, a small positive trend over time was observed (OR 1.017 per year [95% CI 1.014:1.019]) in
adherence to the overall guidelines between 2001 and 2018 (44.2% and 50.1%, Figure 1a). Similar trends
were seen for component 1 (p < 0.01, Figure 1b) and component 2 (p < 0.01, Figure 1c). Subsequently,
adults reported more time spent on several activities between 2001 and 2018 (Figure 2b). More time
was spent on strenuous activity at work (4.5 vs. 6.2 h/week), sports (1.9 vs. 2.6 h/week), and leisure
time walking (2.2 vs. 3.1 h/week, Figure 2b). Gardening is the only activity for which less time was
spent in 2018 compared to 2001 (1.4 vs. 0.9 h/week).
Among seniors, a positive trend in adherence to the overall guidelines (OR 1.047 per year
[95% CI 1.041:1.052]) was found as well, which was more pronounced than among adults (Figure 1a).
Adherence to the physical activity guidelines among seniors increased from 22.0% in 2001 to 37.0%
in 2018. The two underlying components showed the same increasing pattern during this period
(p < 0.01, Figure 1b,c). The increasing trend may be explained by increasing amounts of time spent on
walking as a leisure activity (2.7 vs. 4.0 h/week), sports (1.0 vs. 2.0 h/week), and strenuous household
activities (1.0 vs. 1.6 h/week, Figure 2c) between 2001 and 2018.
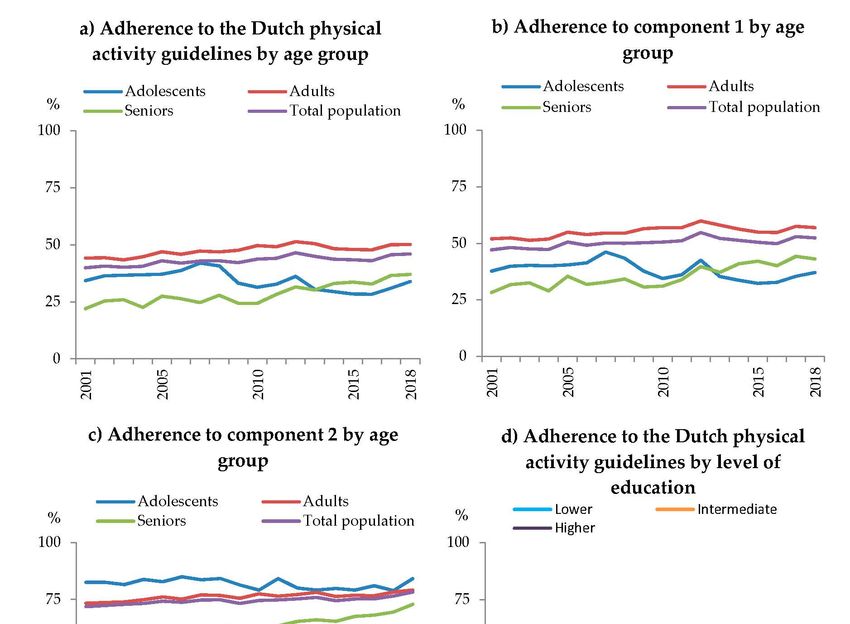
Besides an interaction with age, also an interaction with level of education was observed (p < 0.01).
A small positive significant trend over time in adherence to the physical activity guidelines was foundInt. J. Environ. Res. Public Health 2020, 17, 681 8 of 16
for intermediate (OR 1.006 per year [95% CI 1.003:1.010]) and higher educated (OR 1.028 per year
[95% CI 1.024:1.033]). Whereas, a stable trend over time was observed for lower educated (p = 0.97, 2001:
33.1%, 2018: 34.3%). Adherence to the overall guidelines increased for intermediate educated from
43.3% to 45.5% and for higher educated from 44.0% to 56.5% (Figure 1d). Similar trends were seen for
component 1 and 2 (p < 0.01). Over the years (2001 vs. 2018), intermediate educated showed an increase
in time spent on strenuous activities at work (4.9 vs. 6.2 h/week) and leisure time walking (2.4 vs.
3.4 h/week, Figure 3b). While, they spent less time on gardening (1.9 vs. 1.3 h/week). Higher educated
showed an increase in time spent on sports (2.0 vs. 3.2 h/week), strenuous activities at work (1.0 vs.
2.8 Int.
h/week),
J. Environ.and leisure
Res. Public time
Health walking
2020, 17, 681 (2.1 vs. 3.1 h/week, Figure 3c). 9 of 18
Figure 3. Mean time spend on activities at work or school, in household, during leisure time
andFigure
sports3. Mean time spend
per week on activities
for each at work orfor
year stratified school,
levelinof
household, during
education, (a) leisure
lower time and
educated (no,
sports per week for each year stratified for level of education, (a) lower educated (no, elementary, or
elementary, or low vocational/secondary schooling), (b) intermediate educated (intermediate vocational
low vocational/secondary schooling), (b) intermediate educated (intermediate vocational or
or intermediate/higher secondary schooling), (c) higher educated (higher vocational schooling
intermediate/higher secondary schooling), (c) higher educated (higher vocational schooling or
or university).
university).
4. Discussion
4. Discussion
In the present study, we found that from 2001 to 2018, adherence to the Dutch physical activity
In the present study, we found that from 2001 to 2018, adherence to the Dutch physical activity
guidelines
guidelinesincreased
increasedfor
foradults,
adults, seniors, andthe
seniors, and theintermediate
intermediate andand higher
higher educated.
educated. An inverse
An inverse trend trend
waswasfound
found for
foradolescents anda astable
adolescents and stable trend
trend was was
foundfound
for thefor theeducated.
lower lower educated. Similar
Similar trends were trends
were seen
seen for for the two
the two underlying
underlying components.
components. Generally, Generally, adults
adults adhered theadhered thephysical
most to the most toactivity
the physical
activity guidelines
guidelines and seniors
and seniors theAlthough,
the least. least. Although, seniorsthe
seniors showed showed
largestthe largest improvement
improvement over time. Theover time.
underlying physical activity pattern for the trend over time of the components differed for
The underlying physical activity pattern for the trend over time of the components differed for each age each age
andand level
level of education
of education group.In
group. Ingeneral,
general, the
the activities
activitiesthat
thatcontributed
contributed most to changes
most to changesin adhering
in adhering to
to the Dutch physical activity guidelines were strenuous activities at work,
the Dutch physical activity guidelines were strenuous activities at work, sports, and walkingsports, and walkingduring
during leisure time.
leisure time.
In 2018, less than half of the Dutch population over 12 years old adheres to the physical activity
guidelines (46.0%). Several other countries have reported adherence levels on their physical activity
guidelines; 65.2% of American adults [19], 45% of Australian adults [38], and 66% of English males
and 58% of English female aged 16 year and older [39]. However, for methodological reasons,
comparisons of adherence rates between countries must be treated with caution. First of all, these
countries use different definitions of being sufficient physical active compared to the NetherlandsInt. J. Environ. Res. Public Health 2020, 17, 681 9 of 16
In 2018, less than half of the Dutch population over 12 years old adheres to the physical activity
guidelines (46.0%). Several other countries have reported adherence levels on their physical activity
guidelines; 65.2% of American adults [19], 45% of Australian adults [38], and 66% of English males and
58% of English female aged 16 year and older [39]. However, for methodological reasons, comparisons
of adherence rates between countries must be treated with caution. First of all, these countries use
different definitions of being sufficient physical active compared to the Netherlands and each other.
Moreover, various validated and unvalidated questionnaires exist and are used by countries to assess
physical activity levels, prohibiting clear comparison between countries [40]. Therefore, differences in
methodology should be taken into account when comparing results between studies and countries.
Nonetheless, it is of interest to examine relative differences between groups (e.g., sex, age), the trend
over time, and share these outcomes between countries.
The Dutch physical activity guidelines consist of a moderate to vigorous physical activity (MVPA)
and a bone and muscle strengthening component. A few studies assessed muscle strengthening activity
in a physical activity guideline [16,21]. A recent national American study by Bennie et al. (2019) found
that by adding muscle strengthening activities to an MVPA guideline, resulted in lower adherence
levels (30.5% vs. 20.3%) [21]. The results are in line with our findings, though in our study, a smaller
decline was found by the addition of a bone and muscle strengthening component, from 52.4% to
46.0%. Bennie et al. (2019) used a different question to assess muscle strengthening activities. In this
question, they explicitly excluded walking, running, and cycling. While in our study, these activities
are seen as muscle strengthening based on a report by the Committee for Guidelines on Physical
Activity [11]. Consequently, methodological differences can explain the different findings.
Strengths include the use of a large representative study population, giving us the possibility to
investigate several subgroups. Data were available for each year from 2001 to 2018, with no missing
data. Furthermore, the adherence to the physical activity guidelines was assessed retrospectively with
the calculation method being the same for all years. Moreover, our findings give insight into which
activities the population performs to adhere to the Dutch physical activity guidelines.
Despite the questionnaire being the same over time, data collection was subjected to methodological
changes, which counts as a limitation of our study. Until 2013, data were collected by interviews and
on paper. From 2014 and on, it was also possible to fill in the survey online. A report by Statistics
Netherlands showed differences for a selection of variables due to this change [41]. The effect of
this change has not been tested specifically for physical activity variables. In our results, no sudden
changes were observed over all adherence levels to the physical activity guideline in 2014. Next to
that, in essence, the questionnaire has been the same for all years, only a few years had small technical
differences. For a few questions, technical differences involved the possibility to skip a question when
not applicable to the participants situation. Despite small changes in the sample and collection method,
it can be concluded that changes in methodology had a negligible effect on the results of our study.
Another limitation of our study includes the reliance on self-reported physical activity (e.g.,
overestimation, social desirable answers, recall bias). Specific limitation of the SQUASH questionnaire is
an overestimation of physical activity due to the large number of items compared to other questionnaires.
However, since 2001, the physical activity questionnaire has been the same in our study. Therefore,
the bias related to overestimation may be considered a constant factor over time and less of a factor
to consider when studying trends in physical activity levels. Therefore, it seems less likely that
overestimation of physical activity levels has affected our trend conclusions. To overcome bias related
to self-report, objective measurements could be used [42]. Using accelerometers in national surveillance
systems has potential, however, more research on data quality and practical implications is necessary.
For example, some activities may be poorly represented in accelerometer data. When assessing
adherence to physical activity guidelines there might be a problem with including bone and muscle
strengthening activities. Also, in countries where cycling is an important activity, such as the
Netherlands, the total amount of physical activity may contain a systematic error. We also have to
consider the fact that current physical activity guidelines and recommendations are largely basedInt. J. Environ. Res. Public Health 2020, 17, 681 10 of 16
on self-reported studies using questionnaires when examining associations between activity and
health-related outcomes [43]. Recommendations may change based on future large-scale longitudinal
studies using objective measurements related to health-related outcomes [43]. Consequently, using
objective measures in national surveillance systems aiming to assess physical activity levels related to
good/better health may entail using a different indicator for health enhancing physical activity.
In our study, strenuous activities at work were found to attribute to an increasing adherence to the
physical activity guidelines over time. However, it should be noted that previous research has indicated
that occupational physical activity elevates cardiovascular risk [44]. In our article, strenuous activities at
work were seen as activities to adhere to the physical activity guidelines, as the guidelines do not make
a distinction where activities have taken place [10,11]. However, bias caused by including occupational
activities in the analysis might be less pronounced as our population is national representative with
only a portion in strenuous labor force. Nonetheless, occupational physical activities should not be
seen as activities to be promoted for health-enhancing purposes [44].
In our study, adherence levels to the Dutch physical activity guidelines were found to differ
between population groups. In general, physical activity levels tend to differ between men and
women [2,18,45]. In the Netherlands, adherence levels are comparable between men and women.
Another interesting finding of our study is that, seniors became more active. At the same time, physical
activity levels are still relatively low compared to other age groups. Since, staying physically active
is of tremendous importance to live independently as long as possible [46]. It is important to find
ways to even further increase physical activity levels among seniors in the future. Opposite to seniors,
adolescents became less active in the period 2001–2018. This is of concern because literature suggested
that physical activity levels in childhood can track to adulthood [47,48]. This makes it of even more
importance to facilitate physical activity among adolescent groups.
Next to developments within and between age groups, our results show an increasing gap of
physical activity levels between lower educated at the one side and higher educated at the other.
The widening of the gap between higher and lower educated is well known for health status [49–52].
Also, we are not the first to confirm this for physical activity [50,51]. This emphasizes the need for
physical activity promotion tailored to lower educational levels in order tackle these social economic
differences in physical activity level.
It is likely that more population groups stay behind with respect to adherence to physical activity
guidelines such as people with disabilities, overweight, or living in urban or rural areas. Future studies
can contribute by providing more insight in such groups. It would also be interesting to answer
questions on additional time needed to change non-adherence to adherence. In that respect, it may
be helpful to take a closer look at specific activities that largely contribute to adherence such as
specific sports or walking for particular purposes. It is advised to perform analysis separately for
the two components, as some individuals already adhere to one component and not yet to the other.
The outcome of such future studies on other relevant subgroups and specific activities could help
tailoring physical activity promotion to certain target populations.
Overall, a small positive trend is observed from 2001 to 2018 for the Dutch population of 12 years
and older. Still, adolescents, seniors, and lower educated groups are in need of focused attention to
improve their adherence rates. Physical activity levels could be improved by policy changes aiming
at tailoring physical activity promotion programs to subgroups [6]. To take a step in shaping these
physical activity promotion programs, future studies could investigate which specific activities should
be stimulated by policy actions to increase the physical activity levels.
From 2001 to 2018, adherence rates by the Dutch population increased from 39.9% to 46.0%.
The Dutch government has the ambitious goal to have 75% of the population adhere to the physical
activity guidelines by 2040 [9]. The goal set by the WHO might by more realistic with a relative increase
of 15% in 2030 compared to 2018 [6]. Meaning, for the Dutch situation to reach 53% adherence in
2030. Still, large measures and policy actions are necessary to accomplish either goals. CollaborationsInt. J. Environ. Res. Public Health 2020, 17, 681 11 of 16
between sectors (e.g., health care, education, communities, and sport clubs) is of importance to increase
population adherence rates and to target the groups with the lowest adherence levels [6].
5. Conclusions
Adherence levels for the Dutch physical activity guidelines have slightly increased between 2001
and 2018. Activities that contributed to changes in adhering to the Dutch physical activity guidelines
were strenuous activities at work, sports, and walking during leisure time. Still, less than half of
the population is sufficiently active. Especially adolescents, seniors, and groups with a lower level
of education are in need of attention for tailored physical activity programs. In collaboration with
multiple stakeholders actions can be taken to accomplish the adherence goals set out by the Dutch
government and the WHO.
Author Contributions: S.W.v.d.B. and G.C.W.W.-V. conceived of and designed the study. M.D. did all the data
cleaning and analysis, and wrote the first draft of the main paper. All the authors discussed the results and were
involved in the critical revisions of the manuscript. All authors have read and agreed to the published version of
the manuscript.
Funding: This study was funded by the Dutch ministry of health, welfare and sports. The funder was not involved
in any part of the study.
Acknowledgments: We are grateful to Statistics Netherlands for making the data from the Health Survey (Statistics
Netherlands) 2001–2013 and the Health Survey/Lifestyle Monitor (Statistics Netherlands in collaboration with the
National Institute for Public Health and the Environment) 2014–2018 available.
Conflicts of Interest: The authors declare that they have no actual or potential competing financial interests.
Appendix A
Table A1. Metabolic equivalent (MET) scores of the activities and categorization in muscle and/or bone
strengthening activities [10,11,37].
Muscle Bone
Domain Activity MET-Score
Strengthening * Strengthening *
Transport to work Walking to work or school 3.3 YES YES
or school Cycling to work or school 5.8 YES NO
Walking during leisure time 2.7 YES YES
Cycling during leisure time 5.8 YES NO
Leisure time
Gardening 3.8 NO NO
Odd jobs 3.0 NO NO
Working activities, light/moderate 1.5 NO NO
At work
Working activities, vigorous 4.5 NO NO
Household activities, light 2.5 NO NO
Household
Household activities, vigorous 4.3 NO NO
Depends
Depends on kind Depends on kind
Sports Sports on kind of
of sport of sport
sport
* Based on the available data and the definition of the physical activity guidelines by the Dutch Health Council
activities and sports were categorized as either muscle and/or bone strengthening. Bone strengthening activities
were defined as activities involving strength training and bearing body weight, for example jumping, walking stairs,
walking, running, and dancing. Muscle strengthening activities included activities to increase strength, capacity,
endurance, and muscle size, for example, exercise with the use of bodyweight and aerobic activities. Aerobic
activities should involve large muscle groups, for example, walking, swimming, cycling, and dancing.Int. J. Environ. Res. Public Health 2020, 17, 681 12 of 16
Appendix B
Table A2. Adherence levels to the Dutch physical activity guidelines in percentages, stratified by age
groups, sex, and level of education.
Total (%) Age Group (%) * Sex (%) * Level of Education (%) †,δ
≥12 ≥25 Adolescents Adults Seniors
Year Male Female Lower Intermediate Higher
Years Years (12–17) (18–64) (65+)
2001 39.9 39.3 34.3 44.2 22.0 39.9 39.9 33.1 43.3 44.0
2002 40.6 39.6 36.4 44.3 25.3 40.1 41.2 32.0 43.0 47.1
2003 40.1 39.0 36.6 43.3 25.9 41.4 38.9 31.6 41.2 47.6
2004 40.6 39.6 36.8 44.7 22.6 40.5 40.6 29.1 42.6 45.9
2005 43.0 41.7 37.1 46.9 27.5 41.9 43.9 33.6 45.8 49.6
2006 41.9 40.2 38.7 45.8 26.4 42.3 41.6 32.2 43.7 47.9
2007 42.9 41.1 42.0 47.2 24.7 41.6 44.0 33.9 44.5 47.3
2008 43.0 41.6 40.7 46.8 27.9 42.2 43.7 33.5 43.9 49.6
2009 42.1 41.6 33.2 47.5 24.3 42.8 41.5 34.2 43.0 48.6
2010 43.7 42.6 31.4 49.6 24.4 44.1 43.4 31.8 47.7 52.0
2011 44.1 43.4 32.7 49.1 28.3 44.0 44.1 34.7 47.4 51.1
2012 46.4 45.8 36.1 51.3 31.5 47.8 45.1 36.7 47.2 54.3
2013 44.9 44.7 30.5 50.5 30.2 45.9 44.0 33.7 45.4 53.9
2014 43.6 43.6 29.4 48.2 33.0 43.8 43.5 32.2 44.9 53.1
2015 43.4 43.5 28.4 47.9 33.6 43.9 42.9 32.7 43.7 54.2
2016 43.0 43.3 28.3 47.8 32.8 43.4 42.6 32.3 42.6 55.0
2017 45.6 45.8 31.0 50.0 36.6 47.1 44.2 35.3 45.7 54.8
2018 46.0 46.2 33.9 50.1 37.0 48.1 43.9 34.3 45.5 56.5
* Based on population size of ≥12 years old. † Based on population size of ≥25 years old and categorized by highest
δ
attained level of education. low (no, elementary, or low vocational/secondary schooling), intermediate (intermediate
vocational or intermediate/higher secondary schooling), or high (higher vocational schooling or university).
Table A3. Adherence levels to the first component of the Dutch physical activity guidelines consisting
of 150 moderate and vigorous intense physical activity per week for adults, one hour per day for
adolescents, in percentages, stratified by age groups, sex, and level of education.
Total (%) Age Group (%) * Sex (%) * Level of Education (%) †,δ
≥12 ≥25 Adolescents Adults Seniors
Year Male Female Lower Intermediate Higher
Years Years (12–17) (18–64) (65+)
2001 47.1 46.9 37.7 52.0 28.2 48.0 46.3 41.7 52.2 48.3
2002 48.1 47.5 39.9 52.4 31.7 48.8 47.4 41.2 51.9 51.6
2003 47.5 46.9 40.3 51.3 32.5 49.4 45.7 40.6 50.1 52.6
2004 47.3 46.8 40.0 51.9 29.0 48.4 46.3 37.2 50.7 51.2
2005 50.6 49.7 40.4 54.9 35.4 51.0 50.1 41.7 55.7 54.7
2006 49.1 48.0 41.4 53.9 31.9 50.5 47.8 40.2 52.9 53.4
2007 50.1 48.6 46.1 54.6 32.8 50.0 50.2 42.0 52.5 53.4
2008 50.0 48.9 43.4 54.5 34.2 50.7 49.3 41.4 52.5 54.6
2009 50.2 49.9 37.7 56.5 30.7 52.7 48.0 40.9 54.5 55.3
2010 50.6 49.5 34.4 56.9 31.1 52.1 49.0 39.8 55.4 56.8
2011 51.1 50.8 36.1 56.9 33.9 52.7 49.6 43.0 55.3 56.8
2012 54.8 54.2 42.5 59.9 39.7 57.3 52.2 46.3 56.2 60.6
2013 52.2 51.9 35.3 58.0 37.1 54.7 49.7 42.8 52.7 59.1
2014 51.3 51.6 33.7 56.3 40.9 52.9 49.8 41.1 54.0 58.8
2015 50.5 50.7 32.3 55.0 42.1 51.8 49.2 41.0 52.1 58.7
2016 49.9 50.3 32.8 54.8 40.1 51.4 48.3 41.0 50.0 59.6
2017 52.9 53.3 35.5 57.5 44.3 56.1 49.8 44.0 54.7 59.5
2018 52.4 52.8 37.1 56.9 43.1 55.7 49.1 42.5 52.8 61.3
* Based on population size of ≥12 years old. † Based on population size of ≥25 years old and categorized by highest
δ
attained level of education. low (no, elementary, or low vocational/secondary schooling), intermediate (intermediate
vocational or intermediate/higher secondary schooling), or high (higher vocational schooling or university).Int. J. Environ. Res. Public Health 2020, 17, 681 13 of 16
Table A4. Adherence levels to the second component of the Dutch physical activity guidelines consisting
of two times per week bone and muscle strengthening activities for adults, three times for adolescents,
stratified by age groups, sex, and level of education.
Total (%) Age Group (%)* Sex (%) * Level of Education (%) †,δ
≥12 ≥25 Adolescents Adults Seniors
Year Male Female Lower Intermediate Higher
Years Years (12–17) (18–64) (65+)
2001 71.8 70.2 82.5 73.3 58.8 70.3 73.3 62.2 71.9 81.5
2002 72.3 70.7 82.6 73.6 61.1 70.3 74.2 62.8 72.0 81.5
2003 72.8 71.3 81.5 73.9 62.3 72.5 73.2 63.3 72.8 81.9
2004 73.2 71.7 83.8 74.9 59.4 71.8 74.6 60.7 73.0 80.5
2005 74.2 72.8 82.8 76.1 61.4 72.3 76.1 65.2 74.5 83.0
2006 73.8 71.8 85.0 75.1 62.1 72.9 74.6 62.5 74.1 83.2
2007 74.7 73.2 83.7 77.0 61.0 73.2 76.2 65.2 76.3 81.2
2008 74.8 73.5 84.2 76.8 62.8 73.2 76.3 64.5 74.8 83.8
2009 73.2 71.1 81.4 75.5 61.0 71.5 74.8 63.4 69.9 81.3
2010 74.6 73.6 79.1 77.4 60.1 72.4 76.7 63.5 76.3 84.5
2011 74.8 73.1 84.2 76.5 63.4 71.9 77.6 64.3 75.0 83.2
2012 75.2 74.1 80.0 77.2 65.3 74.0 76.5 64.2 75.3 83.6
2013 75.9 75.0 79.1 78.1 66.0 74.0 77.8 63.3 76.4 84.0
2014 74.5 73.7 79.8 76.3 65.4 72.3 76.6 62.8 74.4 83.4
2015 75.2 74.4 79.1 76.9 67.6 73.5 76.8 63.6 74.9 84.5
2016 75.2 74.7 81.0 76.6 68.1 73.6 76.9 64.6 73.7 85.8
2017 76.5 76.2 78.9 78.3 69.5 74.5 78.5 67.9 74.7 85.0
2018 78.2 77.6 84.2 79.1 72.9 78.2 78.3 67.4 77.3 86.3
* Based on population size of ≥12 years old. † Based on population size of ≥25 years old and categorized by highest
δ
attained level of education. low (no, elementary, or low vocational/secondary schooling), intermediate (intermediate
vocational or intermediate/higher secondary schooling), or high (higher vocational schooling or university).
References
1. Forouzanfar, M.H.; Afshin, A.; Alexander, L.T.; Anderson, H.R.; Bhutta, Z.A.; Biryukov, S.; Brauer, M.;
Burnett, R.; Cercy, K.; Charlson, F.J.; et al. Global, regional, and national comparative risk assessment of
79 behavioural, environmental and occupational, and metabolic risks or clusters of risks, 1990–2015: A
systematic analysis for the Global Burden of Disease Study 2015. Lancet 2016, 388, 1659–1724. [CrossRef]
2. Guthold, R.; Stevens, G.A.; Riley, L.M.; Bull, F.C. Worldwide trends in insufficient physical activity from 2001
to 2016: A pooled analysis of 358 population-based surveys with 1·9 million participants. Lancet Glob. Health
2018, 6, e1077–e1086. [CrossRef]
3. Lee, I.-M.; Shiroma, E.J.; Lobelo, F.; Puska, P.; Blair, S.N.; Katzmarzyk, P.T. Lancet Physical Activity Series
Working Group. Effect of physical inactivity on major non-communicable diseases worldwide: An analysis
of burden of disease and life expectancy. Lancet 2012, 380, 219–229. [CrossRef]
4. Ding, D.; Lawson, K.D.; Kolbe-Alexander, T.L.; Finkelstein, E.A.; Katzmarzyk, P.T.; Van Mechelen, W.;
Pratt, M. Lancet Physical Activity Series 2 Executive Committee The economic burden of physical inactivity:
A global analysis of major non-communicable diseases. Lancet 2016, 388, 1311–1324. [CrossRef]
5. World Health Organization. Global Action Plan for the Prevention and Control of Noncommunicable Diseases
2013–2020; World Health Organization: Geneva, Switzerland, 2013.
6. World Health Organization. Global Action Plan on Physical Activity 2018–2030: More Active People for a Healthier
World; World Health Organization: Geneva, Switzerland, 2018.
7. Ministry of Health Welfare and Sport. Nationaal Sportakkoord Sport Verenigt Nederland; Ministry of Health
Welfare and Sport: The Hague, The Netherlands, 2018.
8. Ministry of Infrastructure and Water Management. Agenda Fiets 2017–2020; Ministry of Infrastructure and
Water Management: The Hague, The Netherlands, 2017.
9. Ministry of Health Welfare and Sport. Nationaal Preventieakkoord; Ministry of Health Welfare and Sport:
The Hague, The Netherlands, 2018.
10. Weggemans, R.M.; Backx, F.J.G.; Borghouts, L.; Chinapaw, M.; Hopman, M.T.E.; Koster, A.; Kremers, S.;
Van Loon, L.J.C.; May, A.; Mosterd, A.; et al. The 2017 Dutch Physical Activity Guidelines. Int. J. Behav. Nutr.
Phys. Act. 2018, 15, 58. [CrossRef] [PubMed]Int. J. Environ. Res. Public Health 2020, 17, 681 14 of 16
11. The Health Council of the Netherlands. Advies Beweegrichtlijnen 2017. Available online: https://www.
gezondheidsraad.nl/documenten/adviezen/2017/08/22/beweegrichtlijnen-2017 (accessed on 7 January 2019).
12. Kemper, H.; Ooijendijk, W.; Stiggelbout, M. Consensus Over de Nederlandse Norm Voor Gezond Bewegen; TNO:
Den Haag, The Netherlands, 2000.
13. Ding, D.; Varela, A.R.; Bauman, A.E.; Ekelund, U.; Lee, I.-M.; Heath, G.; Katzmarzyk, P.T.; Reis, R.;
Pratt, M. Towards better evidence-informed global action: Lessons learnt from the Lancet series and recent
developments in physical activity and public health. Br. J. Sports Med. 2019. [CrossRef] [PubMed]
14. Kohl, H.W., 3rd; Craig, C.L.; Lambert, E.V.; Inoue, S.; Alkandari, J.R.; Leetongin, G.; Kahlmeier, S.; Lancet
Physical Activity Series Working Group. The pandemic of physical inactivity: Global action for public health.
Lancet 2012, 380, 294–305. [CrossRef]
15. Breda, J.; Jakovljevic, J.; Rathmes, G.; Mendes, R.; Fontaine, O.; Hollmann, S.; Rütten, A.; Gelius, P.;
Kahlmeier, S.; Galea, G. Promoting health-enhancing physical activity in Europe: Current state of surveillance,
policy development and implementation. Health Policy 2018, 122, 519–527. [CrossRef] [PubMed]
16. Bennie, J.A.; Pedisic, Z.; Van Uffelen, J.G.Z.; Gale, J.; Banting, L.K.; Vergeer, I.; Stamatakis, E.; Bauman, A.E.;
Biddle, S.J.H. The descriptive epidemiology of total physical activity, muscle-strengthening exercises and
sedentary behaviour among Australian adults–results from the National Nutrition and Physical Activity
Survey. BMC Public Health 2016, 16, 73. [CrossRef] [PubMed]
17. Vuori, I.; Lankenau, B.; Pratt, M. Physical activity policy and program development: The experience in
Finland. Public Health Rep. 2004, 119, 331–345. [CrossRef] [PubMed]
18. Stamatakis, E.; Ekelund, U.; Wareham, N.J. Temporal trends in physical activity in England: The Health
Survey for England 1991 to 2004. Prev. Med. 2007, 45, 416–423. [CrossRef] [PubMed]
19. Du, Y.; Liu, B.; Sun, Y.; Snetselaar, L.G.; Wallace, R.B.; Bao, W. Trends in adherence to the physical activity
guidelines for Americans for aerobic activity and time spent on sedentary behavior among US adults, 2007
to 2016. JAMA Netw. 2019, 2, e197597. [CrossRef] [PubMed]
20. Carlson, S.A.; Fulton, J.E.; Schoenborn, C.A.; Loustalot, F. Trend and Prevalence Estimates Based on the 2008
Physical Activity Guidelines for Americans. Am. J. Prev. Med. 2010, 39, 305–313. [CrossRef] [PubMed]
21. Bennie, J.A.; De Cocker, K.; Teychenne, M.J.; Brown, W.J.; Biddle, S.J.H. The epidemiology of aerobic physical
activity and muscle-strengthening activity guideline adherence among 383,928 U.S. adults. Int. J. Behav. Nutr.
Phys. Act. 2019, 16, 34. [CrossRef] [PubMed]
22. Sjöström, M.; Oja, P.; Hagströmer, M.; Smith, B.J.; Bauman, A. Health-enhancing physical activity across
European Union countries: The Eurobarometer study. J. Public Health 2006, 14, 291–300. [CrossRef]
23. Hallal, P.C.; Andersen, L.B.; Bull, F.C.; Guthold, R.; Haskell, W.; Ekelund, U. Global physical activity levels:
Surveillance progress, pitfalls, and prospects. Lancet 2012, 380, 247–257. [CrossRef]
24. Bauman, A.; Ford, I.; Armstrong, T. Trends in Population Levels of Reported Physical Activity in Australia, 1997,
1999 and 2000; Australian Sports Commission: Canberra, Australia, 2001.
25. Strain, T.; Fitzsimons, C.; Kelly, P.; Mutrie, N. The forgotten guidelines: Cross-sectional analysis of
participation in muscle strengthening and balance & co-ordination activities by adults and older adults in
Scotland. BMC Public Health 2016, 16, 1108.
26. Milton, K.; Varela, A.R.; Strain, T.; Cavill, N.; Foster, C.; Mutrie, N. A review of global surveillance on the
muscle strengthening and balance elements of physical activity recommendations. J. Frailty Sarcopenia Falls
2018, 3, 114–124. [CrossRef]
27. Statistics Netherlands. Gezondheidsenquête 1981–1996 en POLS-Gezondheid 1997–2009.
Available online: https://www.cbs.nl/nl-nl/onze-diensten/methoden/onderzoeksomschrijvingen/
korte-onderzoeksbeschrijvingen/gezondheidsenquete-1981-1996-en-pols-gezondheid-1997-2009 (accessed
on 6 December 2019).
28. Statistics Netherlands. Vragenlijsten Gezondheidsenquête 2010 t/m 2013; Statistics Netherlands: Den Haag,
The Netherlands, 2013.
29. Statistics Netherlands. Gezondheidsenquête Vanaf 2014. Available online: https://www.cbs.nl/nl-nl/onze-
diensten/methoden/onderzoeksomschrijvingen/korte-onderzoeksbeschrijvingen/gezondheidsenquete-
vanaf-2014 (accessed on 6 December 2019).
30. Statistics Netherlands, National Institute for Public Health and the Environment. Health Survey/Lifestyle
Monitor; Statistics Netherlands (CBS) in collaboration with National Institute for Public Health and the
Environment (RIVM): The Hague/Bilthoven, The Netherlands, 2001–2018.Int. J. Environ. Res. Public Health 2020, 17, 681 15 of 16
31. Statistics Netherlands. Permanent Onderzoek Leefsituatie: Basis. Available online:
https://www.scp.nl/Onderzoek/Bronnen/Beknopte_onderzoeksbeschrijvingen/Permanent_onderzoek_
naar_de_leefsituatie_POLS (accessed on 6 December 2019).
32. Boonstra, H.J. Weging Gezondheidsenquete 2014; Statistics Netherlands: Den Haag, The Netherlands, 2015.
33. Wendel-Vos, G. Reproducibility and relative validity of the short questionnaire to assess health-enhancing
physical activity. J. Clin. Epidemiol. 2003, 56, 1163–1169. [CrossRef]
34. Campbell, N.; Gaston, A.; Gray, C.; Rush, E.; Maddison, R.; Prapavessis, H. The Short Questionnaire to
Assess Health-Enhancing (SQUASH) Physical Activity in Adolescents: A Validation Using Doubly Labeled
Water. J. Phys. Act. Health 2016, 13, 154–158. [CrossRef]
35. Makabe, S.; Makimoto, K.; Kikkawa, T.; Uozumi, H.; Ohnuma, M.; Kawamata, T. Reliability and validity
of the Japanese version of the short questionnaire to assess health-enhancing physical activity (SQUASH
squash) scale in older adults. J. Phys. Ther. Sci. 2015, 27, 517–522. [CrossRef] [PubMed]
36. Wagenmakers, R.; Akker-Scheek, I.V.D.; Groothoff, J.W.; Zijlstra, W.; Bulstra, S.K.; Kootstra, J.W.;
Wendel-Vos, G.W.; Van Raaij, J.J.; Stevens, M. Reliability and validity of the short questionnaire to assess
health-enhancing physical activity (SQUASH) in patients after total hip arthroplasty. BMC Musculoskelet.
Disord. 2008, 9, 141. [CrossRef] [PubMed]
37. Ainsworth, B.E.; Haskell, W.L.; Whitt, M.C.; Irwin, M.L.; Swartz, A.M.; Strath, S.J.; O’brien, W.L.; Bassett, D.R.;
Schmitz, K.H.; Emplaincourt, P.O.; et al. Compendium of physical activities: An update of activity codes
and MET intensities. Med. Sci. Sports Exerc. 2000, 32, S498–S516. [CrossRef]
38. Kumar, A.; Saxena, M.; Hammond, N.; Taylor, C.; Thompson, K.; Grattan, S. Near Two-fold Rise in ICD-coded
Sepsis-related Hospital Admissions in Australia: An Australian Institute of Health and Welfare Database
Analysis (2011–2016). Aust. Crit. Care 2019, 32, S7. [CrossRef]
39. Scholes, S. Health Survey for England 2016 Physical Activity in Adults 978-1-78734-099-2; HSCIC: Leeds, UK,
2017.
40. Loyen, A.; Van Hecke, L.; Verloigne, M.; Hendriksen, I.; Lakerveld, J.; Steene-Johannessen, J.; Vuillemin, A.;
Koster, A.; Donnelly, A.; Ekelund, U.; et al. Variation in population levels of physical activity in European
adults according to cross-European studies: A systematic literature review within DEDIPAC. Int. J. Behav.
Nutr. Phys. Act. 2016, 13, 72. [CrossRef] [PubMed]
41. Morren, M.; Willems, R. Gezondheidsenquête 2014: Een Analyse Van de Methodebreuk; Statistics Netherlands:
Heerlen, The Netherlands, 2015.
42. Troiano, R.P. A timely meeting: Objective measurement of physical activity. Med. Sci. Sports Exerc. 2005, 37,
S487–S489. [CrossRef]
43. Loyen, A.; Clarke-Cornwell, A.M.; Anderssen, S.A.; Hagströmer, M.; Sardinha, L.B.; Sundquist, K.;
Ekelund, U.; Steene-Johannessen, J.; Baptista, F.; Hansen, B.H.; et al. Sedentary Time and Physical
Activity Surveillance Through Accelerometer Pooling in Four European Countries. Sports Med. 2017, 47,
1421–1435. [CrossRef]
44. Holtermann, A.; Hansen, J.; Burr, H.; Søgaard, K.; Sjøgaard, G. The health paradox of occupational and
leisure-time physical activity. Br. J. Sports Med. 2012, 46, 291–295. [CrossRef]
45. Althoff, T.; Sosič, R.; Hicks, J.L.; King, A.C.; Delp, S.L.; Leskovec, J. Large-scale physical activity data reveal
worldwide activity inequality. Nature 2017, 547, 336–339. [CrossRef]
46. King, A.C.; King, D.K. Physical Activity for an Aging Population. Public Health Rev. 2010, 32, 401–426.
[CrossRef]
47. Telama, R. Tracking of physical activity from childhood to adulthood: A review. Obes. Facts 2009, 2, 187–195.
[CrossRef] [PubMed]
48. Rovio, S.P.; Yang, X.; Kankaanpää, A.; Aalto, V.; Hirvensalo, M.; Telama, R.; Pahkala, K.; Hutri-Kähönen, N.;
Viikari, J.S.; Raitakari, O.T. Longitudinal physical activity trajectories from childhood to adulthood and their
determinants: The Young Finns Study. Scand. J. Med. Sci. Sports 2018, 28, 1073–1083. [CrossRef]
49. Drieskens, S.; Van Oyen, H.; Demarest, S.; Van der Heyden, J.; Gisle, L.; Tafforeau, J. Multiple risk behaviour:
Increasing socio-economic gap over time? Eur. J. Public Health 2010, 20, 634–639. [CrossRef]
50. Smith, P.; Frank, J.; Mustard, C. Trends in educational inequalities in smoking and physical activity in Canada:
1974–2005. J. Epidemiol. Community Health 2009, 63, 317–323. [CrossRef] [PubMed]Int. J. Environ. Res. Public Health 2020, 17, 681 16 of 16
51. Ding, D.; Do, A.; Schmidt, H.-M.; Bauman, A.E. A widening gap? Changes in multiple lifestyle risk
behaviours by socioeconomic status in New South Wales, Australia, 2002–2012. PLoS ONE 2015, 10, e0135338.
[CrossRef]
52. Elgar, F.J.; Pförtner, T.-K.; Moor, I.; De Clercq, B.; Stevens, G.W.J.M.; Currie, C. Socioeconomic inequalities in
adolescent health 2002–2010: A time-series analysis of 34 countries participating in the Health Behaviour in
School-aged Children study. Lancet 2015, 385, 2088–2095. [CrossRef]
© 2020 by the authors. Licensee MDPI, Basel, Switzerland. This article is an open access
article distributed under the terms and conditions of the Creative Commons Attribution
(CC BY) license (http://creativecommons.org/licenses/by/4.0/).You can also read