Ethanol-Quenching Introduced Oxygen Vacancies in Strontium Titanate Surface and the Enhanced Photocatalytic Activity - MDPI
←
→
Page content transcription
If your browser does not render page correctly, please read the page content below
nanomaterials

Article
Ethanol-Quenching Introduced Oxygen Vacancies in
Strontium Titanate Surface and the Enhanced
Photocatalytic Activity
Yang Xiao 1 , Shihao Chen 1 , Yinhai Wang 1, * , Zhengfa Hu 2 , Hui Zhao 1 and Wei Xie 3
 1   School of Physics & Optoelectronic Engineering, Guangdong University of Technology, Guangzhou 510006,
     China; xiaognay@163.com (Y.X.); shchenbhx@163.com (S.C.); kkhui@gdut.edu.cn (H.Z.)
 2   Synergy Innovation Institute for Modern Industries, Guangdong University of Technology,
     Dongyuan 517500, China; zhfhu@gdut.edu.cn
 3   School of Physics Science and Technology, Lingnan Normal University, Zhanjiang 524048, China;
     xiewei@lingnan.edu.cn
 *   Correspondence: yhwang@gdut.edu.cn; Tel.: +86-020-39322265

 Received: 23 May 2019; Accepted: 10 June 2019; Published: 14 June 2019

 Abstract: Modification of the surface properties of SrTiO3 crystals by regulating the reaction
 environment in order to improve the photocatalytic activity has been widely studied.
 However, the development of a facile, effective, and universal method to improve the photocatalytic
 activity of these crystals remains an enormous challenge. We have developed a simple method to
 modify the surface environment of SrTiO3 by ethanol quenching, which results in enhanced UV,
 visible and infrared light absorption and photocatalytic performance. The SrTiO3 nanocrystals were
 preheated to 800 ◦ C and immediately quenched by submersion in ethanol. X-ray diffraction patterns,
 electron paramagnetic resonance spectra, and X-ray photoelectron spectra indicated that upon rapid
 ethanol quenching, the interaction between hot SrTiO3 and ethanol led to the introduction of a high
 concentration of oxygen vacancies on the surface of the SrTiO3 lattice. Consequently, to maintain the
 regional charge balance of SrTiO3 , Sr2+ could be substituted for Ti4+ . Moreover, oxygen vacancies
 induced localized states into the band gap of the modified SrTiO3 and acted as photoinduced charge
 traps, thus promoting the photocatalytic activity. The improved photocatalytic performance of the
 modified SrTiO3 was demonstrated by using it for the decomposition of rhodamine B and production
 of H2 from water under visible or solar light.

 Keywords: photocatslysis; SrTiO3 ; ethanol-quenching; oxygen vacancies; photodegradation;
 photocatlytic H2 generation

1. Introduction
     Since the discovery of photoelectrochemical water splitting on a titania electrode by Fujishima and
Honda in 1972, photocatalysis using semiconductors has been widely studied [1]. Semiconductor-based
photocatalysts are capable of directly converting solar energy to chemical energy, which provides
a facile approach for environmental protection and H2 production under sunlight irradiation [2–4].
Among these semiconductors, titanium dioxide (TiO2 ) has attracted special interest because of
its chemical stability, non-toxicity, and low cost [5,6]. In addition, Strontium titanate (SrTiO3 ),
a perovskite-type oxide, has been classified a wide-band gap (3.1–3.7 eV) semiconductor photocatalyst
in the field of light energy exploitation. SrTiO3 possesses various outstanding physical and chemical
properties such as good chemical/catalytic stability, suitable band position, and susceptibility to change
by other substance. Notably, the conduction band of SrTiO3 is more negative than that of TiO2 , which is

Nanomaterials 2019, 9, 883; doi:10.3390/nano9060883                       www.mdpi.com/journal/nanomaterials
Nanomaterials 2019, 9, 883                                                                         2 of 11

beneficial for photocatalysis [7]. However, because of its large band-gap, SrTiO3 can be utilized only in
the UV region of sunlight, which largely restricts its practical application in photocatalysis [8,9].
      Many studies have attempted to expand the spectral response of SrTiO3 by utilizing methods such
as doping with a metal/nonmetal, or co-doping with a nonmetal to form a new intermediate gap state
between the valence band (VB) and the conduction band (CB) [10–14]. Moreover, mixing of the energy
levels of the dopant and host elements can change the position of the VB or CB, resulting in increased
visible light absorption [9]. However, the rapid rate of recombination of the electron-hole pairs in
SrTiO3 results in poor photocatalytic efficiency. One of the methods to improve the separation efficiency
of photogenerated electron-hole pairs involves combination with other noble metals (usually Pt, Au,
and Rh) or semiconductors on the surface [15–18]. In the other hand, the important role played by
surface oxygen vacancies in improving the photocatalytic performance is well known. Surface oxygen
vacancies can be used as surface adsorption sites and photoinduced charge traps, where the charge
shifts to the adsorbed compound, so that the recombination of photogenerated electron-holes is
prevented and the photocatalytic performance is improved [19,20]. Therefore, introducing oxygen
vacancies on the surface of the SrTiO3 lattice seems to be a feasible process to modify the surface
environment of SrTiO3 . This process could improve the adsorption capacity of SrTiO3 and inhibit the
recombination of photogenerated electron-hole pairs, thus improving the photocatalytic performance
of SrTiO3 [21].
      In 2011, Mao and co-worker developed black TiO2 by introducing disorder in the surface
layer of TiO2 via hydrogenation in a high H2 -pressure atmosphere at about 200 ◦ C for 5 days.
This modification greatly enhanced the solar light harvesting efficiency and photocatalytic activity of
TiO2 [22]. Subsequently, various methods were developed to synthesize hydrogenated or reduced
semiconductors such as TiO2 , ZnO and WO3 with surface oxygen defects for improving their
photocatalytic performance [23–26]. Unsurprisingly, hydrogenated or reduced SrTiO3 was also
synthesized. Tan et al. introduced oxygen vacancies on the SrTiO3 surface by heating it to 300–375 ◦ C
under Ar atmosphere, to control any solid-state reaction between NaBH4 and SrTiO3 , which improved
its photocatalytic activity for H2 generation under UV-vis irradiation [19]. Zhao et al. prepared black
SrTiO3 with abundant Ti3+ cations and oxygen vacancies by reduction using molten aluminum at
500 ◦ C. The black SrTiO3 showed enhanced light absorption in the visible and near-infrared region and
remarkable photocatalytic performance [27]. However, some questions regarding the photocatalytic
practical applications of SrTiO3 remain unanswered. The preparation conditions of these modified
SrTiO3 photocatalyst are too complex, hazardous, and costly, thus hindering the extensive application
of this compound in photocatalysis.
      Supphasrirongjaroen et al. demonstrated that rapid quenching in different media can lead to
the formation of Ti3+ self-dopants in TiO2 , thus improving the photocatalytic activity of TiO2 -based
materials [28]. Herein, we report a facile method to prepare SrTiO3 rich in oxygen vacancies,
with improved photocatalytic performance in the visible region. SrTiO3 was preheated to a high
temperature, followed by rapid submersion in ethanol, resulting in the darkening of the color of
SrTiO3 . Various structural and electronic analyses revealed the introduction of oxygen vacancies in
the quenched SrTiO3 (Q-SrTiO3 ), resulting in increased photocatalytic activity. The photocatalytic
performance of Q-SrTiO3 was evaluated by using it for the degradation of rhodamine B (RhB) dye and
the photolysis of water to produce H2 , with the original SrTiO3 as a control. The results indicated the
enhanced photocatalytic activity of Q-SrTiO3 .

2. Materials and Methods

2.1. Preparation of Q-SrTiO3
    1 g of original SrTiO3 nanoparticles (99.5%, ~100 nm, Macklin Biochemical, Germany) was
weighed using an electronic scale, then 1 g of original SrTiO3 was put in a sintering boat (length 6 cm,
width 3 cm, height 1.5 cm). When the Muffle furnace heat to 800 ◦ C, the sintering boat along with
Nanomaterials 2019, 9, 883 3 of 11
1 g of original SrTiO3 was transferred to the Muffle furnace. The SrTiO3 nanoparticles were heated at
800 ◦ C for 20 min, and then open the Muffle furnace door, immediately took out the sintering boat and
submerged the SrTiO3 in 45 mL ethanol (AR) at room temperature for rapid quenching. Afterwards,
the quenched sample was filtered and then dried at 80 ◦ C for 3 h for further use.
2.2. Characterization
An X-ray diffractometer (XRD, D8 ADVANCE, Bruker, Karlsruhe, Germany) was used to check the
phase structures of all the samples. Data were collected between 20◦ and 80◦ (2θ) with a 0.02◦ step size
using Cu Kα irradiation, at 36 kV tube voltage and 20 mA tube current. Field-emission transmission
electron microscopy (FE-TEM, Talos F200S, FEI, Thermo, Hillsboro, OR, USA) and Field-emission
scanning electron microscopy (FE-SEM, SU8220, Hitach, Tokyo, Japan) was used to determine the
surface change, particle size and morphology of the samples. Sample specimens for the FE-TEM and
the FE-SEM observations were prepared as follows: The powdered sample was dispersed in ethanol in
an ultrasonic washing bath, and then, a drop of the suspension was dripped slightly onto a micro grid
or a silicon slice and dried before imaging. X-ray Photoelectron Spectroscopy (XPS, Escalab 250Xi,
Thermo Fisher, Bremen, Germany) was used to analyze the chemical composition and relative amount
of the elements on the surface of the samples, with a reference of C1 s and the excitation source of
150 W Al Kα X-rays. An Electron paramagnetic resonance spectrometer (EPR, EMXplus-10/12, Bruker,
Karlsruhe, Germany) was used to detect unpaired electrons in the samples at room temperature.
A UV-Vis-NIR spectrophotometer (DRUV-vis, UV-3600 Plus, SHIMADZU, Kyoto, Japan) were used to
record the UV-vis diffuse reflectance absorption in the range of 200–2000 nm.
2.3. Photocatalytic Test
2.3.1. Photocatalytic Degradation of RhB
The photocatalytic degradation activities of Q-SrTiO3 were evaluated by monitoring the rate of
decomposition of RhB in an aqueous solution under visible-light or UV-light irradiation from a 500 W
Xe lamp equipped with a UV cut off filter (>420 nm) or 500 W Hg lamp, the light intensity of 500 W Xe
lamp equipped with a UV cut off filter and 500 W Hg lamp are 6 mW/cm2 and 48 mW/cm2 , respectively.
A cylindrical Pyrex vessel equipped with a lamp was used as the photocatalytic reactor, with water
circulation to keep the reaction temperature at about 27 ◦ C. 40 mL of an aqueous solution of RhB
(4 × 10⁻⁵ M) and 0.02 g Q-SrTiO3 or SrTiO3 were placed in a quartz tube for the degradation reaction.
Before the photodegradation, a dark reaction was conducted for 30 min to ensure adsorption-desorption
equilibrium between the photocatalyst and the RhB solution. Continuous magnetic stirring was carried
out to keep the photocatalyst suspended in the RhB solution. Next, the mixture was exposed to visible
light or UV light. The samples were collected at regular intervals (1.5 h or 1 h), and the concentration
of RhB in the solution was determined using a UV-Vis spectrophotometer at 553 nm. The percentage of
degradation was recorded as C/C0 , and the reaction constant (Kapp ) was calculated from the slope of
the linear regression obtained from the plot of −ln (C/C0 ) vs. time, where C0 and C are the absorbance
of the RhB solution initially and at a particular time, respectively.
2.3.2. Photocatalytic Evolution of hydrogen
The photocatalytic H2 production experiments were conducted in a 400 mL Pyrex quartz glass
reactor at normal pressure and temperature. The photocatalyst (100 mg) was dispersed in 100 mL of 10%
aqueous methanol solution (methanol acting as a sacrificial agent) using a magnetic stirrer. Then the
reaction mixture was dispersed in an ultrasonic washing bath for 10 min. Before the irradiation by a
300 W Xe lamp (CRL-HXF300, China) as the sunlight source, the reactor was deaerated with nitrogen
gas. During the photocatalytic reaction, the reactant solution was maintained at room temperature
by using a Low-temperature cooling circulating pump (CEL-CR300, China), and magnetic stirring
was continually maintained to keep the photocatalyst suspended in the aqueous methanol solution.Nanomaterials 2019, 9, x FOR PEER REVIEW 4 of 11
chromatograph (Shimadzu, Japan) equipped with an MS-5A column. The total reaction time
Nanomaterials 2019, 9, 883 4 of 11
for each
sample was 5 h, and the H2 concentration was measured every hour.
The amount of H generated was tested using an online Shimadzu GC-2014C gas chromatograph
2
3. Results and Discussion
(Shimadzu, Japan) equipped with an MS-5A column. The total reaction time for each sample was 5 h,
and the H2 concentration was measured every hour.
3.1. Characterization of the Photocatalysts
3. Results and Discussion
The peaks in the powder XRD patterns of SrTiO3 and Q-SrTiO3 (Figure 1) matched with the (100),
3.1. Characterization
(110), (111), of the Photocatalysts
(200), (210), (211), (220) and (310) planes, indicating a characteristic SrTiO3 cubic structure
(JCPDS card: The73-6001). Moreover,
peaks in the powder XRD a small
patternspeak for3 SrCO
of SrTiO 3 was3 (Figure
and Q-SrTiO observed, probably
1) matched with due
the to the
coexistence(100),of
(110), (111),
SrTiO (200), SrCO
3 and (210), (211),
3 under (220) the
and (310) planes, indicating
atmospheric operatinga characteristic
conditions SrTiO 3 cubic in the
adopted
structure (JCPDS card: 73-6001). Moreover, a small peak for SrCO3 was observed, probably due
hydrothermal method [29]. No other diffraction peak was observed in the XRD patterns. Comparison
to the coexistence of SrTiO3 and SrCO3 under the atmospheric operating conditions adopted in the
with the hydrothermal
XRD patterns from the local enlargement of the diffraction peaks (inset of Figure 1) revealed
method [29]. No other diffraction peak was observed in the XRD patterns. Comparison
a slight with
shiftthe(2θ~0.15°)
XRD patternsof from
the the
(110)
localpeak to a lower
enlargement angle forpeaks
of the diffraction Q-SrTiO 3. Figure
(inset of According to the
1) revealed a Bragg
equationslight
(2d shift θ = λ.◦ )where
sin (2θ~0.15 d, peak
of the (110) θ and to a λ areangle
lower the for
crystal
Q-SrTiOspacing, diffraction
3 . According to the Braggangle, and X-ray
equation
wavelength,(2d sin θ = λ. where a
respectively), d,shift
θ andinλ the
are the crystal spacing,
diffraction peaks diffraction
toward aangle,lowerand angleX-ray wavelength,
suggests an increase
respectively), a shift in the diffraction peaks toward a lower angle suggests an increase in the lattice 2+
in the lattice parameters. This might be attributed to the substitution of Sr (ionic radius Sr > Ti4+)
2+
parameters. This might be attributed to the substitution of Sr2+ (ionic radius Sr2+ > Ti4+ ) for Ti4+ in
for Ti4+ inQ-SrTiO
Q-SrTiO 3 [30].
[30].
3
(110)
SrTiO3
In ten sity(a.u.)
Q-SrTiO3
* SrCO3
(110)
Intensity(a.u.)
30 31 32 33 34 35
2 θ ( degrees )
(200)
(211)
(111)
(220)
*
(310)
(100)
(210)
* * *
** * *
20 30 40 50 60 70 80
2θ( degrees)
Figure
Figure 1. XRD
1. XRD patternsof
patterns of SrTiO
SrTiO3 3and
andQ-SrTiO3 samples.
Q-SrTiO 3 samples.
The UV-visible absorption spectra of SrTiO3 and Q-SrTiO3 (Figure 2a) exhibited an absorption onset
TheatUV-visible
~400 nm, which absorption
corresponds spectra
to a bandofgap
SrTiO
of 3.1 andInQ-SrTiO
3 eV. (Figure
contrast to3 the SrTiO3 ,2a)
the exhibited an absorption
photoabsorption of
onset at ~400 3nm, which corresponds to a band gap of 3.1 eV. In contrast to the SrTiO3, the
Q-SrTiO was dramatically enhanced in the both UV, visible and infrared light regions, consistent with
the color change
photoabsorption of the sample
of Q-SrTiO from white to gray (inset of Figure 2a). The improved light absorption
3 was dramatically enhanced in the both UV, visible and infrared light
was attributed to the formation of surface oxygen vacancies in Q-SrTiO3 . Similar results have been
regions, consistent with the color change of the sample from white to gray (inset of Figure 2a). The
observed in other studies [19,31].
improved lightEPRabsorption was attributed
is highly sensitive to unpairedto the formation
electrons; hence, itof wassurface
used foroxygen vacancies
the detection in Q-SrTiO3.
of oxygen
Similar results have
vacancies and been3+ observed
Ti species in other
in SrTiO studies3 (Figure
3 and Q-SrTiO [19,31].2b) Both SrTiO3 and Q-SrTiO3 showed a
EPRdistinct
is highly
EPR signal at g =to
sensitive 1.977 and g = 2.002,
unpaired electrons; hence,
which could be it was used
ascribed to Ti3+for
andthe detection
oxygen vacancies,of oxygen
respectively. Because of its intrinsic non-stoichiometry, SrTiO always
vacancies and Ti species in SrTiO3 and Q-SrTiO3 (Figure 2b) Both SrTiO3 and Q-SrTiO3 showed a
3+ 3 contains a fraction of oxygen
vacancies and Ti3+ ions [32]. EPR spectra revealed that Q-SrTiO exhibited a stronger signal intensity
distinct EPR signal at g = 1.977 and g = 2.002, which could be3 ascribed to Ti3+ and oxygen vacancies,
for oxygen vacancies than did SrTiO3 , indicating the presence of more oxygen vacancies in Q-SrTiO3 ,
respectively. Because
thus favoring of its intrinsic
enhanced non-stoichiometry,
photocatalytic activity of the Q-SrTiOSrTiO 3 always contains a fraction of oxygen
3 . Takata and Domen also demonstrated
vacancies and
that Ti of
doping3+ ions [32].with
a cation EPR spectra
a lower valencerevealed
ion thanthat Q-SrTiO
that of the parent3 exhibited
cation (suchaasstronger signal
Sr2+ in SrTiO 3 ) can
intensity
for oxygen vacancies
introduce oxygen than did SrTiO
vacancies, 3, indicating
thus effectively the presence
improving of moreactivity
its photocatalytic oxygen [32].vacancies
Thus, basedinon Q-SrTiO3,
thus favoring enhanced photocatalytic activity of the Q-SrTiO3. Takata and Domen also demonstrated
that doping of a cation with a lower valence ion than that of the parent cation (such as Sr2+ in SrTiO3)
can introduce oxygen vacancies, thus effectively improving its photocatalytic activity [32]. Thus,
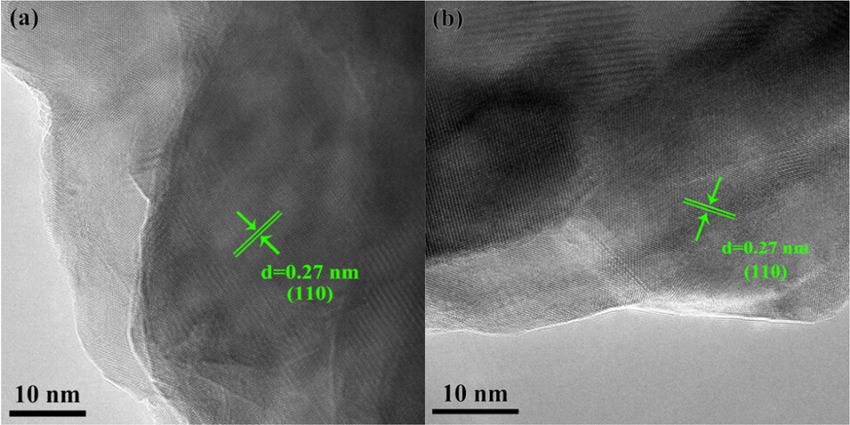
based on the XRD results, due to the exists of abundant oxygen vacancies, in order to keep theNanomaterials 2019, 9, 883 5 of 11
the XRD results, due to the exists of abundant oxygen vacancies, in order to keep the regional charge
balance of the Q-SrTiO3 , the Sr2+ ions could substituted for Ti4+ ions, so that lattice expansion occurs
(Figure 2c) 2019,
Nanomaterials [32,33].
9, x FOR PEER REVIEW 5 of 11
(a) (b)
SrTiO3 g1 g1≈ 2.002
SrTiO3
Q-SrTiO3 g2≈ 1.977
Q-SrTiO3 g2
Absorption(a.u.)
Q-SrTiO3 SrTiO3
Intensity(a.u.)
400 800 1200 1600 2000
3200 3400 3600 3800
Wavelength(nm) Magnetic field (gauss)
SrTiO3 + SrO = 2SrTi + Vo·· + 4OO.
Figure 2.
Figure UV-vis absorption
2. UV-vis absorption spectra
spectra ofof SrTiO
SrTiO33 and
and Q-SrTiO
Q-SrTiO33 (a),
(a), the
the insert
insert is
is aa photograph
photograph of of SrTiO
SrTiO33
and Q-SrTiO
and Q-SrTiO33; ;EPR
EPRspectra
spectraofofSrTiO
SrTiO 3 and
3 and Q-SrTiO
Q-SrTiO 3 (b).
3 (b). Schematic
Schematic illustration
illustration of lattice
of lattice change
change of
of Q-
Q-SrTiO
SrTiO 3 after
3 after solvent-quenching
solvent-quenching (c).(c).
The high-resolution
The high-resolution transmission
transmission electron
electron microscopy
microscopy (HR-TEM)
(HR-TEM) images
images (Figure
(Figure 3a,b)
3a,b) revealed
revealed
the interplanar spacing of SrTiO and Q-SrTiO crystals to be ~0.27 nm, which
the interplanar spacing of SrTiO33 and Q-SrTiO33 crystals to be ~0.27 nm, which is consistent with is consistent with the
the
d-spacings of
d-spacings of the
the (110)
(110) crystallographic
crystallographic planes
planes ofof cubic
cubic SrTiO
SrTiO33.. However,
However, LiuLiu et
et al.
al. have
havereported
reportedthat
that
an ice-water quenching TiO had introduced a disordered surface layer surrounding
an ice-water quenching TiO2 had introduced a disordered surface layer surrounding the crystalline
2 the crystalline
core,and
core, andthethesurface
surfacelattice
latticedistortion
distortionis is related
related to the
to the generation
generation of oxygen
of oxygen vacancies
vacancies during
during the
the ice-
ice-water quenching ◦
water quenching [34].[34]. In contrast,
In contrast, Q-SrTiO
Q-SrTiO 3 prepared
3 prepared in in this
this workused
work used800
800°CCethanol
ethanolquenching
quenching
that did not lead to specific disordered surface layer, therefore, the generation of morevacancies
that did not lead to specific disordered surface layer, therefore, the generation of more oxygen oxygen
in Q-SrTiO
vacancies have not3 introduced
in3 Q-SrTiO disordered
have not introduced surface layer.
disordered Thelayer.
surface SEMTheimages
SEM(Figure
images3c,d) revealed
(Figure 3c,d)
the particle size and particle morphology of Q-SrTiO and SrTiO show no
revealed the particle size and particle morphology of Q-SrTiO3 and SrTiO3 show no change, and the
3 3 change, and the average
diameters
average of Q-SrTiO
diameters and SrTiO
of 3Q-SrTiO 3 nanocrystals
3 and
are ~100 nm,
SrTiO3 nanocrystals are hence,
~100 nm,ethanol-quenching can not change
hence, ethanol-quenching can
the change
not particlethe
sizeparticle
and particle
size andmorphology of samples.of samples.
particle morphology
XPS was used to investigate the surface chemical composition and VB position of SrTiO3 and
Q-SrTiO3 . The Sr 3d5/2 , Sr 3d3/2 , Ti 2p1/2 , and Ti 2p3/2 binding energies were 133.2, 134.6, 458.0,
and 464.0 eV, respectively, in accordance with the literature values (Figure 4a,b) [35]. The Sr 3d and Ti
2p spectra showed no obvious variation between SrTiO3 and Q-SrTiO3 . The Sr/Ti ratio of the samples
was estimated according to the peak area and sensitivity factor of Sr 3d and Ti 2p (Table 1). The atomic
ratio of Sr to Ti on the surface was about 1.64 and 2.15 for SrTiO3 and Q-SrTiO3 , respectively. The largerNanomaterials 2019, 9, 883 6 of 11
atomic ratio of Sr/Ti in Q-SrTiO3 than that in SrTiO3 might be due to the substitution of Sr2+ for Ti4+ on
the surface 2019,
Nanomaterials of the
9, xformer.
FOR PEER REVIEW 6 of 11
Figure 3.
Figure 3. High-resolution TEM images
High-resolution TEM images and
and SEM
SEM images
images of
of SrTiO
SrTiO33 (a,c)
(a,c) and
and Q-SrTiO
Q-SrTiO33 (b,d).
(b,d).
XPS was used to Table 1. Summary
investigate of the XPS
the surface data for
chemical the SrTiO3 and
composition andQ-SrTiO 3.
VB position of SrTiO3 and Q-
SrTiO3. The Sr 3d5/2, Sr 3d3/2, Ti 2p1/2, Atomic
and Ti Concentration
2p3/2 binding energies
(%)
were 133.2, 134.6, 458.0, and 464.0
Atomic Ratio
Sample
eV, respectively, in accordance with the literature values (Figure 4a,b) [35]. The Sr 3d and Ti 2p
Ti Sr O C Sr/Ti
spectra showed no obvious variation between SrTiO3 and Q-SrTiO3. The Sr/Ti ratio of the samples
was estimated SrTiO
according
3 3.73
to 6.14 and sensitivity
the peak area 31.36 factor of 58.76
Sr 3d and Ti1.642p (Table 1). The
Q-SrTiO3 2.83 6.10 29.75 61.32 2.15
atomic ratio of Sr to Ti on the surface was about 1.64 and 2.15 for SrTiO3 and Q-SrTiO3, respectively.
The larger atomic ratio of Sr/Ti in Q-SrTiO3 than that in SrTiO3 might be due to the substitution of
TheTiO
Sr2+ for 4+ 1s
onhigh-resolution X-ray
the surface of the photoelectron spectra of SrTiO3 and Q-SrTiO3 showed two typical
former.
components of SrTiO3 (Figure 4c). The two peaks located at 529.2 and 531.5 eV were assigned to
bulk oxygen and surface Tableoxygen in the
1. Summary of samples, respectively.
the XPS data for the SrTiOBased on previous
3 and Q-SrTiO 3. research, it was
assumed that the peak intensity of surface oxygen was related to the concentration of oxygen vacancies
Atomic Concentration (%) Atomic Ratio
on theSample
surface of SrTiO3 and Q-SrTiO3 [19,36]. The peak intensity at 531.5 eV become stronger for
Ti Sr O C Sr/Ti
Q-SrTiO3 , indicating that the concentration of oxygen vacancies on the surface of Q-SrTiO3 increased
SrTiO3 3.73 6.14 31.36 58.76 1.64
after the ethanol-quenching process. The introduction of more oxygen vacancies on the surface of
Q-SrTiO3 2.83 6.10 29.75 61.32 2.15
Q-SrTiO3 lattice resulted in impure/defect states in the band gap, enhancing the visible and near
infrared-light absorption of Q-SrTiO3 [27]. Furthermore, the increased amount of oxygen vacancies
can improve the efficient charge transport in Q-SrTiO3 , followed by the Fermi level shift toward to the
CB of the Q-SrTiO3 , facilitating the separation of photogenerated electron-hole pairs and resulting
in enhanced photocatalytic activity [19,27]. In the VB XPS profile, the VB maxima were estimated byNanomaterials 2019, 9, 883 7 of 11
linear extrapolation of the peaks to the baselines (Figure 4d). Both, SrTiO3 and Q-SrTiO3 displayed
identical VB2019,
Nanomaterials band9, xpositions at 2.3 eV below the Fermi energy, indicating no shift in the VB edge.
FOR PEER REVIEW 7 of 11
(a) (b)
Sr 3d Ti 2p S rTiO3
SrTiO 3
Q-SrTiO 3 Q-SrTiO3
Sr 3d5/2 Sr 3d3/2
Intensity(a.u.)
Intensity(a.u.)
130 132 134 136 138 140 142 450 455 460 465 470
Binding Energy(eV) Binding Energy(eV)
(c) (d)
O 1s VB
SrTiO 3
Q-SrTiO 3
Intensity(a.u.)
Intensity (a.u.)
2.3 eV
SrTiO 3
Q-SrTiO 3
530 535 540
0 3 6
Binding Energy(eV) Binding Energy (eV)
Figure 4. Sr
Sr 3d
3d XPS
XPS spectra
spectra (a),
(a), Ti
Ti 2p XPS spectra (b), O1s Spectra (c), XPS valence band spectra of
SrTiO33 and
and Q-SrTiO
Q-SrTiO33 samples
samples (d).
(d).
3.2. Photocatalytic Activity
The O 1s high-resolution X-ray photoelectron spectra of SrTiO3 and Q-SrTiO3 showed two
typical
Thecomponents of SrTiO3of
photodegradation (Figure
RhB in 4c).aqueous
The twosolution
peaks located
underatvisible-light
529.2 and 531.5 eV werewas
irradiation assigned
used
to
to evaluate the photocatalytic activity of the Q-SrTiO3 , with SrTiO3 as the control (Figure was
bulk oxygen and surface oxygen in the samples, respectively. Based on previous research, it 5a).
assumed that the peak intensity
After adsorption-desorption of surface
equilibrium betweenoxygen was relatedand
the photocatalyst to the
the RhB
concentration
solution was ofachieved
oxygen
vacancies
in the absenceon of
thelight,
surface
evenof SrTiO
a slight 3 and Q-SrTiO
adsorption of RhB3 [19,36].
over the The peakresulted
samples intensity
in aat 531.5
slight eV become
decrease in the
stronger for Q-SrTiO , indicating that the concentration of oxygen vacancies
concentration of RhB. During the photodegradation process, SrTiO3 showed no appreciable reduction
3 on the surface of Q-
SrTiO increased
in the 3RhB after theinethanol-quenching
concentration process. The
aqueous solution; however, introduction
Q-SrTiO of more oxygen vacancies on
3 showed higher photocatalytic activity
the surface of Q-SrTiO lattice resulted in impure/defect
than SrTiO3 in reducing the concentration of RhB in aqueous solution. After
3 states in the band gap, enhancing
370 the visible
min of visible-light
and near infrared-light absorption of Q-SrTiO [27]. Furthermore, the
irradiation in the presence of Q-SrTiO3 , RhB was decomposed by about 20%; in contrast, SrTiO
3 increased amount of3oxygen
caused
vacancies can improve the
only 3% decomposition efficient
of the dye. The charge transport
reaction in Q-SrTiO
constant 3, followed
(Kapp ) was by from
calculated the Fermi levelofshift
the slope the
toward to the CB of the Q-SrTiO , facilitating the separation of photogenerated electron-hole
linear regression obtained from the plot of −ln (C/C0 ) vs. time (Figure 5b). These results suggested that
3 pairs
and resulting
Q-SrTiO in enhanced photocatalytic activity [19,27]. In the VB XPS profile, the VB maxima were
3 shows better activity than SrTiO3 for the photodegradation of RhB under visible light.
estimated by linear extrapolation of the peaks to the baselines (Figure 4d). Both, SrTiO3 and Q-SrTiO3
displayed identical VB band positions at 2.3 eV below the Fermi energy, indicating no shift in the VB
edge.
3.2. Photocatalytic Activity
The photodegradation of RhB in aqueous solution under visible-light irradiation was used to
evaluate the photocatalytic activity of the Q-SrTiO3, with SrTiO3 as the control (Figure 5a). After
adsorption-desorption equilibrium between the photocatalyst and the RhB solution was achieved in
the absence of light, even a slight adsorption of RhB over the samples resulted in a slight decrease in
the concentration of RhB. During the photodegradation process, SrTiO3 showed no appreciable
reduction in the RhB concentration in aqueous solution; however, Q-SrTiO3 showed higher
photocatalytic activity than SrTiO3 in reducing the concentration of RhB in aqueous solution. After
370 min of visible-light irradiation in the presence of Q-SrTiO3, RhB was decomposed by about 20%;
in contrast, SrTiO3 caused only 3% decomposition of the dye. The reaction constant (Kapp) was
calculated from the slope of the linear regression obtained from the plot of −ln (C/C0) vs. time (FigureNanomaterials 2019, 9, x FOR PEER REVIEW 8 of 11
5b). These results
Nanomaterials 2019, 9,suggested
883 that Q-SrTiO3 shows better activity than SrTiO3 for the photodegradation
8 of 11
of RhB under visible light.
(a) (b)
1.00 0.20
SrTiO3
Q-SrTiO3
0.95 0.15
SrTiO3
Q-SrTiO3
-ln (C/C0)
0.90 0.10
C/C0
0.85 0.05
Light off Light on
0.80 0.00
0 30 100 200 300 400 0 50 100 150 200 250 300 350 400
Time(min) Time (min)
(c) (d) 2.5
1.0 SrTiO3 SrTiO3
Q-SrTiO3 2.0 Q-SrTiO3
0.8
1.5
0.6
-ln(C/C0)
C/C0
1.0
0.4
0.5
Light off Light on
0.2
0.0
0.0
0 50 100 150 200 250 300 0 50 100 150 200 250 300
Time (min) Time(min)
(e) 250 (f)
SrTiO3 SrTiO3
40
200 Q-SrTiO3 Q-SrTiO3
H2 generation (umol/g)
150
30
rH2 (umol g-1h-1)
100
20
50
0 10
0 1 2 3 4 5
Time/(h) 0
SrTiO3 Q-SrTiO3
Figure
Figure5.5.Photodecomposition
PhotodecompositionofofRhB RhBaqueous
aqueoussolution
solutionwith
withSrTiO
SrTiO3 3and
andQ-SrTiO
Q-SrTiO3 3under
undervisible
visiblelight
light
(a) and UV light (c). −ln (C/C0 ) of the RhB concentration as a function of visible light (b) orUV
(a) and UV light (c). −ln (C/C 0) of the RhB concentration as a function of visible light (b) or UVlight
light
(d)
(d)irradiation
irradiationtime.
time.Time-course
Time-courseofofphotocatalytic
photocatalyticwater
watersplitting
splittingfor
forHH2 generation in 100 mL 10%
2 generation in 100 mL 10%
aqueous
aqueousmethanol
methanolsolution
solution under
undersolar light
solar (e).(e).
light TheThe
raterate
of hydrogen
of hydrogen generation for SrTiO
generation 3 and and
for SrTiO 3
Q-
SrTiO under solar light (f).
Q-SrTiO3 under solar light (f).
3
The UV-light
The UV-light photocatalytic
photocatalytic activities
activities ofof Q-SrTiO
Q-SrTiO3 3 were
were investigated
investigated byby monitoring
monitoring the the
decompositionof
decomposition ofRhB
RhBin in an
an aqueous
aqueous solution, with
with SrTiO
SrTiO33 as
as the
thecontrol
control(Figure
(Figure5c,d).
5c,d).After
After270 270min
minof
ofUV-light
UV-lightirradiation, the
irradiation, theRhB dye
RhB was
dye wasalmost
almostcompletely
completelydecomposed
decomposed (~90%) byby
(~90%) Q-SrTiO
Q-SrTiO3 , (Figure
3 , 5c).
(Figure
The reaction constant (Kapp ) was shown in Figure 5d, this results also suggested that Q-SrTiO3 shows
better photocatalytic activity than SrTiO3 for the photodegradation of RhB.Nanomaterials 2019, 9, 883 9 of 11
The photocatalytic activity of Q-SrTiO3 for the photolysis of water to produce H2 in 100 mL
10% aqueous methanol solution was also studied under solar irradiation, using SrTiO3 as the control.
Figure 5c,d present the time course of H2 generation for SrTiO3 and Q-SrTiO3 under solar light
irradiation. Q-SrTiO3 steadily produced H2 gas at the rate of 42.12 µmol g−1 h−1 , which was almost
6.2 times higher than that observe with SrTiO3 (6.83 µmol g−1 h−1 ). All these results demonstrated that
Q-SrTiO3 possesses higher photocatalytic activity than SrTiO3 .
4. Conclusions
In this paper, a facile and general method has been introduced to modify the surface environment
of SrTiO3 through an ethanol-quenching process. Q-SrTiO3 showed higher photocatalytic activity
than did SrTiO3 for the degradation of RhB and the photolysis of water to produce H2 under the
irradiation by visible, UV or solar light. Results of spectroscopic characterization revealed that after
rapid ethanol quenching, a high concentration of oxygen vacancies was introduced on the surface
of the Q-SrTiO3 lattice. Consequently, in order to maintain the regional charge balance in Q-SrTiO3 ,
the redundant Sr2+ is likely to substitute for Ti4+ . Moreover, oxygen vacancies play an important
role in enhancing the photocatalytic performance of Q-SrTiO3 by not only inducing localized states
into the band gap of Q-SrTiO3 , but also acting as photoinduced charge traps. Consequently, the light
absorption ability is increased and the recombination rate of photogenerated electron-hole pairs is
decreased, thus enhancing the photocatalytic activity of Q-SrTiO3 .
Author Contributions: Y.X.: performed photocatalysts synthesis, XRD, TEM, UV-visible absorption spectra
analysis, photocatalytic activity tests and wrote the manuscript, S.C.: supervised rhodamine B and photocatlytic H2
generation analysis in cooperation with Y.X., Y.W.: conceived the concept, designed the experiments, analyzed the
data and revised the manuscript, Z.H.: performed EPR analysis, H.Z.: performed XPS analysis, W.X.: performed
photocatalytic H2 generation.
Funding: This research received no external funding.
Acknowledgments: This work is supported by the National Nature Science Foundation of China (No.21271048),
Natural Science Foundation of China (11747074), Guangdong province science and technology plan project public
welfare fund and ability construction project (2016A010103041, 2017A010103025), Doctoral Program of Lingnan
Normal University (ZL1503), China Spark Program (2015GA780058).
Conflicts of Interest: The authors declare no conflict of interest.
References
1. Fujishima, A.; Honda, K. Electrochemical photolysis of water at a semiconductor electrode. Nature 1972, 238, 37–38.
[CrossRef] [PubMed]
2. Chen, X.B.; Shen, S.H.; Guo, L.J.; Mao, S.S. Semiconductor-based photocatalytic hydrogen generation.
Chem. Rev. 2010, 110, 6503–6570. [CrossRef] [PubMed]
3. Ran, J.R.; Zhang, J.; Yu, J.G.; Jaroniecc, M.; Qiao, S.Z. Earth-abundant cocatalysts for semiconductor based
photocatalytic water splitting. Chem. Soc. Rrv. 2015, 46, 7787–7812. [CrossRef] [PubMed]
4. Wang, H.L.; Zhang, L.S.; Chen, Z.G.; Hu, J.Q.; Li, S.J.; Wang, Z.H.; Liu, J.S.; Wang, X.C. Semiconductor
heterojunction photocatalysts: Design, construction, and photocatalytic performances. Chem. Soc. Rrv.
2014, 43, 5234–5244. [CrossRef] [PubMed]
5. Dhakshinamoorthy, A.; Navalon, S.; Corma, A.; Garcia, H. Photocatalytic CO2 reduction by TiO2 and related
titanium containing solids. Energy Environ. Sci. 2012, 5, 9217–9233. [CrossRef]
6. Pei, Z.X.; Weng, S.X.; Liu, P. Enhanced photocatalytic activity by bulk trapping and spatial separation of
charge carriers: A case study of defect and facet mediated TiO2 . Appl. Catal. B Environ. 2016, 180, 463–470.
[CrossRef]
7. Wu, Z.; Su, Y.F.; Yu, J.D.; Xiao, W.; Sun, L.; Lin, C.J. Enhanced photoelectrocatalytic hydrogen production activity
of SrTiO3 -TiO2 heteronanoparticle modified TiO2 nanotube arrays. Int. J. Hydrog. Energy 2015, 40, 9704–9712.
[CrossRef]
8. Wenderich, K.; Mul, G. Methods, mechanism, and applications of photodeposition in photocatalysis: A review.
Chem. Rev. 2016, 116, 14587–14619. [CrossRef]Nanomaterials 2019, 9, 883 10 of 11
9. Grabowska, E. Selected perovskite oxides: Characterization, preparation and photocatalytic properties–A
review. Appl. Catal. B Environ. 2016, 186, 97–126. [CrossRef]
10. Xie, T.H.; Sun, X.Y.; Lin, J. Enhanced photocatalytic degradation of RhB driven by visible light-induced
MMCT of Ti(IV)–O–Fe(II) formed in fe–doped SrTiO3 . J. Phys. Chem. C 2008, 112, 9753–9759. [CrossRef]
11. Ouyang, S.; Tong, H.; Umezawa, N.; Cao, J.; Li, P.; Bi, Y.; Zhang, Y.; Ye, J. Surface–alkalinization–induced enhancement
of photocatalytic H2 evolution over SrTiO3-Based photocatalysts. J. Am. Chem. Soc. 2012, 134, 1974–1977. [CrossRef]
[PubMed]
12. Liu, P.; Nisar, J.; Pathak, B.; Ahuja, R. Hybrid density functional study on SrTiO3 for visible light photocatalysis.
Int. J. Hydrog. Energy 2012, 37, 11611–11617. [CrossRef]
13. Yan, J.H.; Zhu, Y.R.; Tang, Y.G.; Zheng, S.Q. Nitrogen-doped SrTiO3 /TiO2 composite photocatalysts for
hydrogen production under visible light irradiation. J. Alloy. Compd. 2009, 472, 429–433. [CrossRef]
14. Luo, H.M.; Takata, T.; Lee, Y.; Zhao, J.F.; Domen, K.; Yan, Y.S. Photocatalytic Activity Enhanced for Titanium
Dioxide by Co-doping with Bromine and Chlorine. Chem. Mater. 2004, 16, 846–849. [CrossRef]
15. Enterkin, J.A.; Setthapun, W.; Elam, J.W.; Christensen, S.T.; Rabuffetti, F.A.; Marks, L.D.; Stair, P.C.;
Poeppelmeier, K.R.; Marshall, C.L. Propane oxidation over Pt/SrTiO3 nanocuboids. ACS Catal. 2011, 1, 629–635.
[CrossRef]
16. Pan, X.W.; Wang, L.Q.; Ling, F.; Li, Y.H.; Han, D.X.; Pang, Q. A novel biomass assisted synthesis of Au-SrTiO3
as a catalyst for hydrogen generation from formaldehyde aqueous solution at low temperature. Int. J. Hydrog.
Energy 2015, 40, 1752–1759. [CrossRef]
17. Iwashina, K.; Kudo, A. Rh-doped SrTiO3 photocatalyst electrode showing cathodic photocurrent for water
splitting under visible-light irradiation. J. Am. Chem. Soc. 2011, 133, 13272–13275. [CrossRef] [PubMed]
18. Chambers, S.A.; Engelhard, M.H.; Shutthanandan, V.; Zhu, Z.; Droubay, T.C.; Qiao, L.; Sushko, P.V.;
Feng, T.; Lee, H.D.; Gustafsson, T.; et al. Instability, intermixing and electronic structure at the epitaxial
LaAlO3 /SrTiO3 (001) heterojunction. Surf. Sci. Rep. 2010, 65, 317–352. [CrossRef]
19. Tan, H.Q.; Zhao, Z.; Zhu, W.B.; Coker, E.N.; Li, B.S.; Zheng, M.; Yu, W.X.; Fan, H.Y.; Sun, Z.C. Oxygen vacancy
enhanced photocatalytic activity of pervoskite SrTiO3 . ACS Appl. Mater. Interfaces 2014, 6, 19184–19190.
[CrossRef]
20. Wang, G.M.; Ling, Y.C.; Li, Y. Oxygen-deficient metal oxide nanostructures for photoelectrochemical water
oxidation and other applications. Nanoscale 2012, 4, 6682–6691. [CrossRef]
21. Thompson, T.L.; Yates, J.T., Jr. TiO2 -based photocatalysis: surface defects, oxygen and charge transfer.
Top. Catal. 2005, 35, 3–4. [CrossRef]
22. Chen, X.B.; Liu, L.; Yu, P.Y.; Mao, S.S. Increasing solar absorption for photocatalysis with black hydrogenated
titanium dioxide nanocrystals. Science 2011, 331, 746–750. [CrossRef] [PubMed]
23. Yan, Y.; Han, M.Y.; Konkin, A.; Koppe, T.; Wang, D.; Andreu, T.; Chen, G.; Vetter, U.; Morante, J.R.;
Schaaf, P. Slightly hydrogenated TiO2 with enhanced photocatalytic performance. J. Mater. Chem. A
2014, 2, 12708–12716. [CrossRef]
24. Wang, G.M.; Wang, H.Y.; Ling, Y.C.; Tang, Y.C.; Yang, X.Y.; Fitzmorris, R.C.; Wang, C.C.; Zhang, J.Z.; Li, Y.
Hydrogen-treated TiO2 nanowire arrays for photoelectrochemical water splitting. Nano Lett. 2011, 11, 3026–3033.
[CrossRef] [PubMed]
25. Wang, G.M.; Ling, Y.C.; Wang, H.Y.; Yang, X.Y.; Wang, C.C.; Zhang, J.Z.; Li, Y. Hydrogen-treated WO3
nanoflakes show enhanced photostability. Energy Environ. Sci. 2012, 5, 6180–6187. [CrossRef]
26. Lu, X.H.; Wang, G.M.; Xie, S.L.; Shi, J.Y.; Li, W.; Tong, Y.X.; Li, Y. Efficient photocatalytic hydrogen evolution
hydrogenated ZnO nanorod arrays. Chem. Commun. 2012, 48, 7717–7719. [CrossRef] [PubMed]
27. Zhao, W.L.; Zhao, W.; Zhu, G.L.; Lin, T.Q.; Xu, F.F.; Huang, F.Q. Black strontium titanate nanocrystals of
enhanced solar absorption for photocatalysis. CrystEngComm 2015, 17, 7528–7534. [CrossRef]
28. Supphasrirongjaroen, P.; Kongsuebchart, W.; Panpranot, J.; Mekasuwandumrong, O.; Satayaprasert, C.;
Praserthdam, P. Dependence of quenching process on the photocatalytic activity of solvothermal-derived
TiO2 with various crystallite sizes. Ind. Eng. Chem. Res. 2008, 47, 693–697. [CrossRef]
29. Dong, W.J.; Li, X.Y.; Yu, J.; Guo, W.C.; Li, B.J.; Tan, L.; Li, C.R.; Shi, J.J.; Wang, G. Porous SrTiO3 spheres with
enhanced photocatalytic performance. Mater. Lett. 2012, 67, 131–134. [CrossRef]
30. Feng, L.L.; Zou, X.X.; Zhao, J.; Zhou, L.J.; Wang, D.J.; Zhang, X.; Li, G.D. Nanoporous Sr-rich strontium
titanate: a stable and superior photocatalyst for H2 evolution. Chem. Commun. 2013, 49, 9788–9790.
[CrossRef]Nanomaterials 2019, 9, 883 11 of 11
31. Tan, H.; Zhao, Z.; Niu, M.; Mao, C.; Cao, D.; Cheng, D.; Feng, P.; Sun, Z. A facile and versatile method for
preparation of colored TiO2 with enhanced solar-driven photocatalytic activity. Nanoscale 2014, 6, 10216–10223.
[CrossRef] [PubMed]
32. Takata, T.; Domen, K. Defect engineering of photocatalysts by doping of aliovalent metal cations for efficient
water splitting. J. Phys. Chem. C 2009, 113, 19386–19388. [CrossRef]
33. Hofman, W.; Hoffmann, R.W. Dopant influence on dielectric losses, leakage behaviour, and resistance
degradation of SrTiO3 thin films. Thin Solid Film 1997, 305, 66–73. [CrossRef]
34. Liu, B.S.; Cheng, K.; Nie, S.C.; Zhao, X.J.; Yu, H.G.; Yu, J.G.; Fujishima, A.; Nakata, K. Ice–water quenching
induced Ti3+ Self-doped TiO2 with surface lattice distortion and the increased photocatalytic activity. J. Phys.
Chem. C 2017, 121, 19836–19848. [CrossRef]
35. Wagner, C.D. Handbook of X-ray Photoelectron Spectroscopy; Perkin-Elmer Corporation: Waltham, MA, USA, 1979.
36. Schaub, R.; Thostrup, P.; Lopez, N.; Lægsgaard, E.; Stensgaard, I.; Nørskov, J.K.; Besenbacher, F. Oxygen
vacancies as active sites for water dissociation on rutile TiO2 (110). Phys. Rev. Lett. 2006, 87, 266104-1–266104-4.
[CrossRef] [PubMed]
© 2019 by the authors. Licensee MDPI, Basel, Switzerland. This article is an open access
article distributed under the terms and conditions of the Creative Commons Attribution
(CC BY) license (http://creativecommons.org/licenses/by/4.0/).You can also read