Driven electronic bridge processes via defect states in 229Th-doped crystals
←
→
Page content transcription
If your browser does not render page correctly, please read the page content below
PHYSICAL REVIEW A 103, 053120 (2021)

                  Driven electronic bridge processes via defect states in 229 Th-doped crystals

     Brenden S. Nickerson,1,* Martin Pimon ,2 Pavlo V. Bilous,3,1 Johannes Gugler,2 Georgy A. Kazakov,4 Tomas Sikorsky,4
                        Kjeld Beeks ,4 Andreas Grüneis,5,2 Thorsten Schumm,4 and Adriana Pálffy6,1,†
                                    1
                                       Max-Planck-Institut für Kernphysik, D-69117 Heidelberg, Germany
                      2
                        Center for Computational Material Science, Technische Universität Wien, 1040 Vienna, Austria
                                 3
                                   Max-Planck-Institut für die Physik des Lichts, D-91058 Erlangen, Germany
                                        4
                                          Atominstitut, Technische Universität Wien, 1020 Vienna, Austria
                            5
                              Institute for Theoretical Physics, Technische Universität Wien, 1040 Vienna, Austria
                 6
                   Department of Physics, Friedrich-Alexander-Universität Erlangen-Nürnberg, D-91058 Erlangen, Germany

                                   (Received 31 March 2021; accepted 27 April 2021; published 24 May 2021)

                  The electronic defect states resulting from doping 229 Th in CaF2 offer a unique opportunity to excite the
               nuclear isomeric state 229m Th at approximately 8 eV via electronic bridge mechanisms. We consider bridge
               schemes involving stimulated emission and absorption using an optical laser. The role of different multipole
               contributions, both for the emitted or absorbed photon and nuclear transition, to the total bridge rates are
               investigated theoretically. We show that the electric dipole component is dominant for the electronic bridge
               photon. In contradistinction, the electric quadrupole channel of the 229 Th isomeric transition plays the dominant
               role for the bridge processes presented. The driven bridge rates are discussed in the context of background signals
               in the crystal environment and of implementation methods. We show that inverse electronic bridge processes
               quenching the isomeric state population can improve the performance of a solid-state nuclear clock based on
               229m
                    Th.

               DOI: 10.1103/PhysRevA.103.053120

                       I. INTRODUCTION                                         Substantial experimental progress has been made in the
                           229m                                            study of thorium ions in beams and traps, with the first direct
   The nuclear isomer         Th is our most compelling can-
                                                                           proof of isomer decay [3,7], an updated energy determina-
didate for the development of the first nuclear clock. With
                                                                           tion [1], and the measurement of isomer nuclear moments
an energy of just 8 eV [1,2], it is more comparable to
                                                                           [8]. A solid-state thorium oxide target has also been stud-
transitions of valence electrons in the atomic shell than any-
                                                                           ied recently with x-ray nuclear resonance scattering pumping
thing expected in all of the currently known isotopes [3].
                                                                           schemes for improved isomer production [9]. Here we are
Most importantly, the 229m Th isomer could be accessible
                                                                           interested in an alternate experimental approach making use
by narrow-band vacuum ultraviolet (VUV) lasers, which is
                                                                           of VUV-transparent crystals doped with thorium ions. The
the key to designing a frequency standard based on a nu-
                                                                           crystal environment allows for dopant densities many orders
clear transition [4,5]. A practical implementation will require
                                                                           of magnitude larger than would be possible for trapped ions
development of such lasers and a more precise knowledge
                                                                           [10–13]. Concentrations in the range of 1016 –1018 cm−3 are
of the isomer energy. At present, the isomer energy was
                                                                           easily reached [14], which make a significant impact√ on the
reported as Em = 8.28(17) eV using a direct measurement
                                                                           stability of the potential clock proportionally to N [15],
of internal conversion electrons [1], Em = 8.30(92) eV [6]
                                                                           where N is the number of interrogated nuclei. Along with
from determining the transition rates and energies from
                                                                           the relative ease with which the doped crystals can be man-
the above level at 29.2 keV in a calorimetric experiment,
                                                                           ufactured and transported, this makes thorium-doped VUV
or Em = 8.10(17) eV from state-of-the-art gamma spec-
                                                                           transparent crystals a promising candidate for the nuclear
troscopy measurements using a dedicated cryogenic magnetic
                                                                           clock implementation.
microcalorimeter [2].
                                                                               Despite the apparent upsides, significant effort has gone
                                                                           into attempts of direct isomer excitation within the VUV-
                                                                           transparent crystal environment so far without success [11,16–
 *
     brenden.nickerson@mpi-hd.mpg.de                                       21]. Allegedly, theoretical models show that the radiative
 †
     adriana.palffy-buss@fau.de                                            transition is weak [22–24], and also the explored energy
                                                                           range around the previously used energy value of 7.8 eV
Published by the American Physical Society under the terms of the          [25] might have been disadvantageous. In addition, a va-
Creative Commons Attribution 4.0 International license. Further            riety of crystal defects induced by radioactivity and laser
distribution of this work must maintain attribution to the author(s)       irradiation led to reported background in the UV and VUV
and the published article’s title, journal citation, and DOI. Open         range along with a reduction in VUV transmission. Back-
access publication funded by the Max Planck Society.                       ground sources include phosphorescence of crystal defects

2469-9926/2021/103(5)/053120(13)                               053120-1                            Published by the American Physical Society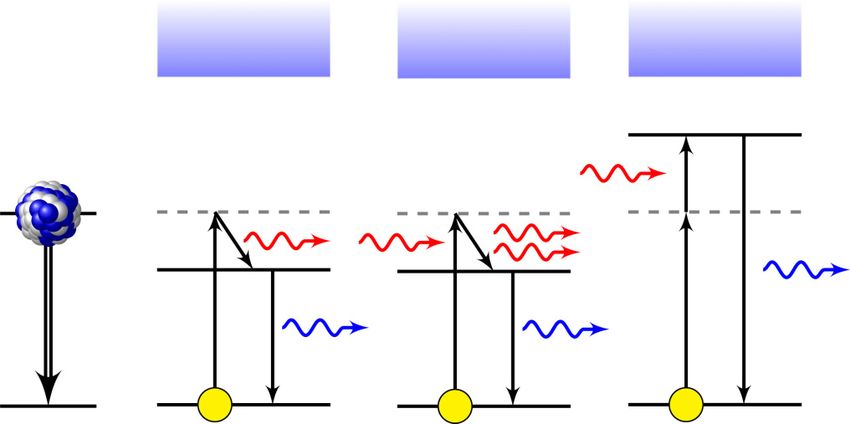
BRENDEN S. NICKERSON et al. PHYSICAL REVIEW A 103, 053120 (2021)
both intrinsic and laser induced, and Cherenkov radiation
stemming from β-radioactive daughter nuclei in the 229 Th c c c
decay chain [11,17–21].
Here we outline excitation methods that make use of a d e d e
specific set of electronic defect states in the crystal to increase
both the rate of excitation and the total excited population of v m
the nuclear isomeric state. These defect states are predicted by v v
density functional theory (DFT) to exist in the vicinity of the e
229 d
Th nucleus as a direct consequence of the crystal doping.
Their energies lie in the band gap of CaF2 close to the nuclear
transition energy [19]. In Ref. [26] we have put forward how o o o
these states can be used to drive an electronic bridge (EB) Spontaneous Stimulation Absorption g
scheme for excitation of the isomer in the crystal environment.
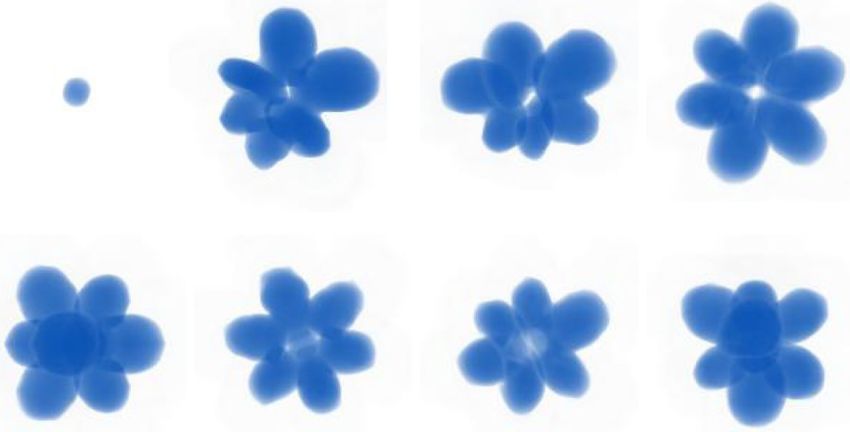
The EB process can enable nuclear excitation and decay via FIG. 1. EB process for the excitation of 229m Th from the ground
electromagnetic coupling to the atomic shell in a third-order state |g to the isomeric state |m (right graph) [26]. The initially
perturbation theory process, without requiring a perfect ener- populated electronic defect states |d lie in the crystal band gap above
getic match between the atomic and nuclear transitions. The or below the isomer energy. The EB process occurs either sponta-
energy mismatch is covered by the emission or absorption of neously (left graph) or assisted by an optical laser in the stimulated
a photon. In the context of 229 Th, several EB scenarios for Th or absorption schemes (middle graphs). In all cases, EB proceeds via
ions have been investigated theoretically [27–33]. a virtual electronic state |v and ends in the ground state |o. The
In this work we build up on the original proposal [26] conduction band states are given by the set |c.
with a twofold purpose. First, we further investigate the role
of different multipolarities, both for the emitted or absorbed based on quenching of the isomer population via driven EB
photon (referred to here in general as the bridge photon) and channels is investigated theoretically. Our results show that
the nuclear transition itself. In Ref. [26] we focused on EB the quenching can improve the short-term stability of the
processes where the optical bridge photon had electric dipole clock by more than one order of magnitude.
(E 1) multipolarity which was assumed to be the dominant The paper is structured as follows. In Sec. II the formalism
channel. To have a better understanding of the competing of both spontaneous and driven EB processes in the crystal
processes, here we analyze EB rates where the bridge photon environment are presented in the non-relativistic limit. Details
has E 1, magnetic dipole (M1) or electric quadrupole (E 2) regarding state parity and allowed transitions are discussed for
multipolarity respectively. Since the crystal wave functions E 1, M1, and E 2 bridge processes. The density functional the-
are not eigenfunctions of angular momentum and parity, one ory methods used for the calculation of electronic defect states
cannot rule out a priori the effect of the M1 and E 2 mul- are presented in Sec. II B. Numerical results are presented in
tipole operators. Nevertheless, these processes are shown to Sec. III, including a discussion of convergence criteria for
be orders of magnitude slower than the corresponding E 1 the EB calculations in Sec. III A. The impact of the nuclear
process and therefore negligible here. Details regarding the M1 and E 2 channels are discussed in the context of EB pro-
density functional calculations which are crucial to the results cesses showing their relative strength. Section IV discusses
presented here are also covered. experimental approaches for the precise measurement of the
The convergence criteria for the EB rates are studied and electronic defect states in the crystal, along with potential
broken down into contributions from M1 and E 2 nuclear difficulties. Section IV A investigates the potential impact of
transition multipolarities, respectively. Traditionally, earlier driven EB schemes as means of isomer population quenching
discussions of the potential decay pathways for the nuclear on the performance of a solid-state nuclear clock. Concluding
isomer focused on the M1 channel. However, it was shown remarks are given in the final Sec. V.
in Ref. [34] that the E 2 channel can have a significant and
even dominant contribution for internal conversion and EB
II. ELECTRONIC BRIDGE IN THE CRYSTAL
transitions for thorium ions. Here we confirm these results in
ENVIRONMENT
the crystal environment and show that for the dominant EB
processes, the nuclear E 2 pathway accounts for upwards of The term EB is used in the literature for both nuclear
85% to the final transition rate. excitation and nuclear decay facilitated by the coupling to the
The second purpose of this work is to discuss the prospect atomic shell. While electronic and nuclear transitions happen
of experimental implementation for the defect-state-based EB simultaneously, their energies do not have to match exactly;
processes and the resulting solid-state nuclear clock perfor- the difference in energy is carried away by or supplied by
mance. The starting point here is the precise identification of an emitted or absorbed photon, respectively. In the context
the defect state energy and width, which could be performed of VUV-transparent crystals, possible EB excitation schemes
in VUV fluorescence or absorption measurements. For defect involving the excitation of the 229 Th nucleus from the ground
energies approaching the band gap, the direct spectroscopic state |g to the isomeric state |m are illustrated in Fig. 1 [26].
detection is mainly limited by the doped crystal transparency. The VUV-transparent CaF2 crystal presents a band gap of
In addition, it is compulsory to investigate possible broad- approximately 11.5 eV between the ground state |o and the
ening mechanisms of the defect states otherwise difficult to conduction band |c. Due to thorium doping, electronic defect
model theoretically. Finally, the nuclear clock performance states |d located in the range of the nuclear isomer appear in
053120-2
DRIVEN ELECTRONIC BRIDGE PROCESSES VIA DEFECT …                                                    PHYSICAL REVIEW A 103, 053120 (2021)

the crystal band gap. The precision of DFT calculations is not           spontaneous process  sp (a → b) as [35,36]
sufficient to be confident whether the defect states are slightly
above or slightly below the isomer. We therefore consider both                                                           π 2 c2 h̄2
                                                                                          st (a → b) =  sp (a → b)                I,   (1)
possibilities in the following.                                                                                             E3
    A spontaneous EB exciting the nuclear isomer can occur
                                                                         where the spectral intensity of the laser source I is given in SI
when the defect states |d are initially populated and lie higher
                                                                         units as W/(m2 s−1 ). The required photon energy is denoted
in energy than the isomeric state. This situation is illustrated in
                                                                         by E = h̄ωab = h̄(ωa − ωb ), and c stands for the speed of
the left-most panel of Fig. 1. The initially populated electronic
                                                                         light. Via detailed balance, the stimulated rate  st (a → b) can
defect states can decay to the ground state |o by transferring
                                                                         be related to the inverse absorption process rate as  ab (b →
the excitation energy to the nucleus. The process proceeds
                                                                         a) =  st (a → b)δ(a → b), with δ(a → b) = Na /Nb the ratio
via a virtual electronic state |v and the surplus of energy
                                                                         of multiplicities of sets {|a} versus {|b}. Hence, as an input
is emitted in the form of a photon. One can additionally
                                                                         we must first calculate the spontaneous EB process of interest.
stimulate the spontaneous process by shining a laser with the
                                                                         Referring to Fig. 1, for the Absorption case we can connect
same frequency and polarization as the one of the outgoing
                                                                         the spontaneous and laser-assisted processes by considering
photon. Should the defect states lie below the isomer, the
                                                                         the time-reversed picture, i.e., by reversing the initial and final
spontaneous process is not possible. However, by providing
                                                                         states of the electron and nucleus along with the direction of
the system with the missing energy in the form of a laser
                                                                         flow of the photon and transition arrows.
photon, absorption can render the EB energy transfer possible.
                                                                             For the expression of the spontaneous EB rates, we switch
In this case, the simultaneous decay of the defect state and
                                                                         to atomic units (h̄ = me = e = 1). Depending on the multipo-
absorption of the laser photon will lead to nuclear excitation
                                                                         larity of the emitted photon, we can write the expressions for
and population of the isomer.
                                                                         E 1, M1, and E 2 bridge rates as
    The allowed transitions in the electronic shell, together
with the nuclear transition multipolarity determine the multi-                            4  ω p 3 1
polarity of the emitted photon. In 229 Th, the nuclear transition                 Esp1 =                      |m, o|
                                                                                                                      QE 1 |g, d|2 ,    (2)
                                                                                          3 c       NgNd
from the ground state |g with angular momentum 5/2+ and                                                     m, g,
                                                                                                             o, d
positive parity to the isomeric state 3/2+ can proceed via
                                                                                                4 ω3p 1
M1 and E 2 multipole mixing. Thus, typically an allowed E 1                              sp
                                                                                        M1 =             |m, o|
                                                                                                                 QM1 |g, d|2 ,          (3)
transition between the initial and final electronic states will                                 3 c5 NgNd
                                                                                                           m, g,
convert to an E 1 multipolarity of the emitted photon. When                                                o, d
selection rules forbid the E 1 channel for the EB photon, the                                  1  ω p 5 1
much slower magnetic dipole or electric quadrupole channels                         Esp2 =                   |m, o|
                                                                                                                     QE 2 |g, d|2 .     (4)
                                                                                              15 c       NgNd
should be considered. In the crystal environment, however, all                                                m, g,
                                                                                                              o, d
electronic states are no true eigenstates of angular momentum
or parity, and thus no selection rules can be directly applied.
                                                                         States are denoted for example by |g, d = |g|d where g
In the following we present the application of the EB theo-
                                                                         represents the quantum numbers of the nuclear ground state
retical formalism to the crystal environment and discuss our
                                                                         and d that of the defect state. The ground state |o is taken
knowledge of the defect states.
                                                                         as the highest energy valence band state. The sums over d
                                                                         and o are performed over the spin degenerate sublevels of
                  A. EB theoretical formalism                            each respective state. The frequency of the emitted photon
   As introduced in [26] and presented in Fig. 1, EB processes           is denoted by ω p = ωdo − ωmg, and the degeneracies of the
can be assisted by an optical laser which couples the initial or         nuclear ground and defect state are given by Ng and Nd ,
final electronic state with the virtual state causing stimulation        respectively. The bridge operators QμL are spherical tensor
or absorption and faster EB rates. For this we note once again           operators of type μ (electric E or magnetic M), multipolarity
here that the rate  st (a → b) of a laser-stimulated generic pro-       L and have 2L + 1 spherical components. The bridge operator
cess |a → |b can be related to the rate of the corresponding           matrix elements can be written as


                                                    o|QμL |nn|TλK,q |d        o|TλK,q |kk|QμL |d
                     μL |g, d =
              m, o|Q                      (−1)q                               +                                   m|MλK,−q |g.        (5)
                                    λK,q             n
                                                             ωdn − ωmg              k
                                                                                              ωok + ωmg

Here, λK represent the multipolarities of the coupling oper-             μL, these operators have different dimension, corresponding
ators TλK,q and nuclear transition operators MλK,−q where                to the different multiplication factors in Eqs. (2)–(4), and also
q = (−K, −K + 1, . . . , K − 1, K ) are their spherical com-             a different number of spherical components. In the case of an
ponents [37,38]. The summations are performed over all                   E 1 bridge, QE 1 = −r, where r is the position relative to the
unoccupied intermediate electronic states denoted by |n and             thorium nucleus which is considered the origin. In     a similar
|k. The spherical tensor operator QμL describes the emitted             fashion we have QM1 = − 21 (l + σ) and QE 2 = − 4π  r 2Y 2
photon of multipolarity μL. Please note that depending on                                                                  5
                                                                         for M1 and E 2 EB processes, respectively. Here, l is the

                                                                   053120-3
BRENDEN S. NICKERSON et al. PHYSICAL REVIEW A 103, 053120 (2021)
orbital angular momentum of the electron, σ are the Pauli d1 d2 d3 d4
matrices and we use the notation Y 2 (Y2,q ) for the spherical
harmonics.
The nuclear isomeric transition in 229 Th is a mixture of
magnetic dipole and electric quadrupole which restricts the
sum over λK to these two multipolarities. This is not to
be confused with the multipolarity μL of the bridge photon
which is either emitted or absorbed. In the nonrelativistic
d5 d6 d7 d8
limit, the magnetic-dipole coupling operator reads [39]
1 lq σq rq (σ · r) 4π
TM1,q = − 3 +3 + σq δ(r) , (6)
c r3 2r 2r 5 3
where l (lq ) is the orbital angular momentum of the electron, σ FIG. 2. Electron density illustrations for the defect states labeled
(σq ) are the Pauli matrices (in spherical basis) and δ(r) denotes {|d} = {|d1 , . . . , |d8 }.
the Dirac delta function. The electric-quadrupole coupling
operator is given by [38]
this calculated band gap with the experimentally measured
1 4π value of 11.5 eV, a scaling procedure via the scissors operator
TE 2,q = − 3 Y2,q (θ , φ). (7) is applied in the calculation [51,52]. As a result, the (scaled)
r 5
defect states lie in the region of 10.5 eV. The obtained energy
An important ingredient for calculating the electronic ma- values are presented in Sec. III in Table I. We emphasize
trix elements of QμL and TλK,q are the crystal wave functions here that we cannot undoubtedly assign the defect states’
for the valence, defect, and conduction band states. These energy without further experimental investigation. As such,
are obtained from DFT calculations, together with the corre- energies given by DFT&S(cissor) should only be understood
sponding energies ωdn and ωok . Our DFT approach and its as an estimate, and will be used along with energy scalings
limitations are presented in Sec. II B. The sums over interme- employed to better understand the EB choices in the energy
diate states require a good knowledge of a large number of region around 8 eV.
states in the conduction band. Our results on the convergence Since VASP uses the Projector Augmented Wave (PAW)
of the EB rates will be discussed in Sec. III A. method [53], the all-electron Kohn-Sham (AE-KS) wave
Returning to the EB rate expression in Eq. (5), the last term function | near the nucleus is augmented in order to in-
on the right-hand side m|MλK,−q |g stands for the matrix ele- crease numerical performance. This augmentation applies a
ments of the nuclear transition operators. These are connected linear operator O to the so-called pseudo wave function | ˜
via the Wigner-Eckart theorem [40] to the reduced transition such that | = O| ˜ . The linear operator O is defined as
probabilities B↓ for which we use theoretical values predicted O = 1 + i (|φi − |φ̃i ) p̃i |, where |φi and |φ̃i are the AE
in Ref. [22]. and pseudo partial waves respectively and p̃i | are the projec-
tors.
B. Defect states in Th:CaF2 In this work we compute the matrix elements in Eq. (5) in
CaF2 has an experimentally measured band gap in the the basis of one-electron states using a real space represen-
region of 11–12 eV [41–43]. DFT calculations using the Vi- tation of | . This representation was obtained by extracting
enna Ab initio Simulation Package (VASP) at the gamma point the projectors, partial waves and pseudo wave functions from
[44,45] show that, upon doping with thorium, there are eight VASP and carrying out the linear transformation O : | ˜ →
spin-degenerate defect states {|d} = {|d1 , . . . , |d8 } appear- | . We estimate the accuracy of the resulting AE-KS wave
ing within the band gap of undoped CaF2 . These states are
localized on the Th dopant and its 5 f orbital, while the tran-
sition from the valence band |o to the set {|d} is reminiscent TABLE I. HSE defect state energies Ed obtained from DFT&S
of a 2p orbital electron of an interstitial fluorine ion migrating and electronic transition rates Asp (d → o) from the defect state to
to the Th ion. For the DFT calculations we use the Heyd- the ground state calculated using the E 1, M1, and E 2 multipole
Scuseria-Ernzerhof (HSE) hybrid functional [46,47], which is operators, respectively.
an improvement to other generalized gradient approximations
Asp (d → o) (s−1 )
for the description of various physical properties, especially
for the band gap [48]. Depending on the case under investiga- Ed (eV) E1 M1 E2
tion, HSE is otherwise at least on par in terms of performance
|d1 9.90 7.84 × 10⁴ 5.04 × 10² 9.26 × 101
and quality to other hybrid methods [49,50].
|d2 10.43 4.35 × 100 2.51 × 101 2.57 × 100
DFT provides one-electron wave functions and energies for |d3 10.50 1.99 × 10⁶ 7.09 × 101 5.95 × 101
the defect states and for the valence and conduction bands |d4 10.51 6.16 × 101 4.81 × 101 5.69 × 100
of the crystal. Figure 2 displays the electron density of the |d5 10.59 7.27 × 10⁶ 6.64 × 101 3.03 × 101
eight defect states localized around the thorium nucleus in |d6 10.63 1.12 × 10⁵ 2.20 × 101 1.82 × 100
the crystal unit cell. Our DFT calculations underestimated the |d7 10.68 1.19 × 10⁷ 1.24 × 101 1.56 × 101
band gap of undoped CaF2 by approximately 17% as com- |d8 11.01 2.16 × 10⁵ 2.18 × 101 2.74 × 10²
pared to experimentally measured values. In order to match
053120-4DRIVEN ELECTRONIC BRIDGE PROCESSES VIA DEFECT … PHYSICAL REVIEW A 103, 053120 (2021)
function | by calculating its norm, which is related to the the matrix elements o|QμL |d for μL = E 1, M1, and E 2. The
pseudo wave function via | = ˜ |S| ˜ . Here, S = 1 + corresponding electronic decay rates Asp μL (d → o), presented
i j | p̃i (φi |φ j − φ̃i |φ̃ j ) p̃ j |. We find for the difference in Table I, are calculated by the corresponding Eqs. (2), (3),
| | − ˜ |S| ˜ | < 3%, suggesting that our procedure has (4), where |m, o| Q|g, d| → |o|Q|d|. It is this rate which
only minor numerical errors. also determines which of the defect states is most likely to be
Due to the Hohenberg-Kohn theorem [54], DFT is only excited by our initial excitation, and the favoured multipolar-
valid for the ground state. When an electron is excited into a ity. For most of the defect states, the E 1 decay is dominant,
defect state or beyond, the energies of those states are subject and |d7 has the largest decay rate. Correspondingly, we ex-
to change due to dynamic effects such as the electron-hole pect that |d7 is the easiest level to excite from the ground state
interaction. An estimation of the strength of this effect would |o via VUV laser pumping. In the case of |d2 and |d4 the M1
require a calculation which includes these correlations, such and E 2 contributions are the same order or larger than the E 1
as the GW method [55] (Green’s function G and screened one; however, these states should be seldomly populated by
Coulomb interaction W ), where the exchange correlation po- the initial excitation in favor of the faster rates of other states
tential is replaced by the many-body self energy [56], or other such as |d7 .
approaches of quantum chemistry. Such an investigation will In order to estimate the population of the initial electronic
be reserved for future efforts once more information is known state, i.e., of the defect states, we obtain the steady state
experimentally about the thorium defect states in question. solution of the Bloch equation
The last term in the M1 coupling operator in Eq. (6), sp
ρ̇d = ρoAab E 1 (o → d ) − ρd AE 1 (d → o) + AE 1 (d → o) ,
st
requires the value of the electronic wave functions at the
(8)
position of the 229 Th nucleus. VASP uses a radial grid on
where Aab E1 (o → d ) and A st
E1 (d → o) are the absorption and
exponentially spaced grid points excluding the atom center.
stimulated decay rates for the transition o → d in the presence
To obtain the value of the wave function at the 229 Th nucleus,
of a VUV laser field with intensity Id , following the recipe
the one-electron wave functions are fit using the function
of Eq. (1). The equation above is used in the following to
fit (r) = 0 exp(−rb), where 0 and b are the fit parameters.
derive the population ρdi of individual defect states |di . In
This ansatz is well justified for nonrelativistic s-like orbitals
addition, for a crude approximation, we calculate also av-
at small r values. With increasing radial distance the wave
erage EB rates which consider the complete set of defect
function becomes less dominantly s-like. To account for this
states {|d} as quasidegenerate levels. In this case, the rates
we define a maximum distance to the nucleus for further sp
E 1 (o → {d}), AE 1 ({d} → o) and AE 1 ({d} → o) in Eq. (8) are
Aab st
considerations. We choose this length to be half the distance of
calculated according to Eqs. (2), (3), (4) with the substitution
the first extreme value of the wave function in each radial di-
|m, o| Q|g, {d}| → |o|Q|{d}|, allowing the sum over d to
rection, since only states with l = 0 can produce such points.
run over all defect states di ∈ {|d} and further considering
For each pair of spherical coordinates φ and θ , we construct a
the photon energy ω p factor, in this case di dependent, under
fit with parameters 0 and b. All 0 parameters for these fits
this summation. As a result, Eq. (8) delivers in this case an
in radial direction must converge for the wave function to be
average defect state population, which we then use to obtain
well defined. The final value for (r = 0) is then the mean of
approximate average EB rates.
all 0 values.
The total EB rate achieved in the crystal is given by mul-
tiplication with the population of the initial state ρd , and
III. NUMERICAL RESULTS the number of nuclei in the crystal exposed to the excitation
In the following we present our numerical results for the process N, giving (once more in SI units)
EB rates, investigating both different bridge photon multi- Nρd st (|g, d → |m, o)
polarity channels, as well as the individual contributions of
the nuclear M1 and E 2 decays. For the DFT&S calculation NNd (π c h̄)4
≈ Id Ip sp (|g, d → |m, o), (9)
we have used a unit cell of 66 fluorine atoms, 31 calcium NoEd3 E p3
atoms, and a single thorium atom. Since the wave functions Nρd ab (|g, d → |m, o)
of electrons in the crystal environment are not eigenstates
of either angular momentum or parity, the spatial parts of NNm (π c h̄)4
≈ Id Ip sp (|m, o → |g, d), (10)
the wave functions are only defined by their energy. Wave NgEd3 E p3
functions were calculated on a spherical grid with the number
E3
of points (Nr , Nθ , Nφ ) = (353, 29, 60), considering constant where for simplicity we have assumed Id d
π 2 c2 h̄2
and ρo = 1
spacing in angular components, and the spacing in the radial for the start of the excitation process.
component followed rn = r0 en/κ with r0 = 1.35 × 10⁻⁴ a0 The two laser intensities appear as multiplication factors in
and κ = 31.25. Spherical grids as large as (Nr , Nθ , Nφ ) = the two equations above. We recall that Id refers to the source
(353, 44, 90) were tested but did not improve the accuracy of used to excite the electronic shell to the defect state |o → |d,
the result significantly. The calculated and scaled (via the scis- while Ip is the intensity of the optical source used to drive the
sor operator procedure) defect state energies Ed are presented desired electronic bridge process |g, d → |m, o by coupling
in the second column of Table I. with the virtual state |d → |v. The notation E p is used
All EB schemes under investigation (see Fig. 1) consider as for the photon energy of the optical laser driving the bridge
initial state one of the defect states. The latter can be reached scheme. Furthermore, No and Nm are the degeneracies of the
by VUV excitation. It is therefore useful to start by calculating electronic ground and nuclear isomeric states, respectively.
053120-5BRENDEN S. NICKERSON et al. PHYSICAL REVIEW A 103, 053120 (2021)
FIG. 3. Average spontaneous EB rate Esp1 as a function of the FIG. 4. Average spontaneous EB rate Esp1 as a function of num-
maximum energy of the included states measured with respect to the ber of conduction band states included in the intermediate summation
electronic ground state |o. of |n and |k seen in (5). The solid line is the total rate, while the
dotted line shows the T E 2 contribution alone.
A. Convergence the denominator alone is simply the harmonic series which
As seen in Eq. (5) the final rate requires a summation over cannot result in convergence. As such, the numerator must
all unoccupied intermediate states. The conduction band {|c} also plummet to zero. When considering transitions in a single
offers an infinite set of possible intermediate states, and the atom, it is expected that with increasing energy difference
denominators in Eq. (5) are only slowly suppressing their the wave function overlap will typically decrease, resulting
contributions. Increasing the number of intermediate states in an ever smaller numerator. However, the different shapes
should therefore be continued until convergence is reached. of atomic orbitals would prevent a completely smooth conver-
As an example, we will consider such convergence using the gence of the summation. This is even more so in the crystal
system energies given by DFT&S. All the defect state energies environment. Although the general trend of decreasing wave
(see Table I) lie in this case above the isomer energy. function overlap with increasing transition energy holds, this
We start by calculating the spontaneous E 1 bridge rate is not necessarily smooth. At particular energies, electronic
Esp1 (|g, {d} → |m, o), where the initial electronic state is transitions between states with more localized wave functions
taken as the set of eight spin-degenerate defect states. on neighboring ions may occur. Such transitions can have
The nuclear matrix element in Eq. (5) is calculated us- larger overlap and bring (large) positive or negative contribu-
ing the theoretically predicted values (in Weisskopf units, tions, resulting in a visible upwards or sometimes downwards
W.u.) BW (M1, m → g) = 0.0076 W.u., BW (E 2, m → g) = step in the total rate.
27.04 W.u. [22] for the reduced transition probabilities. The This steplike behavior can be observed at several conduc-
rate Esp1 (|g, {d} → |m, o) is plotted in Fig. 3 as a function of tion band state energies, in particular around 11.7, 12.3, or
the maximum energy of the included states with respect to the 15 eV. The steps become even more obvious in gaps in be-
highest energy valence band, i.e., the electronic ground state tween conduction band energies (as calculated for the gamma
|o. Convergence is achieved with Esp1 (|g, {d} → |m, o) ≈ point). This is the case, for example, for the three conspicuous
2.5 × 10⁻⁸ s−1 and the order of magnitude of the rate is data points around 15 eV in Fig. 3 resulting in an upwards step
stable throughout the entire range. With increasing energy the in the rate, also seen at conduction band number 115 in Fig. 4.
conduction band states become less accurate as electron-hole The three points correspond to three conduction band states
interactions are neglected. However, due to the convergence which are particularly localized around the impurity consist-
within the order of magnitude, we expect this error to be ing of the Th and interstitial F ions. Transitions between
inconsequential for our purposes. these and the set {|d} result in large contributions via matrix
Additionally, Esp1 (|g, {d} → |m, o) is plotted in Fig. 4 as elements of the operators T λK and QμL , i.e., large numerators
a function of number of conduction states included in the sum in the respective summation terms and therefore a visible
over the intermediate states |n and |k in Eq. (5). We use lines increase of the EB rate. Before concluding this part we should
instead of points in the graph to more clearly illustrate the point out once more the limitations in our calculation, which
contribution of the E 2 nuclear decay channel as discussed in is not independent of the chosen crystal cell size. Once states
Sec. III B. Note that each conduction band state |c is spin in the conduction band region are populated, electron-hole
degenerate such that the total number of states accounting interactions not included in the calculation might qualitatively
for degeneracy is twice as much as that shown on the x axis change the interpretation presented above.
of Fig. 4. The maximum number of spin-degenerate states
considered in the set {|c} is 232.
A few comments are appropriate at this point. By examin- B. Dominant nuclear E2 channel
ing Eq. (5) it is clear that, as the energy difference between the For the calculation in Fig. 4 we have considered separately
intermediate states and the initial and final electronic states the two possible multipolarities for the nuclear transition, M1
increases, the contribution to the rate decreases. The sum of and E 2. For radiative decay of the isomeric state, the M1
053120-6DRIVEN ELECTRONIC BRIDGE PROCESSES VIA DEFECT … PHYSICAL REVIEW A 103, 053120 (2021)
FIG. 5. Normalized average driven EB rate ρd Eζ 1 (|g, {d} →
|m, o)/(Id Ip ) [in units of m4 /(W2 s3 )] with ζ = ab/st as a function
of average defect state energy. The solid line is the total EB rate,
whereas the dotted line is the contribution from ME 2 . The blue
vertical line shows the isomer energy considered here, Em = 8.28 eV.
Left (right) of this line, ζ = ab (ζ = st).
component dominates by many orders of magnitude. How- ζ
FIG. 6. Normalized average driven EB rates ρd μL (|g, {d} →
ever, for transitions mediated by the electronic shell, cases |m, o)/(Id Ip ) [in units of m /(W s )], with ζ = ab/st, as a function
4 2 3
have been found where the E 2 component is not negligible of average defect state energy where (a) μL = M1 and (b) μL = E 2.
[34]. For the present calculation, the nuclear E 2 component The blue vertical lines mark the isomer energy Em = 8.28 eV.
turns out to be dominant. The contributions to Esp1 due to
ME 2 (and T E 2 ) are shown in Fig. 4 as a dotted line. Through-
however with rates that are easily negligible in comparison to
out the entire range used to test convergence, the nuclear
transition multipolarity λK = E 2 component made up ≈85% those seen with Eζ 1 .
of the total rate. The difference of approximately 15% is made More precisely, we can consider the rate resulting from a
up for by λK = M1. specific initial defect state. Referring to Table I, |d3 , |d5 and
We now proceed to investigate the nuclear multipole con- |d7 are the most easily populated via E 1 excitation. Thus in
tributions for the two laser-assisted schemes discussed in Fig. 7 we plot the EB rate Eζ 1 (|g, di → |m, o) where each
Fig. 1. To this end we no longer use the fixed DFT&S defect of these states is individually taken as the initial electronic
state energies given in Table I, but allow the average energy of state. Each displayed resonance corresponds to alignment in
the set {|d} to vary in the range 5–11 eV by subtracting the energy of one of the eight spin-degenerate defect states with
same constant from each state energy. Also here we consider the nuclear isomer.
the initial electronic state as the average over the set of eight Figure 8 shows the M1 and E 2 bridge rates for the highest
defect states. We calculate the E 1 EB rate Eζ 1 (|g, {d} → occupied state |d7 . Beyond the overall reduction in magni-
|m, o), with ζ = st (ζ = ab) for the range of average defect tude of the rates, we can also see how the relative widths of the
energy above (below) Em . Figure 5 shows the total driven EB individual resonances are affected by the change in allowed
rates normalized to the intensities of the two lasers Id and Ip electronic transitions. Considering the orders of magnitude
as a function of average defect state energy along with the difference between the EB rates of different bridge photon
separate nuclear E 2 coupling contribution to the rate. Once multipolarity, we conclude that the M1 and E 2 bridge rates
again, throughout the entire resonance energy range the nu- can be safely neglected in this work.
clear E 2 coupling component ME 2 is dominant with 85%.
As such we confirm that the nuclear quadrupole channel is IV. PROSPECTS OF EXPERIMENTAL IMPLEMENTATION
dominant when considering EB processes in 229 Th:CaF2 crys- The crystal environment offers a unique opportunity to
tals. Further understanding of the nuclear processes in the investigate thorium at high densities. This system does,
crystal environment is expected once experiments confirm the however, come with its own set of challenges including
energy and nature of the defect states. sources of background, laser damage, and the crystal’s exciton
spectrum.
C. Comparison of bridge multipolarities Sources of background can be broadly categorized under
the labels of photoluminescence and radioluminescence. Sev-
So far we have only considered bridge rates where the eral of these sources have been studied specifically in Th:CaF2
emitted or absorbed photon multipolarity was E 1, given by in Refs. [11,18,19,21]. Photoluminescence occurs from the
Eζ 1 with ζ = sp, ab, st. Let us now focus on the M1 and E 2 excitation of unintended pathways in the crystal environment.
bridge multipolarities which can be calculated starting from These spurious excitations are the result of a variety of im-
ζ
Eqs. (3) and (4). Figure 6 shows the rates M1 and Eζ 2 for the purities introduced during the growth of the crystals as well
laser-diven EB processes for an initial averaged population of as surface impurities introduced during storage and handling
the defect states {|d}. These rates can be directly compared to [57,58]. Intrinsic to 229 Th is the radioactive component of the
Eζ 1 in Fig. 5. As expected a similar resonant structure is seen, background. 229 Th undergoes α decay where the α particle
053120-7BRENDEN S. NICKERSON et al. PHYSICAL REVIEW A 103, 053120 (2021)
FIG. 8. Normalized (a) μL = M1, (b) μL = E 2 bridge rates
ζ
ρd μL (|g, d7 → |m, o)/(Id Ip ) [in units of m4 /(W2 s3 )] as a function
of initial defect state energy. The blue vertical lines mark the isomer
energy Em = 8.28 eV, with ζ = ab (ζ = st) left (right) thereof.
FIG. 7. Normalized E 1 bridge rates ρd Eζ 1 (|g, di → portant transmission region results from a combination of
|m, o)/(Id Ip ) [in units of m4 /(W2 s3 )] as a function of initial the traditional band gap and the exciton absorption spec-
defect state |di energy considering (a) i = 3, (b) i = 5, (c) i = 7. trum [43,57,61,62]. Pure CaF2 exhibits absorption leading
The blue vertical lines mark the isomer energy Em = 8.28 eV, with to exciton formation in the region above 10 eV (DRIVEN ELECTRONIC BRIDGE PROCESSES VIA DEFECT … PHYSICAL REVIEW A 103, 053120 (2021)
which is 3 orders of magnitude larger than the spontaneous ra-
c c c diative decay rate ≈ 10−4 s−1 [22]. This value was obtained
using an optical laser intensity of Ip = 1 W/(m2 s−1 ). The
d quenching rate also follows equation (1) and is thus linearly
dependent on the intensity of the driving laser. The largest
m v v
variation in the quenching rate is likely to come from the
v
experimental determination of the defect state energies which
d d could place the quenching scheme closer to a resonance as
discussed in earlier sections.
o o o Continuing with this example, let us estimate how the
e e e use of the laser-assisted EB quenching might improve the
g Spontaneous Stimulated Absorption
short-term stability of the solid-state optical clocks. Note that
neither Rabi nor Ramsey interrogation schemes are applicable
FIG. 9. Quenching processes for the deexcitation of 229m Th
|m → |g. The electronic defect states |d can be thereby excited via
to such a clock, because of a huge difference between the short
a spontaneous (or additionally stimulated) EB scheme provided they coherence time between the ground and the isomeric states
lie below the isomer energy. If the defect states lie higher in energy (milliseconds) due to crystal lattice effects [10], and much
than the isomer, absorption of a laser photon is required. Wiggly longer time necessary to bring the nuclei back into the ground
arrows in red depict the EB photons related to the quenching of the state (tens of seconds even with laser-assisted EB deexcita-
isomeric state, either spontaneously emitted or externally pumped tion). Therefore, we consider the scheme based on counting
by a laser for the stimulated or absorption schemes. Photons in blue the spontaneous (or laser-assisted) nuclear decay fluorescence
result from the subsequent spontaneous decay of the defect state photons after illuminating of the quantum discriminator with
|d → |o. the VUV narrow-band laser. The excitation scheme as well
as interrogation protocol considered below follows Ref. [10],
up to replacement of the counting of nuclear fluorescence
A. EB quenching scheme and nuclear clock performance photons by counting of the photons from the decay of the
Once the thorium defect states are characterized, the focus defect state |d → |o.
then shifts to implementation of the available EB schemes Consider first the excitation of the isomer transition in the
and their impact on potential nuclear clock performance. crystal lattice environment under the action of a narrow-band
For nuclear excitation, we have shown in Ref. [26] that us- VUV laser. This step is paramount for any nuclear clock,
ing a VUV lamp [11] with N ≈ 3 photons/(s Hz), a focus whether using trapped Th ions or Th-doped crystals. In the
of f = 0.5 mm2 which corresponds to I = N h̄ωdo/(2π f ) ≈ crystal environment, the 229 Th nuclei are subject to electric
1.6 × 10⁻¹² W/(m2 s−1 ), and a FWHM linewidth of ≈0.5 eV, field gradients causing quadrupole splitting of the order of few
the EB rate is more than 2 orders of magnitude faster than hundred MHz [19,68]. In the absence of any external magnetic
direct photoexcitation. We now turn to inverse EB processes, field, the quadrupole structure is degenerate with respect to the
spontaneous or optical-laser stimulated, which can be used sign of projection of the nuclear angular momentum. To this
to quench the previously excited isomeric population [26]. end we consider stabilization of the laser on the pair of transi-
These processes are illustrated in Fig. 9. With the nucleus tions between the states |g1,2 = |229g Th, I = 5/2, ±3/2 and
initially in the isomeric state, a defect state situated lower |m1,2 = |229m Th, I = 3/2, m = ±1/2. Averaging over pos-
in energy than Em can then be used for a spontaneous EB sible spatial orientations of the electric field gradient, one may
scheme that depletes the isomer. This happens via excitation obtain the equation for the total population ρexc of both the
of the electronic states and population of |d, where the energy excited states |m1 and |m2 as
mismatch is carried away by an emitted photon. In turn, the
EB process can be stimulated by shining a laser with the R 5 R
ρ̇exc = − n3 + ρexc , (11)
frequency of this emitted photon. Should the defect states lie 1 + 2 /γ 2 2 1 + 2 /γ 2
higher in energy than the isomer, a scheme using absorption
of an optical laser photon can be envisaged, as illustrated in where γ is the relaxation rate of the nuclear transition coher-
the left-most panel of Fig. 9. After the excitation of the defect ences, primarily determined by the interaction with fluctuating
states, these may decay radiatively, as depicted in Fig. 9 by the fields inside the crystal. Of particular importance are the
blue wiggled arrow. These isomer decay schemes can have random magnetic fields generated by the fluorine spins sur-
much higher rates than the spontaneous radiative decay of rounding the thorium nucleus [10]. The spontaneous radiative
the isomeric state, and may be used as “managed quenching” decay rate of the isomer is = 10−4 s−1 (calculated using
for preparation of clock states in a solid-state nuclear clock BW (M1, m → g) = 0.0076 W.u. [22]), where n is the refrac-
[10]. Instead of emission of the isomer transition photon, this tive index for the isomer photon, with the factor n3 caused
laser-assisted quenching is accompanied by the photon from by enhancement of the M1 spontaneous decay in refractive
fast subsequent decay of the defect state, which may be used media due to higher density of states of emitted photons [69].
for detection of nuclear deexcitation. We consider here n3 = 4 for simplicity. Furthermore, is the
As an example, we can consider the fixed energy case detuning of the driving VUV laser to the nuclear transition
given by the DFT&S defect state energies. The rate of the energy, and R the excitation rate. The latter can be expressed
laser-assisted absorption quenching for this case was previ- via the matrix elements Vm1 g1 and Vm2 g2 of the interaction
ously estimated as approximately qu ab
= 0.07 s−1 in Ref. [26], Hamiltonian averaged over orientations of the electric field
053120-9BRENDEN S. NICKERSON et al. PHYSICAL REVIEW A 103, 053120 (2021)
gradient as
|Vm1 g1 |2 + |Vm2 g2 |2 2π c2 I0
R= = . (12)
3γ 15 h̄ωm3 γ
Here angular brackets denote averaging over spatial orienta-
tions of the electric field gradient, and I0 is the intensity of the
VUV clock driving radiation with frequency ωm .
A single interrogation cycle consists of four time intervals:
in the first and in the third of them (both have duration θ ) the
sample is illuminated by the narrow-band VUV laser radiation
whose frequency is detuned by δm to the blue and to the red
side from the nominal frequency of the local oscillator respec- √ √
FIG. 10. Ultimate clock fractional instability σy τ = δ f t/ω
tively. The frequency offset f (i.e., the difference between the as a function of excitation rate R for an optimized interrogation
nominal frequency of the local oscillator and the frequency cycle with (black solid curve) and without (red dotted curve) laser-
of the isomer transition) is determined from the difference enhanced quenching during measurement phases. See text for further
in the numbers Nn and Nn+1 of photons counted during the explanations and used parameters.
second and the fourth time intervals (both have duration θ )
respectively.
Mean numbers of photons counted in the second and fourth This expression represents a fundamental lower limit of the
intervals can be expressed as error offset for a single interrogation cycle.
To evaluate the possible improvement of the nuclear
Nn = a( f + δm ) + b( f + δm )Nn−1 , (13) clock performance that may be obtained with the help of
laser-assisted quenching, one may consider the short-term
Nn+1 = a( f − δm ) + b( f − δm )Nn , (14) instability defined as [10]
√
where Nn−1 is a mean number of photons measured in the δf t
σy (τ ) = √ , (20)
fourth time interval of the previous interrogation cycle, and ω τ
where t is the time of single interrogation cycle, and τ is
2Neff ζ n3
a() = 1 − e−qu θ 1 − (1 − e−G()θ ), the total measurement time. In order to reduce σy , one has
5 G() √ √
(15) to minimize δ f t/ω = σy τ by the proper choice of the
ζ intervals θ and θ for the different phases of the interroga-
b() = e−G()θ−qu θ . (16) tion cycle, and the√working point δm . Figure 10 presents an
ζ optimized σyopt (τ ) τ as a function of the excitation rate R
Here, qu is the EB decay rate of the isomer state in the which enters via Eqs. (15), (16), and (17) the expression of
presence of quenching optical laser field, Neff = NTh k
4π
is the δ f . We compare the cases with and without including the
“effective” number of thorium nuclei (k is quantum efficiency optical laser-driven quenching of the isomeric state during the
of the photodetector and is the solid angle covered by this measurement phases. For the latter case we replace the EB
detector; we take Neff = 1012 , as in [10]), and quenching rate qu ζ
in Eqs. (15) and (16) by the spontaneous
5R/2 radiative decay rate of the isomer. The parameters used in the
G() = n3 + . (17) calculations are Neff = 1012 , = 10−4 s−1 , Em = 8.2 eV, and
1 + 2 /γ 2 ζ
qu = 0.07 s−1 . We suppose here that the local oscillator is
For the relaxation rate of the nuclear transition coherences we perfectly stable, and the only detection noise is the shot noise
use the value γ = 2π × 150 Hz [10]. of the detection of the isomer photons. The results in Fig. 10
If the offset f of the local oscillator frequency from the show that for strong enough excitation rates, the short-term
clock transition frequency is small, we can express it as stability may be improved by more than one order of mag-
nitude using the quenching scheme. This makes the future
Nn+1 − Nn − b0 (Nn − Nn−1 ) experimental implementation of the quenching scheme very
f = , (18) desirable. In order to achieve such high rates R/qu ζ
10,
2a1 − b1 (Nn − Nn−1 )
direct laser excitation of the isomer would require intensity
where a( f ± δm ) = a0 ∓ a1 f ; b( f ± δm ) = b0 ± b1 f . I0 = 3.6 W/cm2 via Eq. (12).
Supposing that the numbers of photons Nn+1 (as well as
Nn−1 ) and Nn counted in the fourth and second time interval V. CONCLUSION
are Poissonian random numbers with means (13) and (14), one
may estimate the error δ f of determination of the frequency We have investigated driven EB processes in the
229
offset f as Th:CaF2 solid state environment making use of defect
states in the crystal electronic structure. These states are pre-
a0 (1 − b0 ) 1 + b0 + b20 dicted by DFT within the crystal band gap, not far from the
δf = √ . (19) nuclear isomer energy, and would at first sight be consid-
2[a1 (1 − b0 ) − b1 a0 ] ered a nuisance for laser driving of the nuclear transition.
053120-10DRIVEN ELECTRONIC BRIDGE PROCESSES VIA DEFECT … PHYSICAL REVIEW A 103, 053120 (2021)
Surprisingly, the defect states allow an efficient nuclear ex- more information regarding the crystal environment becomes
citation via EB, up to two orders of magnitude stronger than known experimentally.
photoexcitation. The rate of the EB excitation is dependent
on the characteristics of the electronic defect states as well
ACKNOWLEDGMENTS
as the surrounding intermediate electronic states. Questions
still remain regarding the exact location of these defect states This work is part of the ThoriumNuclearClock project that
in energy, which we hope will be soon pinned down by has received funding from the European Research Council
experiments. Our calculations have mitigated this point by (ERC) under the European Union’s Horizon 2020 Research
discussing a larger resonance region to illuminate how the and Innovation Programme (Grant Agreement No. 856415).
system would change in the case of shifting electronic state G.K. is supported by the European Union’s Horizon 2020
energy. The nuclear transition was shown to proceed upwards Research and Innovation Programme No. 820404 (iqClock
of 85% via E 2 multipolarity, while, for the EB photon emis- project). A.P. gratefully acknowledges support from the
sion or absorption, the E 1 bridge processes were dominant. Deutsche Forschungsgemeinschaft (DFG) in the framework
Quenching of the isomeric state via the inverse bridge process of the Heisenberg Program. The computational results pre-
was shown to significantly impact the potential stability of a sented have been achieved in part using the Vienna Scientific
solid state clock, with an increase by more than one order of Cluster (VSC). The authors also want to thank Peter Mohn for
magnitude. Our theoretical models can be easily adjusted as most valuable discussions.
[1] B. Seiferle, L. von der Wense, P. V. Bilous, I. Amersdorffer, [10] G. A. Kazakov, A. N. Litvinov, V. I. Romanenko,
C. Lemell, F. Libisch, S. Stellmer, T. Schumm, C. E. L. P. Yatsenko, A. V. Romanenko, M. Schreitl, G.
Düllmann, Adriana Pálffy, and P. G. Thirolf, Energy of the Winkler, and T. Schumm, Performance of a 229 Thorium
229
Th nuclear clock transition, Nature (London) 573, 243 solid-state nuclear clock, New J. Phys. 14, 083019
(2019). (2012).
[2] T. Sikorsky, J. Geist, D. Hengstler, S. Kempf, L. Gastaldo, C. [11] S. Stellmer, G. Kazakov, M. Schreitl, H. Kaser, M. Kolbe, and
Enss, C. Mokry, J. Runke, C. E. Düllmann, P. Wobrauschek, K. T. Schumm, Attempt to optically excite the nuclear isomer in
229
Beeks, V. Rosecker, J. H. Sterba, G. A. Kazakov, T. Schumm, Th, Phys. Rev. A 97, 062506 (2018).
and A. Fleischmann, Measurement of the 229 Th Isomer En- [12] C. J. Campbell, A. G. Radnaev, and A. Kuzmich, Wigner Crys-
ergy with a Magnetic Microcalorimeter, Phys. Rev. Lett. 125, tals of 229 Th for Optical Excitation of the Nuclear Isomer, Phys.
142503 (2020). Rev. Lett. 106, 223001 (2011).
[3] L. von der Wense, B. Seiferle, M. Laatiaoui, J. B. Neumayr, [13] R. C. Thompson, Ion Coulomb crystals, Contemp. Phys. 56, 63
H. J. Maier, H. F. Wirth, C. Mokry, J. Runke, K. Eberhardt, (2015).
C. E. Düllmann, N. G. Trautmann, and P. G. Thirolf, Direct [14] E. Capelli, O. Benes, P. E. Raison, M. Beilmann, C. Künzel,
detection of the 229 Th nuclear clock transition, Nature (London) and R. J. M. Konings, Thermodynamic Investigation of the
533, 47 (2016). CaF2 -ThF4 and the LiF-CaF2 -ThF4 Systems, J. Chem. Eng.
[4] E. Peik and C. Tamm, Nuclear laser spectroscopy of the 3.5 eV Data 60, 3166 (2015).
transition in Th-229, Europhys. Lett. 61, 181 (2003). [15] W. M. Itano, J. C. Bergquist, J. J. Bollinger, J. M. Gilligan,
[5] E. Peik, T. Schumm, M. Safronova, A. Pálffy, J. Weitenberg, D. J. Heinzen, F. L. Moore, M. G. Raizen, and D. J. Wineland,
and P. Thirolf, Nuclear clocks for testing fundamental physics, Quantum projection noise: Population fluctuations in two-level
Quantum Sci. Technol. 6, 034002 (2021). systems, Phys. Rev. A 47, 3554 (1993).
[6] A. Yamaguchi et al., Energy of the 229 Th Nuclear Clock Isomer [16] J. Jeet, C. Schneider, S. T. Sullivan, W. G. Rellergert, S.
Determined by Absolute γ -ray Energy Difference, Phys. Rev. Mirzadeh, A. Cassanho, H. P. Jenssen, E. V. Tkalya, and E. R.
Lett. 123, 222501 (2019). Hudson, Results of a Direct Search Using Synchrotron Radi-
[7] B. Seiferle, L. von der Wense, and P. G. Thirolf, Lifetime ation for the Low-Energy 229 Th Nuclear Isomeric Transition,
Measurement of the 229 Th Nuclear Isomer, Phys. Rev. Lett. 118, Phys. Rev. Lett. 114, 253001 (2015).
042501 (2017). [17] W. G. Rellergert, S. T. Sullivan, D. DeMille, R. R. Greco,
[8] J. Thielking, M. V. Okhapkin, P. Glowacki, D. M. Meier, L. von M. P. Hehlen, R. A. Jackson, J. R. Torgerson, and E. R.
der Wense, B. Seiferle, C. E. Düllmann, P. G. Thirolf, and P. Hudson, Progress towards fabrication of 229 Th-doped high en-
Peik, Laser spectroscopic characterization of the nuclear-clock ergy band-gap crystals for use as a solid-state optical frequency
isomer 229m Th, Nature (London) 556, 321 (2018). reference, IOP Conf. Series: Mater. Sci. Eng. 15, 012005
[9] T. Masuda, A. Yoshimi, A. Fujieda, H. Fujimoto, H. Haba, (2019).
H. Hara, T. Hiraki, H. Kaino, Y. Kasamatsu, S. Kitao, K. [18] S. Stellmer, M. Schreitl, and T. Schumm, Radioluminescence
Konashi, Y. Miyamoto, K. Okai, S. Okubo, N. Sasao, M. and photoluminescence of Th:CaF2 crystals, Sci. Rep. 5, 15580
Seto, T. Schumm, Y. Shigekawa, K. Suzuki, S. Stellmer, K. (2015).
Tamasaku, S. Uetake, M. Watanabe, T. Watanabe, Y. Yasuda, [19] P. Dessovic, P. Mohn, R. A. Jackson, G. Winkler, M. Schreitl, G.
A. Yamaguchi, Y. Yoda, T. Yokokita, M. Yoshimura, and K. Kazakov, and T. Schumm, 229 Thorium-doped calcium fluoride
Yoshimura, X-ray pumping of the 229 Th nuclear clock isomer, for nuclear laser spectroscopy, J. Phys.: Condens. Matter 26,
Nature (London) 573, 238 (2019). 105402 (2014).
053120-11You can also read