Does the threat of being blacklisted change behavior? - Regression discontinuity evidence from the EU's tax haven listing process
←
→
Page content transcription
If your browser does not render page correctly, please read the page content below
GLOBAL ECONOMY & DEVELOPMENT
                            WORKING PAPER 139 | June 2020

Does the threat of being
blacklisted change behavior?
Regression discontinuity evidence from the EU’s tax
haven listing process

Matthew Collin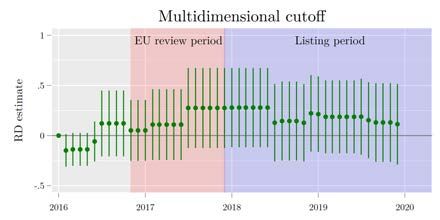
Does the threat of being blacklisted change behavior?
  Regression discontinuity evidence from the EU’s tax haven
                                        listing process
                                         Matthew Collin
                                      Brookings Institution∗†

                                              June 2020

                                               Abstract
          In late 2016, the EU Commission began a detailed review of over 80 non-European
      jurisdictions to determine how compliant they were with international standards
      around tax transparency, fair taxation and adherence to the OECD’s Base Erosion
      Profit Shifting (BEPS) minimum standards. The EU subsequently published both a
      ‘grey’ and ‘black’ list of jurisdictions to promote their cooperation with these stan-
      dards. I investigate the impact that this process has had on several measures of
      international tax governance by employing a regression discontinuity design derived
      from the unique process the EU used to select jurisdictions for review. I find that
      although jurisdictions selected into review were substantially more likely to be grey
      or blacklisted, detectable improvements in tax governance are largely limited to (i)
      increases in transparency around the presence and removal of harmful tax regimes
      and (ii) increases in the effective implementation of exchange-of-information (EOIR)
      agreements. However, countries selected into the EU process were significantly more
      likely to join the Inclusive Framework, a forum dedicated to implementing the BEPS
      minimum standards and deliberating over changes to international tax rules. Back-
      of-the-envelope estimates suggest that the Inclusive Framework is roughly 15% larger
      thanks to the EU review process, although its composition in terms of representation
      by developing countries or jurisdictions traditionally thought of as tax havens remains
      roughly the same.

  ∗
     Email: mcollin@brookings.edu. I would like to thank Carol Graham, Homi Kharas, Jan Loeprick
and Marijn Verhoeven for helpful comments on this draft. All errors are my own. This publication was
made possible by the David M. Rubenstein fellowship at the Brookings Institution. Brookings recognizes
that the value it provides is in its absolute commitment to quality, independence, and impact. Activities
supported by its donors reflect this commitment and the analysis and recommendations are not determined
or influenced by any donation. This work initially began at the World Bank’s Global Tax team while I
was an Economist there, and would not have been possible with that team’s support.
   †
     The Brookings Institution is a nonprofit organization devoted to independent research and policy
solutions. Its mission is to conduct high-quality, independent research and, based on that research, to
provide innovative, practical recommendations for policymakers and the public. The conclusions and
recommendations of any Brookings publication are solely those of its author(s), and do not reflect the
views of the Institution, its management, or its other scholars.

                                                   1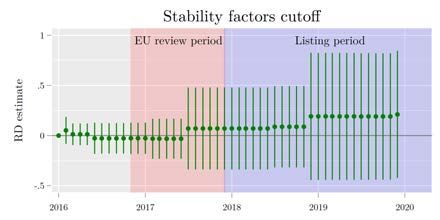
1 Introduction
There has been a rapid shift in global tax governance in the past decade. This has
been prompted by a recognition that there are two significant externalities driving the
movement of financial assets and profits to offshore financial centers (OFCs). The first
is financial secrecy, provided by offshore jurisdictions to clients who are able to obscure
their ownership and potentially avoid taxation. Studies estimate the amount of wealth
being held in offshore tax havens to be approximately 8% of all household wealth or 10%
of global GDP, a significant portion of which goes unreported (Zucman 2013; Johannesen
et al. 2018). The second externality is a set of corporate tax policies - a combination
of rates, loopholes and lack of transparency - that create incentives for multinational
enterprises (MNEs) to shift their profits away from high tax jurisdictions to lower tax
ones where there is little economic activity of substance. In a recent study, Tørsløv, Wier,
and Zucman (2019) estimate that up to 40% of global MNE profits are shifted to tax
havens.1
    To collectively deal with these externalities, jurisdictions across the globe are in the
process of committing to two separate OECD frameworks aimed at reducing interna-
tional tax evasion and avoidance. The first of these is the OECD/G20 Base Erosion and
Profit Shifting (BEPS) initiative, which is being taken forward by the international forum
known as the Inclusive Framework (IF) on BEPS. The goal of the IF is to promote specific
actions and standards that will help countries tackle tax planning efforts by multination-
als which lead to an erosion of the corporate tax base. At the very least, members of
the IF are expected to adopt four minimum standards, built around reducing harmful
tax practices, combating tax treaty abuse, handling treaty disputes and arbitration and
finally documenting transfer pricing. The last of these include country-by-country report-
ing (CbCr), the requirement for parent companies of multinationals to disclose significant
details about their operations, profits and tax payments, which will then be exchanged
between participating tax authorities. It should be noted that the BEPS Minimum Stan-
dards are only part of the entire package of reforms promoted by the OECD - and by
themselves do not represent a sufficient set of policies for eliminating cross-border tax
externalities. As of April 2020, 137 jurisdictions have joined the Inclusive Framework as
members, committing to adopting its standards.
    The second initiative is the adoption of the OECD’s Common Reporting Standard
(CRS) for the Automatic Exchange of Information (AEOI). Jurisdictions that adopt this
standard will require financial institutions to report account information for non-resident
taxpayers and for that information to be automatically exchanged between tax authorities
in participating jurisdictions. Recent studies suggest that bilateral AEOI exchanges lead
to a shift of offshore assets out of tax havens, although it is unclear how much of this
   1
     The term tax haven is occasionally a contentious one, but they are generally thought of as jurisdictions
that employ financial secrecy, low corporate tax rates, and/or preferential tax regimes to attract financial
assets and investments from foreign entities and persons.

                                                     2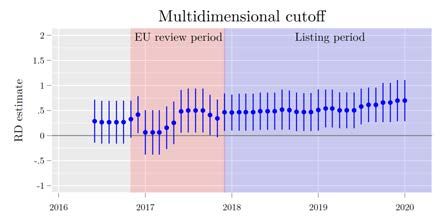
presumably untaxed wealth is repatriated (Beer, Coelho, and Leduc 2019; Casi, Spengel,
and Stage 2019; O’Reilly, Ramirez, and Stemmer 2019; Menkhoff and Miethe 2019).
Approximately 130 jurisdictions have committed to exchanging under CRS, over a third of
which which began their first exchanges in 2017, another third in 2018 and the remaining
third between 2019 and 2023. The CRS framework is seen as an improvement from
an older system of information exchange, known as exchange-of-information on request
(EOIR), where tax authorities must make active requests for information on specific
taxpayers. Despite this, there are still efforts to ensure that EOIR is being adequately
implemented, as jurisdictions are reviewed through the Global Forum on Transparency
and Exchange of Information for Tax Purpose.
   In late 2016, the EU Commission began a careful review of 80-90 non-European juris-
dictions to determine how compliant they were with international standards around tax
transparency, fair taxation and adherence to the OECD’s Base Erosion Profit Shifting
(BEPS) minimum standards. After the review and some dialogue with non-compliant
countries, the EU released a ‘grey’ list of jurisdictions who were non-compliant with
these standards, but had committed to make improvements, as well as a ‘black’ list of
jurisdictions who were non-cooperative, who were to be subject to a number of EU coun-
termeasures.
   In this paper, I investigate the impact that this process has had on the standards that
the EU intended to enforce. I rely on the process the EU used to select countries for
consideration in its listing process to compare jurisdictions who scored just high enough
to be considered with those that did not. Using a regression discontinuity specification,
I find that countries that were selected into the EU’s review process were substantially
more likely to be grey or blacklisted, but that there is mixed evidence that, to date, the
process has affected policy adoption. On average, index measures of global tax governance,
based off of the EU’s own goals, do not show large improvements. The main exception
is for Fair Taxation, where jurisdictions selected by the EU saw a large increase in the
probability that their tax regimes had been inspected by the EU or the OECD and, as
of the time of writing, that they no longer had any harmful regimes present. There is
weak evidence that the EU review process increased the the number of BEPS minimum
standards adopted. There is also some evidence that the EU process led to a sharp increase
in the probability that the Global Forum rated a jurisdiction as “largely compliant” or
better on its implementation of EOIR.
   The most robust and striking result from the analysis is the fact that countries selected
into the process were substantially more likely to join the Inclusive Framework, thus
committing themselves to implementing the BEPS minimum standards. This means that
even if the EU review process has not improved international tax governance by much in
the medium term, it might do so in the long term as these commitments become more
binding. It also has implications for the future of deliberation over new international tax
rules, as it shows that unilateral involvement of regional unions can influence participation
in international standard setting. Using a difference-in-difference strategy, I show that,

                                             3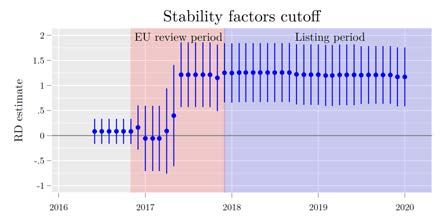
on average, the EU review and listing process increased the probability of IF membership
by approximately 30% for selected jurisdictions, translating into an increase in total IF
membership by around 15%. While the composition of the IF is not radically different due
to the EU’s involvement, its impact on the participation of developing countries might
have been stronger had it set lower thresholds for the review, or had it not excluded least
developed countries (LDCs) from the review process.
   The other result worth emphasizing is that the EU review process appears to have had
positive spillovers on the probability a jurisdiction was reviewed by the OECD Forum on
Harmful Tax Practices. This may have been driven purely by the fact that IF members
are subject to these reviews, but indicates how unilateral efforts by one entity can have
spillovers onto others. While I am unable to identify the net impact the EU review and
listing process has had on the total number of harmful tax regimes that have been struck
down, the results in this paper are consistent with the EU review process having a sizable
impact.
   This paper makes several contributions. First, it is the first rigorous test of the impact
of the EU’s efforts to improve tax governance worldwide. While it is easy to observe how
countries included in the listing process have improved, we would not normally know
how these countries would have improved without the EU’s intervention, particularly
because there is ongoing pressure from a multitude of institutions (e.g. the OECD, US
Government, IMF, World Bank) to improve tax governance.
   Second, this paper adds to a nascent empirical literature on the effect of listing ex-
ercises on institutional behavior and outcomes. For example, Morse (2019) shows that
those added to the Financial Action Task Force (FATF)’s ‘greylist’ of countries that lack
compliance with international anti-money laundering (AML) standards are significantly
more likely to criminalize money laundering. Kelley and Simmons (2015) find that coun-
tries listed on the US State Department’s annual Trafficking in Person’s report are more
likely to subsequently criminalize human trafficking. These empirical studies are backed
up with case study evidence that jurisdictions are nudged into compliance by the threat of
blacklisting (in both the space of AML/CFT and in tax transparency), even when there
are no explicit sanctions (Sharman 2009).
   The rest of the paper proceeds as follows: Section 2 discusses the recent history of
the EU review and listing process. Section 3 discusses the empirical approach I take in
this paper, Section 4 presents the main regression discontinuity results as well as results
exploiting changes across time. Section 5 discusses the implications these results have for
international tax governance as well as reasons the EU blacklisting process may not have
a powerful effect on state behavior. I conclude the paper with Section 6.

2 The EU review and listing process
The EU made its first collective effort to enforce international tax standards in mid-2015,
when it published a list of non-cooperative tax havens as part of its “Action Plan for Fair

                                             4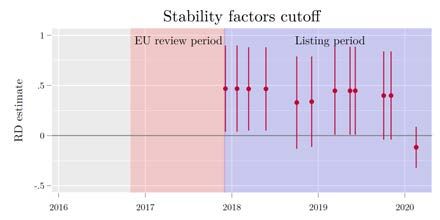
and Efficient Corporate Taxation in the EU.”2 The list was presented as an amalgamation
of the lists maintained by each of the EU member states: if a jurisdiction was present on
ten or more lists of member states, it was included in the published annex of the Action
Plan.
         The publication of the consolidated list led to a substantial amount of furor among
the included jurisdictions, many pointing out that because each EU member state used
a different set of criteria for identifying tax havens, the composition of the final list was
arbitrary (The Economist 2015). This led to both backpedalling and an argument over
semantics, with the EU responding by insisting the list it published was not actually
intended to be seen as a list, and the OECD noting that it was “unfortunate that the
exercise has looked like the establishment of a list.”3 Several countries were subsequently
removed from the list in October 2015 to reflect changes in underlying member state
blacklisting.
         The EU’s 2015 list was quietly shuttered as the institution opted for a more systematic
approach for creating a pan-European list.4 As part of its efforts, the EU released a
scoreboard of 160 non-European countries in September 2016.5 The scoreboard, which is
discussed in more detail in Section 3.2, was devised to determine which jurisdictions were
at the greatest risk of facilitating tax avoidance, ranked them according to three criteria:
(i) the strength of their economic ties to the EU, (ii) their overall financial activity,
and (iii) a series of ‘stability factors’ including corruption and regulatory quality. Those
jurisdictions which ranked high enough all three criteria were selected for further scrutiny,
although some, such as those designated by the UN as Least Developed Countries, were
excluded from the review process.
         The EU performed a very basic assessment for the eighty-one selected jurisdictions to
determine whether there were risks with respect to transparency, preferential tax regimes
or low tax rates. Following this, the EU’s Code of Conduct Group for Business Taxation
(CCG) devised a set of criteria to screen jurisdictions for their adherence to international
standards on tax transparency, fair taxation and anti-BEPS measures.6 This screening
took place during the first half of 2017, after which the CCG then communicated directly
with jurisdictions found to have deficiencies, asking for commitments to improve their
tax governance by the end of the following year. In early December 2017, jurisdictions
which were not able to make a credible commitment were added to EU’s first published
“non-cooperative jurisdictions for tax purpose,” referred from hereon as the blacklist. In
addition to this, in an annex, the EU also publishes a list of the jurisdictions it is working
with to improve their adherence to international standards, which I will call the EU’s
     2
         https://ec.europa.eu/taxation_customs/business/company-tax/action-plan-corporate-taxation_
en
     3
         https://www.oecd.org/tax/transparency/eucommissionsannouncementonnon-cooperativejurisdictionslettertoglob
htm
     4
     https://data.consilium.europa.eu/doc/document/ST-9452-2016-INIT/en/pdf
     5
     https://ec.europa.eu/taxation_customs/sites/taxation/files/2016-09-15_
scoreboard-indicators.pdf
   6
     These criteria are discussed in detail in Table A5 in the Online Appendix and below in Section 3.4.

                                                   5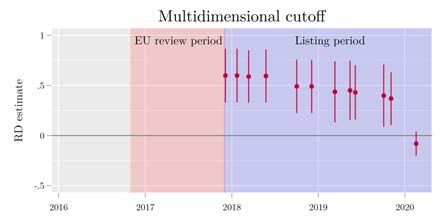
Figure 1: Evolution of the EU greylist and blacklist over time

Note: Figure shows number of jurisdictions currently on the EU’s list of non-cooperative jurisdictions
for tax purposes (the blacklist) and those listed in Annex II under “state of play of the cooperation with
the EU with respect to commitments taken to implement tax good governance principles” (the greylist).

‘grey list.’
    Of the jurisdictions that were originally selected for the entire review and screening
process, roughly 50% were included in the greylist in its first release and a further 15%
were added to the blacklist. Figure 1 displays the number of countries listed on black and
grey lists from December 2017 until February 2020. Over the course of 2018, the greylist
swelled to over 60 jurisdictions as many jurisdictions committed to improving various tax
governance outcomes, including several jurisdictions that successfully moved off of the
black list. Many of these commitments were due in the 2019 calendar year, which led to a
large reduction in jurisdictions on the greylist, some of whom moved to the blacklist due
to continued noncompliance.
    The EU CCD continues to review and update that list up until today. If greylisted
jurisdictions take too long in this implementation, they face the risk of being added to the
blacklist. Blacklisted jurisdictions are those who are considered to be both non-compliant
and non-cooperative. For these countries a number of EU sanctions will apply, either
now or at some unspecified point in the future: (i) funding from a variety of EU Funding
Instruments cannot be channeled through entities in listed countries, (ii) tax schemes or
multinational activities routed through listed jurisdictions will be subject to additional
reporting requirements by EU tax authorities, and (iii) member states have committed to
including other specific sanctions, such as increased monitoring and audit risks or special
withholding rates, although it remains to be seen how many of these will be implemented.
    In addition to these, at the time of writing several European countries have also an-

                                                    6
nounced that companies with subsidiaries based in blacklisted countries will not be eligible
for government aid being provided in response to the ongoing COVID-19 pandemic.
3 Data and empirical approach
The main approach I will be using is a regression-discontinuity framework. In this section
I will discuss how that framework is specified, what running variables I will be using for
the estimation, and the tax governance outcomes I will be considering.
3.1 RD framework
The main problem faced in estimating the impact of the review and blacklisting process is
non-random selection into both. We know that the EU chose its three criteria for selection
based on the assumption that they were positive correlated with a jurisdiction’s likelihood
of facilitating tax avoidance that would affect EU member states. We also know that the
final choice of the grey and black lists was determined endogenously by jurisdictions
responding to the EU’s pressure to reform. So a simple comparison of selected countries
versus those that were not selected, or listed versus unlisted countries, is likely to lead to
biased estimates of the impact of the EU selection process.
However, I can take advantage of the fact that the EU’s selection process incorporated
arbitrary cutoffs to determine eligibility, leading jurisdictions with similar scores to face
very different outcomes solely because they fell on opposite sides of the eligibility thresh-
old. In a regression discontinuity framework, the premise is that, absent any impact of
the EU selection process, the relationship between a jurisdiction’s score on the criteria
and its likelihood of adopting new tax transparency standards would be continuous as it
crosses that threshold.
Consider the following empirical specification. Let Yi be the tax governance outcome
of interest for jurisdiction i. We are interested in the impact that selection into the EU
review process, Si has on subsequent outcomes Yi . Consider the following reduced form
equation, where:
Yi = α1 [Di > 0] + α2 f (Di ) + α3 f (Di ) × [Di > 0] + Xi β + ϵi (1)
Where Di indicates the jurisdiction’s distance to the cutoff used by the EU to deter-
mine selection into the review process. f (Di ) is a function of that distance, allowed to
vary in slope on either side of the cutoff. In the next subsection I will discuss how that
distance measure is constructed. Xi is a vector of jurisdiction characteristics included
as controls. In this specification, α1 estimates the effect of crossing the EU selection
threshold has on the tax governance outcome of interest.
However, not every jurisdiction that passed the threshold was eventually selected for
review. So in addition to the reduced form specification above, we can use a ‘fuzzy’
7regression discontinuity approach, where first we estimate the impact that crossing the
threshold has on selection Si :
Si = α1 [Di > 0] + α2 f (Di ) + α3 f (Di ) × [Di > 0] + Xi β + ϵi (2)
and then use the selection outcome from (2) as an instrument for selection in the
below equation:
Yi = γ1 Si + γ2 f (Di ) + γ3 f (Di ) × Si + Xi β + ϵi (3)
For estimation of equations (1) and (3), I will proceed as follows: I estimate treatment
effects using local linear estimation, using bandwidth selection and bias-correction meth-
ods outlined in Calonico, Cattaneo, and Titiunik (2014), Calonico, Cattaneo, and Farrell
(2018) and Calonico, Cattaneo, Farrell, and Titiunik (2019). I do this separately for the
reduced form impact of crossing the selection threshold and in the fuzzy RD framework,
where the selection indicator in equation (2) is used as an instrument for Si in equation
(3).
I also, for completeness, calculate results using global quadratic and cubic functions,
7 as well as a simple OLS regression where different orders of each EU selection indicator
are into the equation separately (rather than aggregated as a single running variable).
These results are presented in Table A6 in the Online Appendix.
Next, I’ll discuss the EU scoreboard data in detail as well as how I will construct the
running variable Di , given the multidimensional nature of the data.
3.2 The EU scoreboard data
As discussed above, the EU ranked jurisdictions according to three criteria: their strength
of each jurisdiction’s economic ties with the EU, their level of financial activity, and the
degree to which each is stable enough to be an attractive destination for funds. Each
indicator was constructed using the following data:
1. Strength of ties: constructed using measures of the jurisdictions total trade with
the EU, trade in services, both inward and outward FDI flows and the presence of
foreign affiliates of EU-based companies
2. Financial activity: inward and outward dividends, interest payments, royalties,
and FDI stocks
3. Stability factors: control of corruption and regulatory quality, as measured by
the World Bank’s Worldwide Governance Indicators
7
As noted in Gelman and Imbens (2019), higher order polynomials, particularly when the polynomial
is global (defined over the entire sample, as described in the equation above) can lead to noisy estimates
and bias.
8For each indicator, jurisdictions were given a rank which represented their highest rank
across all measures used.8 Then within each indicator, these ranks were transformed into
percentage scores, so that a jurisdiction that is - for example - ranked 8 out of 130 is
assigned the percentage of score 8
130 × 100 = 6.15.
The Commission then set cutoffs (60,40,70) for each indicator which reflected the
priority it placed on each dimension. Jurisdictions with a percentage score lower than
the cutoff in all three indicators were selected for further investigation.9
There were several exceptions to the EU selection process. Jurisdictions designated as
Least Developed Countries (LDCs) by the United Nations were excluded on the grounds
that they faced constraints in improving their tax governance, although they were still
ranked. Several jurisdictions which already had a transparency agreement with the EU
in place were also excluded.10 Finally, and somewhat contentiously, the European Union
excluded its own member states from the scoring and listing process.
3.3 Running variable(s)
To construct a running variable, I take two main approaches. The first is to construct
a multidimensional running variable out of three percentage scores the EU used. The
second is to use a percentage score that is the most binding for countries. I explain each
of these in turn below:
(i) Multidimensional (MD) running variable
Normally, a regression discontinuity framework relies on a single running variable to
determine assignment to treatment. In the case of the EU review process, I am faced
with three, all of which need to exceed a specific threshold. To simplify the analysis,
I collapse the three indicators into a single running variable, D, where D indicates the
distance in percentile points the jurisdiction is from being eligible for review.
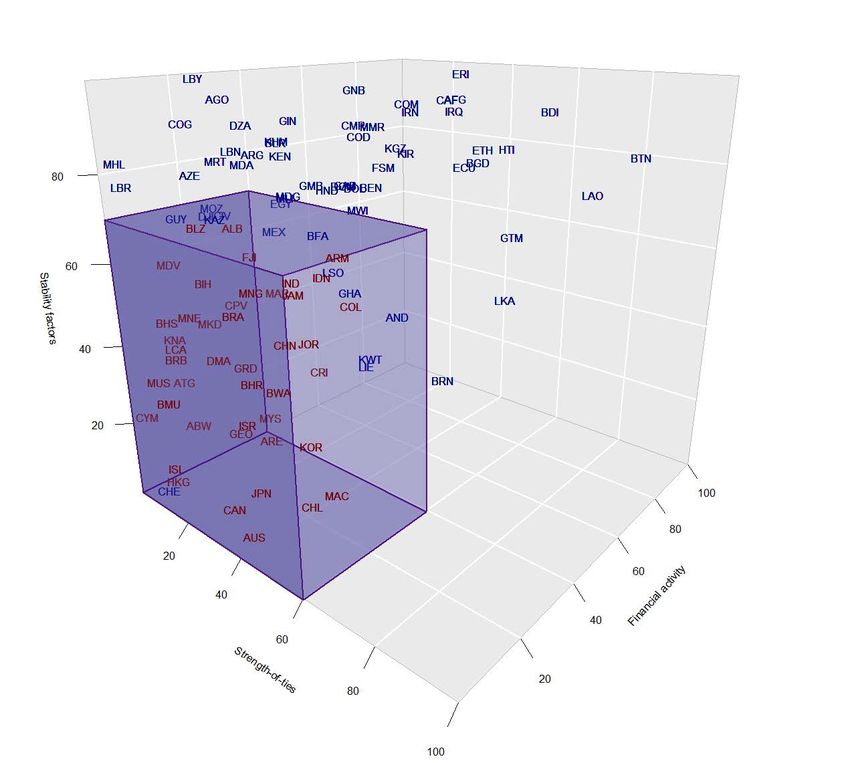
Consider Figure 2, which graphs each jurisdiction by its three percentage scores in
three dimensional space. The purple cuboid represents the “selection space,” within which
a jurisdiction is eligible for review by the European Union. For example, a jurisdiction
with a percentage score of (59,39,69) is just inside this space where a jurisdiction with a
percentage score of (61,41,71) is just outside.
To construct a univariate running variable, I calculate the distance from each juris-
diction to the boundaries of this selection space. There are two ways to do this. The
traditional way is to calculate the minimum Euclidean distance to the selection space, so
that for a jurisdiction with non-missing values of each indicator:
8
The entire methodology is described here: https://ec.europa.eu/taxation_customs/sites/
taxation/files/2016-09-15_scoreboard-methodology_en.pdf
9
If data on only one or two indicators were available, jurisdictions were selected if they passed the
cutoff for just those indicators.
10
Switzerland, Liechtenstein, Andorra, Monaco and San Marino.
9√
D = − (X − 60)2 + (Y − 40)2 + (Z − 70)2
When the jurisdiction is above all three thresholds (X < 60, Y < 40, Z < 70). If
it is below one or two thresholds, the distance is calculated on any remaining unmet
thresholds. If a jurisdiction has passed below all three thresholds, the relevant distance is
the closest threshold (since a percentage score above a single threshold makes a jurisdiction
ineligible).
D = −min[X − 60, Y − 40, Z − 70]
Note I have defined D so it takes on positive values when a jurisdiction is below all
three thresholds (and thus eligible for selection) and negative values when it is above at
least one threshold.
In practice, the Euclidean distance may not be the best measure of changes in the
three dimensions. Consider Bhutan, which has scores of approximately (91,69,85). Its
Euclidean distance to the boundary is 45 in percentage score units. However, practically,
to qualify for selection into the EU review process, Bhutan would have to improve on
all three of its scores until all three fell within their respective cutoffs: (91-60,69-40,85-
70) = (31,31,5), the sum of which is 67 percentage points. So the actual change in the
underlying factors is greater than what is suggested by the Euclidean distance.
So rather than use the Euclidean distance, I construct a multidimensional running
variable which captures the minimum distance across all dimensions a country must travel
in order to cross the selection boundary, so that when a jurisdiction is outside the selection
boundary:
D = −1[(X − 60)1{X > 60} + (Y − 40)1{Y > 40} + (Z − 70)1{Z > 70}]
Where 1{X > 60} is an indicator = 1 if X is above 60, and so on. The distance
for jurisdictions below the selection boundary remains the same. As another example:
a country with percentiles scores of (50,50,80) must move by (0,-10,-10) to reach the
boundary, so faces a distance of -20 (rather than -14.4, the Euclidean distance). By
contrast, a country with percentile scores of (20,20,20) must only move by (-20,0,0) to
reach the nearest boundary, which is the same as the Euclidean distance. In the Online
Appendix I also present results using the Euclidean distance, and find that that it makes
no qualitative difference to the headline results.11
Centering the running variable around a three-dimensional cutoff an equivalent pro-
cedure to what Wong, Steiner, and Cook (2013) describe as the ‘centering’ procedure for
collapsing a multidimensional RD into a single running variable RD. The main limitation
to this approach is that it estimates a frontier average treatment effect (FATE) which is
11
Table A6
10Figure 2: 3D scatterplot of each jurisdiction’s score on the three EU indica-
tors, relative to the set of scores necessary to qualify for selection into the
review process
Note: Jurisdictions are mapped in 3D space according to the percentage score assigned by European
Union. The purple cuboid indicates the point at which the jurisdiction passes each of the three
thresholds for selection into the EU review process (the selection space), which is 60 for the strength of
ties measure, 40 for financial activity and 70 for stability factors. Jurisdictions highlighted in red were
selected. The multidimensional running variable is the minimum distance in percentage score values
required to travel to the nearest side of the selection space, moving one dimension at a time.
11the weighted average of the univariate treatment effects defined over each indicator’s fron-
tier (e.g. the treatment effect around crossing each threshold separately). The weights
of the FATE are not scale invariant: for instance, re-scaling X by a positive number will
decrease the weight placed on the univariate treatment effect for X. This makes the choice
of scale for each indicator important, as it determines each indicator’s relative contribu-
tion to the estimated treatment effect. For the analysis here, I take the EU’s construction
of its indicators and its assignment process as given, keeping each indicator defined in
percentiles, and assuming the indicators are comparable in percentile space.
This is a strong assumption, as it assumes that moving up one percentage score in,
for example, stability factors is equivalent to moving up one percentage score in financial
activity.
(ii) Stability factors (SF) running variable
As both a robustness check, and to investigate possible heterogeneity in impact of the
EU’s review process, I also estimate treatment effects using a univariate running variable
defined solely over the ‘stability factors’ indicator. As shown in Table A1 in the Online
Appendix, out of the three indicators, this one has the greatest predictive power in a
RD setting, due to the fact that most jurisdictions around the stability factors threshold
have already exceeded the other two thresholds. It is also the running variable for which
jurisdictions appear the most balanced on pre-treatment observable characteristics, giving
it one advantage over the multidimensional running variable.
3.4 Tax governance outcomes
In choosing tax governance outcomes to consider in the analysis, I rely in part on those
set out by the EU Council as criteria on which listed jurisdictions would be assessed.12
These are listed in detail in Table A5 in the Online Appendix, but can be broadly grouped
into three categories: (1) tax transparency, (2) fair taxation and (3) anti-BEPS measures.
For each of these categories, I have picked the most proximate, measurable outcomes
relevant to the EU. One challenge is that not all goals are perfectly measured. For exam-
ple, under its “fair taxation” criteria, the EU requires that a jurisdiction has no harmful
tax regimes in place. Both the EU’s COCG and the OECD’s Forum on Harmful Tax Prac-
tices (FHTP) conduct reviews of preferential regimes across many jurisdictions. Harmful
regimes are detected through these reviews and jurisdictions typically (but not always,
hence the blacklist) revise or abolish them so they are no longer considered harmful.
However, we only observe harmful regimes in jurisdictions that the COCG or the FHTP
choose to review. The former is driven primarily by which jurisdictions were selected for
review by the COCG, while the latter is mainly driven by jurisdictions that have signed
up to the Inclusive Framework. This means that harmful regimes may still exist in juris-
dictions that have not received attention from either body. Without an objective measure
12
https://data.consilium.europa.eu/doc/document/ST-14166-2016-INIT/en/pdf
12for every jurisdiction, it is impossible to know the true effect of the EU on harmful tax
regimes.
In lieu of this, I have created an outcome which is in the spirit of the EU objective:
a jurisdiction is considered ‘not harmful’ if it has been reviewed by either the COCG
or the FHTP and, as of the latest COCG and FHTP reports, it has no active harmful
regimes or has set a date for an upcoming rollback.13 Thus, if a jurisdiction has not been
reviewed, or it has been reviewed, found to have harmful regimes and has not committed
to abolishing them or rendering them benign, it will not be counted as a success in
this outcome measure. In One of the successes that the EU takes credit for is nudging
jurisdictions to eliminate harmful tax systems (European Commission 2020). In Section
5.1 I investigate these impacts further, although I am not able to put precise estimates
on the number of harmful tax regimes eliminated as a result of the process.
Table 1 displays the full list of observable outcomes that I will use which either directly
measure the EU’s criteria or reflect a reform process that a jurisdiction must follow in
order to eventually comply with the EU’s criteria. Data on each of these outcomes was
obtained directly from OECD online sources as of April, 2020. One difficulty with OECD
reporting on tax governance reforms is a lack of panel data: in many situations it is only
possible to observe the current state of affairs rather than precisely when a jurisdiction
enacted a certain reform. For my analysis of how the effects of the EU listing process have
changed over time, when possible I have used the Internet Archive’s Wayback Machine14
to retrieve earlier instances of public data.
While I will report results for each of these outcome groups separately, to reduce
concerns over multiple hypothesis testing, I construct indices for each outcome group.
With the sole exception of the proportion of EU member states covered by an automatic
exchange of information agreement (A.2), each of these outcomes is binary, so I construct
the index as a simple mean of each outcome measure across the group. So, for example,
if a jurisdiction has signed up to country-by-country reporting (C.1) but not yet adopted
the MLI position (C.2) or published a MAP profile (C.3), its Anti-BEPS mean outcome
will take a value of 31 .
One challenge in using a regression discontinuity framework in a cross-country setting
is a general lack of power. As will be seen in the next section, the average effective number
of observations being used varies between 40-80 countries. One concern is that low levels
of power make it too difficult to reject the null hypothesis of no effect, meaning that
modest impacts of the EU review and listing process will go undetected.
I can allay these concerns somewhat by constructing additional outcomes where, if the
EU’s involvement is having a sizable impact on international tax governance, we’d expect
large enough effect sizes that the minimum detectable effect (MDE) hurdle is likely to
be cleared. For this, I construct one additional outcome measures: a variable equal to
the number of proxies for the four minimum standards a jurisdiction has implemented to
13
This includes both preferential tax measures and offshore structures lacking substance requirements.
14
http://web.archive.org/
13Table 1: EU-targeted tax governance outcomes and measures used in paper
Outcome group Outcome measure Data sources
A. Tax transparency A.1 Public commitment to exchange informa- OECD AEOI Por-
tion under the Common Reporting Standard tal,a OECD Con-
(CRS) for AEOI by 2020a vention website, b ,
OECD EOIR portalc
A.2 Percentage of EU member states jurisdiction
has a AEOI relationship with
A.3 Commitment to (or signatory of) Multilateral
Convention on Mutual Administrative Assis-
tance (MAA)
A.4 “Largely compliant” or better rating by
Global Forum on EOIR
B. Fair taxation B.1 Jurisdiction reviewed at least once by either EU COCG data on
the EU Code of Conduct Group (COCG) or all regimes reviwed
(BEPS Action 5) the OECD Forum on Harm- since 1998i
ful Tax Practices (FHTP) and, as of July-
Dec, 2019, no harmful regimes are present.
C. Anti-BEPS C.1 (BEPS Action 13) Becoming a signatory of OECD CBCR and
the CbC MCAA MLI sites,e f OECD
Map Profile listg
C.2 (BEPS Action 6) Becoming a signatory of the
Multilateral Convention to Implement Tax
Treaty Related Measures to Prevent BEPS
(MLI Position)
C.3 (BEPS Action 14) Publication of Mutual
Agreement Procedure (MAP) profiles
Intermediate out- I.1 Membership in the Inclusive Framework on OECD IF member-
comes BEPS ship list d , EU Code
of Conduct Group
I.2 Membership in the Global Forum on Trans- Reports h , OECD
parency and Exchange of Information for Tax Harmful Tax Prac-
Purposes tices Peer Review
Reportj
I.3 Jurisdiction is greylisted by the EU in De-
cember 2017
I.4 Jurisdiction is blacklisted by the EU in De-
cember 2017
I.5 Jurisdiction is either grey or blacklisted by
the EU in December 2017
a https://www.oecd.org/tax/automatic-exchange/crs-implementation-and-assistance/
crs-by-jurisdiction/
b https://www.oecd.org/tax/exchange-of-tax-information/Status_of_convention.pdf
c https://www.oecd.org/tax/transparency/exchange-of-information-on-request/
ratings/
d https://www.oecd.org/tax/beps/inclusive-framework-on-beps-composition.pdf
e https://www.oecd.org/tax/automatic-exchange/about-automatic-exchange/
CbC-MCAA-Signatories.pdf
f http://www.oecd.org/tax/treaties/beps-mli-signatories-and-parties.pdf
g https://www.oecd.org/tax/dispute/country-map-profiles.htm
h https://www.consilium.europa.eu/en/policies/eu-list-of-non-cooperative-jurisdictions/
timeline-eu-list-of-non-cooperative-jurisdictions
i https://data.consilium.europa.eu/doc/document/ST-9639-2018-REV-4/en/pdf
j https://www.oecd.org/tax/beps/harmful-tax-practices-peer-review-results-on-preferential-regimes.
pdf
14date: (B.1) being cleared of harmful tax regimes, (C.1) CbCr commitment, (C.2) signing
up to the MLI and (C.3.) publishing a MAP profile. This “minimum effort’ outcome
is intended to pick up even the slightest effort at meeting these basic tax governance
outcomes. Given that the median number of these outcomes that have been reached is 3
for non-LDC jurisdictions selected into review by the EU and 0 for those that are not, an
impact of 2 seems like a reasonable expectation, one that is also in line for the MDE for
this outcome in the main reduced-form specification.
3.5 Validity of RD
3.5.1 Density tests
Density tests of the two main running variables are presented in Figure A1 in the Online
Appendix. A standard test for manipulation of the running variable fails to reject the null
of no manipulation in each case. It would be unusual for there to be signs of manipulation
in this context, as the EU’s construction of its percentage scores mechanically smooths
the distribution, making any bunching near a particular cutoff unlikely.
3.5.2 Balance
One way we can be more assured that the regression discontinuity approach is valid is to
check for balance in our outcomes of interest and for a variety of economic indicators prior
to the EU selection process. Tables A2 and A3 in the Online Appendix check balance
for pre-treatment outcomes of interest. This includes all the measures used by the EU
to construct its three selection indicators,15 the selection indicators themselves, as well
as Log(GDP per capita) from 2015 and, when available, the jurisdiction’s score from the
2015 edition of the Tax Justice Network’s Financial Secrecy Index (FSI). While there is
good balance across most indicators for the stability factors cutoff, the multidimensional
cutoff has a small imbalance in Log(GDP per capita), so I will be including it as a control
in my main specification.
3.6 Pseudo-cutoffs
I also test for effects using alternate, pseudo cutoffs for two of the main robust outcomes
of interest (grey/blacklisting and IF membership) and find no consistent evidence that
effects are present when I am using an alternate cutoff. These are presented in Figure A2
in the Online Appendix.
15
These are indicators sourced from Eurostat, the IMF, and UNCTAD, and are averaged over the five
year period preceding the EU selection (2011-2016)
15Figure 3: Crossing the selection threshold increases the probability of selection
and of subsequent black/greylisting
(a) Outcome = selected for review (b) Outcome = black or greylisted
Notes: Each figure shows the results of a local linear regression-discontinuity estimate, without controls,
of the (reduced form) effect of crossing the EU selection threshold on (a) selection into the review process
and (b) being grey and blacklisted December, 2017. Actual values are shown in Columns (1) and (5)
of Table 2). Running variables are the multidimensional and stability factors cutoffs described above.
90% confidence intervals shown. Bins chosen using mimicking variance evenly-spaced (ESMV) method
(Calonico, Cattaneo, and Titiunik 2015).
4 Results
4.1 First stage results
As discussed above, being selected by the EU implies many possible treatments. Juris-
dictions that are selected for review are then assessed for risk factors which determine
which to prioritize. Then, through their subsequent interactions with the EU, ‘risky’ ju-
risdictions decide whether they are willing to commit to implementing the above reforms.
Those that do so are added to the EU’s greylist until the reforms or complete (or they
are upgraded) and those that do not are blacklisted. Because the selection between the
two lists is endogenous, the treatment effect implied by crossing the threshold captures
the entire impact of the EU review and listing process.
Figure 3 displays the results of the local linear RD specification estimating the reduced
form effect of crossing the two thresholds (MD and SF) on the probability of being selected
for review and on subsequent grey or blacklisting. Note that the probability of selection is
16Figure 4: Main RD results
Multidimensional cutoff
(a) Tax transparency (b) Fair taxation
(c) Anti-BEPS
Notes: Each figure shows the results of a local linear regression-discontinuity estimate, without controls,
of the (reduced form) effect of crossing the EU selection threshold on each of the three main tax
governance outcomes (Column (1) of Table 2). Running variable is the multidimensional (MD) cutoff
described above. 90% confidence intervals shown. Bins chosen using mimicking variance evenly-spaced
(ESMV) method (Calonico, Cattaneo, and Titiunik 2015).
only lower than one in the multidimensional specification due to the inclusion of LDCs in
the sample. The bottom of Table 2 displays the point estimates for grey and blacklisting:
jurisdictions that cross the MD threshold are 60-75 percentage points more likely to be
subsequently grey or blacklisted. When selection is instrumented for, the point coefficients
indicate that grey or blacklisting is all but determined by selection. The SF specification
also shows strong and significant results, albeit slightly smaller than the multidimensional
specification.
Now that we have established that these thresholds are binding - that crossing them
drastically increases the chance of being reviewed and subsequently listed by the European
Union - I will turn to the actual impacts on tax governance outcomes.
174.2 Impact on tax governance outcomes
Figure 4, which displays plots of the RD specification for each of the three main tax-
governance outcomes, shows the headline results: while there is weak evidence of small
effects on Tax Transparency and Anti-BEPs outcomes, they are not statistically signifi-
cant. However we see large effects on the Fair Taxation outcome, which is wholly defined
by being reviewed by either the EU or OECD for harmful tax practices and, at present,
having no harmful regimes in operation.
Table 2 shows both the reduced form and fuzzy RD results for both cutoffs with and
without controls. For Tax Transparency, selection by the EU into the review process
changes the average result by between 0.2 and 0.48, depending on the specification, none
of which are significant. It is worth noting that in the MD specification, selection into
the EU review process has a large, statistically significant impact on being compliant
with EOIR standards, of up to 90 percentage points. The estimated effects are much
smaller and insignificant for the SF specification, which may reflect heterogeneity in the
treatment effect.
For Fair Taxation, selection increases the chance of having at least one regime reviewed
no longer having harmful regimes present by 68-100 percentage points16 For Anti-BEPS
outcomes, selection increases the mean outcome by 14-36 percentage points, on average,
but this is not statistically significant.
Selection into the EU review process has enormous implications for IF membership,
increasing the probability of joining by between 70-100 percentage points, depending on
the specification. By contrast, there is also no robust evidence that selection increases
the probability of signing up to the Global Forum, an alternative outcome I consider.
Some of these outcomes, while statistically significant, are still sizable effects. In
many circumstances (although not in the case of Fair Taxation) these results are slightly
underpowered, with minimum detectable effects (MDEs) of around 0.5-0.65 for the mean
outcomes at 80% power and 90% confidence.17 However, it is worth pointing out that only
the Fair Taxation result shows such a high degree of stability across these specifications
(as well as alternate specifications in the Online Appendix).
Still, it is possible that choosing mean outcomes sets the bar too high relative to the
desired outcomes of the EU process. Recall that the EU review process was designed to
uncover deficits in standards. For example, some jurisdictions may have had not signed up
to country-by-country reporting, where others may not have implemented AEOI. Focusing
on average improvements across all indicators may be ignoring these improvements on the
margin.
To set a lower bar, as described above, I also included an indicator of how many proxies
16
Many of these results predict increases of more than 100 percentage points, an artifact of the linear
probability model.
17
A competing concern is that the small number of effective observations in many of these regressions
may lead to artificially-small standard errors. In Table A4 in the Online Appendix I show that the
results are robust to the use of the wild bootstrap procedure from Cameron, Gelbach, and Miller (2008)
implemented using the Stata module boottest| (Roodman, Nielsen, MacKinnon, and Webb 2019).
18Table 2: Impact of EU review process on targeted outcomes
Multidimensional Stability factors
cutoff (MD) cutoff (SF)
Reduced Fuzzy Reduced Fuzzy
form RD form RD
(1) (2) (3) (4) (5) (6) (7) (8)
(A) Tax transparency:
Mean outcome 0.34 0.17 0.48 0.27 0.22 0.16 0.31 0.20
(0.27) (0.22) (0.37) (0.34) (0.27) (0.30) (0.41) (0.43)
(i) CRS committment by 2023 0.19 -0.14 0.26 -0.23 0.37 0.25 0.51 0.32
(0.32) (0.25) (0.42) (0.40) (0.29) (0.31) (0.47) (0.44)
(ii) % of EU countries covered by AEOI 0.19 0.0071 0.26 0.011 0.26 0.21 0.39 0.35
(0.28) (0.22) (0.37) (0.33) (0.21) (0.22) (0.33) (0.37)
(iv) Largely compliant on EOIR 0.60** 0.56** 0.84** 0.91** 0.23 0.14 0.31 0.17
(0.26) (0.23) (0.37) (0.37) (0.33) (0.35) (0.50) (0.51)
(iii) Signed up to MAA 0.36 0.25 0.50 0.40 0.082 0.028 0.11 0.039
(0.32) (0.28) (0.44) (0.43) (0.39) (0.41) (0.57) (0.57)
(B) Fair taxation:
Mean outcome 0.53*** 0.57*** 0.68*** 0.90*** 0.76 0.87*** 1.21*** 1.23***
(0.19) (0.18) (0.20) (0.24) (0.49) (0.31) (0.36) (0.34)
(i) Reviewed w/ no harmful regimes 0.53*** 0.57*** 0.68*** 0.90*** 0.76 0.87*** 1.21*** 1.23***
(0.19) (0.18) (0.20) (0.24) (0.49) (0.31) (0.36) (0.34)
(C) Anti-BEPS:
Mean outcome 0.15 0.089 0.21 0.14 0.20 0.28 0.30 0.36
(0.25) (0.22) (0.33) (0.34) (0.30) (0.29) (0.40) (0.40)
(i) Signed up to Cbcr 0.20 0.11 0.28 0.18 0.23 0.21 0.34 0.27
(0.24) (0.24) (0.31) (0.37) (0.37) (0.38) (0.59) (0.51)
(ii) Signed up to MLI -0.030 -0.056 -0.039 -0.089 -0.14 -0.13 -0.20 -0.16
(0.34) (0.31) (0.46) (0.49) (0.41) (0.45) (0.61) (0.62)
(iii) Published MAP profile 0.25 0.13 0.32 0.20 0.60 0.75** 0.92 0.98**
(0.27) (0.26) (0.34) (0.39) (0.56) (0.34) (0.59) (0.50)
Intermediate outcomes:
Participation in IF 0.54** 0.70*** 0.69** 1.13** 1.15*** 1.18*** 1.90 1.59*
(0.23) (0.25) (0.32) (0.53) (0.34) (0.35) (1.26) (0.81)
Signed up to Global Forum -0.093 -0.095 -0.13 -0.15 0.13 0.12 0.19 0.15
(0.31) (0.27) (0.41) (0.42) (0.59) (0.68) (0.90) (0.90)
Greylisted in 2017 0.51** 0.55*** 0.71*** 0.89*** 0.52 0.54* 0.74*** 0.76***
(0.22) (0.21) (0.25) (0.29) (0.33) (0.28) (0.23) (0.25)
Blacklisted in 2017 0.22 0.10 0.30 0.16 0.014 -0.050 0.015 -0.071
(0.16) (0.14) (0.21) (0.22) (0.12) (0.13) (0.19) (0.20)
Either grey or blacklisted 0.75*** 0.60*** 1.04*** 0.98*** 0.53** 0.47* 0.84*** 0.74***
(0.17) (0.16) (0.085) (0.12) (0.25) (0.25) (0.21) (0.24)
Other outcomes:
Number of minimum standards 1.07 0.67 1.46 1.05 1.59 1.88** 2.38* 2.42*
(0.82) (0.65) (1.07) (0.97) (1.15) (0.94) (1.28) (1.34)
Controls X X X X
Observations 194 194 194 194 177 177 177 177
Avg Effective # Obs 79 68 79 68 45 42 45 42
Avg Bandwidth 16 14.5 16 14.5 9.98 9.37 9.98 9.37
Notes: Each cell shows the estimated impact of selection into the EU review process on a different outcome,
using bandwidth-selection, bias-corrected, robust methods outlined in Calonico, Cattaneo, and Titiunik (2014),
Calonico, Cattaneo, and Farrell (2018) and Calonico, Cattaneo, Farrell, and Titiunik (2019). Each column
indicates a different specification, and each column pair indicates a different running variable (e.g. stability
factors, multidimensional). Mean outcome indicates the average of all sub-outcomes listed under a category.
∗ p < 0.10,∗∗ p < 0.05,∗∗∗ p < 0.01
19for the four minimum standards a jurisdiction has implemented: review and non-existence
of harmful tax practices, CbCr, the MLI position, or published a MAP profile. While this
does not, in itself, improve power, we might expect the impact of the EU review to have a
much larger impact on this outcome. The results using the MD specification suggest this
is not the case: it finds that selection increases the number of minimum standard met by
1-1.46 percentage points, a result that is not significant.
However, the SF specification indicates that selection may have had an impact of
roughly 2.4 minimum standards. Examining the results from each individual outcome
suggest this is primarily being driven by the harmful regime outcome (B.1) and the
publication of MAP profiles (C.3).
Why are these results different for the stability factors cutoff? Recall that, while
the MD specification estimates a frontier average treatment effect (FATE), a weighted
average of each of the three selection indicators, the SF specification only estimates a
local average treatment effect (LATE) for jurisdictions on either side of that particular
cutoff. This suggests there is some heterogeneity in the effect of the EU selection over
different jurisdictions. One possibility is that jurisdictions close to the stability factors
cutoff were initially more responsive to EU attention: the estimated impact of EU selection
on grey/blacklisting in the SF specification is lower, suggesting that jurisdictions around
this cutoff may have done more to improve their tax governance outcomes to avoid being
listed.
Table A6 in the Online Appendix shows the same results using a global RD specifi-
cation with varying polynomial functions, as well as a flexible specification where each
EU criteria is entered in as a separate function (a la Dell (2010)). In these results, the
impact of selection in the EU review process on Fair Taxation is significant and robust
across nearly every specification, a result driven entirely by the impact of the EU process
on participation in the Inclusive Framework. There is modest evidence of an impact on
the Anti-BEPs mean outcome, but this is primarily driven by IF participation.
4.3 Effects over time
Given that selection into the EU review process implied several different treatments oc-
curring at different stages, it is worth exploring the dynamics of these effects. For ex-
ample, Figure 5 displays the basic local linear RD result of the impact of crossing the
MD threshold on Inclusive Framework membership in January, 2017, as the EU review
process kicked off, versus the end of 2019. From this graph, it is clear that there has been
a substantial increase in IF membership for jurisdictions just to the right of the cutoff,
but little change on the left.
To dig into this further, in this section, I look at three outcomes that I have panel
data for which are either a component of the treatment (whether a jurisdiction is black
or greylisted) or an outcome we know from the previous section to be affected by se-
lection (membership in the Inclusive Framework) or one we failed to find an effect for
20Figure 5: Inclusive Framework Membership at the start of the EU screening
process versus today
January, 2017 December, 2019
Notes: Each figure shows the results of a local linear regression-discontinuity estimate, without controls,
of the (reduced form) effect of crossing the EU selection threshold on each of the three main tax
governance outcomes (Column (1) of Table 2). Running variable is the multidimensional cutoff described
above. 90% confidence intervals shown. Bins chosen using mimicking variance evenly-spaced (ESMV)
method (Calonico, Cattaneo, and Titiunik 2015).
(signing up for country-by-country reporting, CbCr). For the former, I digitized every
EU grey/blacklist released between December 2017 and February 2020. For the IF mem-
bership, I constructed a panel of IF membership using information from OECD-published
membership lists, OECD announcements of specific join dates, and and reports from sev-
eral of the “Big Four” consultancy firms. CbCr commitment dates are obtained directly
form the OECD website.
Figure 6 displays the results from this exercise for each of the three outcomes, using
both the MD and SF specifications. The period of the EU review process is highlighted in
red, after which the EU began publishing its grey and blacklists. The impact of crossing
the RD threshold on the probability of ending up on the EU’s list is approximately 50
percentage points at the time the first list is published. This effect fluctuates slightly
over the course of the next two years, but becomes both statistically and economically
indistinguishable from zero by the time the last list was published in February 2020. This
is driven by the removal of a large number of jurisdictions from the greylist at the end of
2019 after meeting their policy targets.
The impact of crossing the threshold on IF membership is statistically indistinguish-
able from zero prior to the selection process.18 However, during the review process the
effect begins to increase and is large and significantly positive during the summer of
2017, several months prior to the publication of an EU list. This was the period during
which the EU was intensely reviewing jurisdictions to determine if they would be eligible
for listing, suggesting that it was the EU review process itself, as well as the upcoming
threat of the grey and blacklist publication, that induced jurisdictions to join the Inclusive
Framework.
18
There are some signs of imbalance in the MD specification prior to the review process, but these
recenter around zero as of January, 2017, which is when the review process formally began.
21Figure 6: Reduced form RD estimates across time
(a) Outcome = greylisted or blacklisted
(b) Outcome = member of the Inclusive Framework
(c) Outcome = signed up for CbCr
Notes: Figure shows the robust, bias-corrected estimate of the effect of crossing the RD threshold on (a) the
probability of currently being on either the EU greylist or its blacklist, (b) the probability of being a member
of the Inclusive Framework or (c) the probability of having signed up for Country-by-Country Reporting. Each
estimate is measured at a different point in time. Red shaded area indicates the period during which the EU
reviewed selected jurisdictions and issued communications to invite jurisdictions to adopt better tax governance
standards. Blue shaded area indicates the beginning of the grey and blacklisting period. Left column displays
estimates using multidimensional cutoff and right column displays estimates using the stability-factors cutoff. 90%
confidence intervals.
Finally, the rate at which jurisdictions sign up for CbCr is never significantly affected
by the EU review process. However, the point estimate does increase slightly during the
review process - suggesting it may have had a marginal effect on CbCr adoption.
22You can also read