Sustainable Groundwater Management Act 2019 Basin Prioritization - Process and Results - EMWD
←
→
Page content transcription
If your browser does not render page correctly, please read the page content below
Sustainable
Groundwater
Management Act
2019 Basin Prioritization
Process and Results

                                         State of California
                     California Natural Resources Agency
                          Department of Water Resources
          Sustainable Groundwater Management Program

                                                 APRIL 2019

Contents

Table of Contents
I.     Purpose of Report .............................................................................................................................. 1
II. Introduction ......................................................................................................................................... 1
III. Background ........................................................................................................................................ 1
IV. SGMA 2019 Basin Prioritization....................................................................................................... 3
V. Process               ............................................................................................................................................ 4
     Component 1: The population overlying the basin or subbasin ............................................................... 4
     Component 2: The rate of current and projected growth of the population overlying the basin or
                   subbasin .......................................................................................................................... 5
     Component 3: The number of public supply wells that draw from the basin or subbasin ...................... 8
     Component 4: The total number of wells that draw from the basin or subbasin .................................... 9
     Component 5: The irrigated acreage overlying the basin or subbasin ................................................... 12
     Component 6: The degree to which persons overlying the basin or subbasin rely on groundwater as
                   their primary source of water ....................................................................................... 13
     Component 7: Any documented impacts on the groundwater within the basin or subbasin, including
                   overdraft, subsidence, saline intrusion, and other water quality degradation ............ 17
     Component 8: Any other information determined to be relevant by the department, including adverse
                   impacts on local habitat and local streamflows ........................................................... 22
VI. Basin Priority ...................................................................................................................................... 30
VII. References ........................................................................................................................................ 31
Appendix 1 – Summary of SGMA 2019 Basin Prioritization Results......................................... A-1
Appendix 2 – DWR standard land use legend (adapted for remote sensing crop
             mapping) (component 6.a) ................................................................................. A-19
Appendix 3 – List of chemicals used in the evaluation of documented water quality
             degradation (component 7.d) ............................................................................ A-20
Appendix 4 – Computed groundwater volume for non-adjudicated portion(s) of basins
             with adjudicated area used during evaluation (component 8.c.3) ......... A-22
Appendix 5 – Breakdown of area in basins with adjudications used during evaluation
             (component 8.c.3) .................................................................................................. A-23
Appendix 6 – Groundwater Basins Identified with Groundwater-Related Transfers
             (component 8.d.2) .................................................................................................. A-24

                                                                                                                                                                      i
Contents
Figures
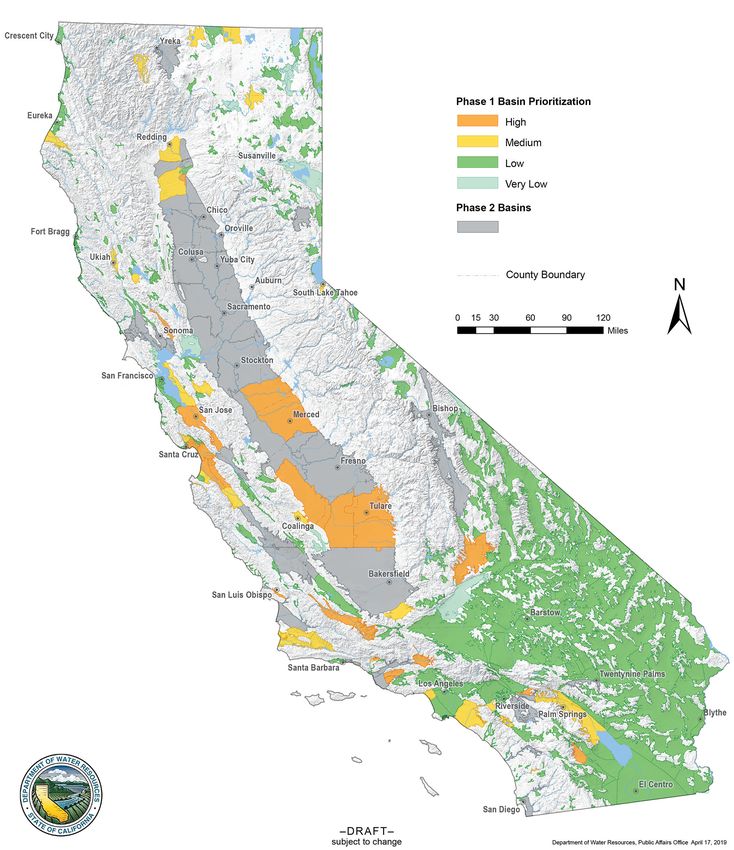
Figure A-1 Statewide Map of SGMA 2019 Basin Prioritization Results, Phase 1 Final ............................. A-2
Figure A-2 Statewide Map of SGMA 2019 Basin Prioritization Results, Phase 2 Draft ........................... A-16
Tables
Table 1 Component 1: Priority Points and Ranges for Population Density .................................................. 5
Table 2 Component 2: Priority Points and Ranges for Population Growth .................................................. 7
Table 3 Component 3: Priority Points and Ranges for Public Supply Well Density ...................................... 9
Table 4 Component 4: Priority Points and Ranges for Total Production Well Density............................... 11
Table 5 Component 5: Priority Points and Ranges for Density of Irrigated Acres ...................................... 12
Table 6 Component 6.a: Points and Ranges for Groundwater Use per Acre ............................................. 16
Table 7 Component 6.b: Points and Ranges for Percent of Total Water Supply
Met by Groundwater ..................................................................................................................... 17
Table 8 Sub-component 7.d.1: Points and Ranges for Documented Impacts –
Water Quality Degradation – Average Relative MCL Exceedance................................................. 21
Table 9 Sub-component 7.d.2: Points and Ranges for Documented Impacts –
Water Quality Degradation – Prevalence of Groundwater Contamination .................................. 21
Table 10 Sub-component 7.d: Points and Ranges for Documented Impacts –
Water Quality Degradation ............................................................................................................ 22
Table 11 Component 7: Priority Points and Ranges for Documented Impacts –
Cumulative Total ............................................................................................................................ 22
Table 12 Sub-components 8.c and 8.d: Additional Conditions Analyzed Prior
to Priority Determination............................................................................................................... 25
Table 13 SGMA 2019 Basin Prioritization Priority Based on Total Priority Points ...................................... 30
Table A-1 Statewide SGMA 2019 Basin Prioritization Results, Phase 1 Final ........................................... A-3
Table A-2 Statewide SGMA 2019 Basin Prioritization Results, Phase 2 Draft......................................... A-17
iiContents
Acronyms and Abbreviations
Cal-SIMETAW California Simulation of Evapotranspiration of Applied Water
CASGEM California Statewide Groundwater Elevation Monitoring
DOF California Department of Finance
DWR California Department of Water Resources
GAMA Groundwater Ambient Monitoring and Assessment
GSA Groundwater Sustainability Agency
GSP Groundwater Sustainability Plan
MCL Maximum Contaminant Level
NHD National Hydrography Dataset
OSWCR Online System for Well Completion Reports
PLSS Public Land Survey System
PWSS Public Water System Statistics
SGMA Sustainable Groundwater Management Act
SWRCB State Water Resources Control Board
USGS United States Geological Survey
WCR Well Completion Report (DWR Form 188)
iiiI. Purpose of Report
This report describes the background, process, and results of the Sustainable Groundwater Management
Act (SGMA) 2019 Basin Prioritization. The California Department of Water Resources (DWR) is
required to update California’s groundwater basin prioritization in accordance with the requirements of
SGMA and related laws. 1
II. Introduction
Bulletin 118 – Interim Update 2016 (California Department of Water Resources 2016a) defined 517
groundwater basins and subbasins in California. DWR is required to prioritize these 517 groundwater
basins and subbasins as either high, medium, low, or very low. For the purposes of groundwater basin
prioritization, basins and subbasins are processed equally and are referred to as basins in this report.
It is the policy of the State through SGMA that groundwater resources be managed sustainably for long-
term reliability and multiple benefits for current and future beneficial uses. The State also recognizes that
sustainable groundwater management is best achieved locally through the development, implementation,
and updating of plans and programs based on the best available science.
DWR plays a key role in providing the framework for sustainable groundwater management in
accordance with the statutory requirements of SGMA and other provisions within the California Water
Code (Water Code). Other State agencies, including the State Water Resources Control Board (SWRCB)
and California Department of Fish and Wildlife, play a role in SGMA implementation and are required to
consider SGMA when adopting policies, regulations, or criteria, or when issuing orders or determinations,
where pertinent. 2
III. Background
Groundwater basin prioritization was initially completed by DWR in response to legislation enacted in
California's 2009 Comprehensive Water Package (California Department of Water Resources 2009),
which established Part 2.11 of the Water Code requiring groundwater elevations be monitored seasonally
in all groundwater basins identified in the Bulletin 118 - 2003 Update 3 (California Department of Water
Resources 2003a). Part 2.11 added general provisions to the Water Code that required DWR to identify
the extent of groundwater elevation monitoring undertaken within each basin and directed DWR to
prioritize basins for that purpose. In response to the new requirements of Part 2.11, DWR established the
California Statewide Groundwater Elevation Monitoring (CASGEM) Program. In June 2014, the
CASGEM Program released its prioritization for the groundwater basins identified in Bulletin 118 - 2003
1
Water Code sections 10722.4 and 10933.
2
Water Code Section 10720.9.
3
Stats. 2009-2010, 7th Ex. Sess., c. 1 (S.B.6), § 1, eff. Feb. 3, 2010.
Sustainable Groundwater Management Act 2019 Basin Prioritization | Process and Results 1California Department of Water Resources
Update. The CASGEM 2014 Basin Prioritization classified basins as high, medium, low, or very low
based on the consideration of the eight components required in Water Code Section 10933(b).
In September 2014, Governor Brown signed into law three bills that formed SGMA. 4 SGMA required
DWR to update basin priority for each groundwater basin no later than January 31, 2015, and reassess the
prioritization anytime DWR updates Bulletin 118 basin boundaries. 5 DWR applied the CASGEM 2014
Basin Prioritization as the initial SGMA 2015 Basin Prioritization under SGMA, resulting in the
designation of 127 high and medium priority basins (California Department of Water Resources 2014a).
In the fall of 2016, DWR completed and released groundwater basin boundary modifications. Bulletin 118
– Interim Update 2016, which included the final boundary modifications, was published on December 22,
2016. As a result of these modifications, updated basin prioritizations were required for the 517
groundwater basins identified in Bulletin 118. In May of 2018, DWR released the draft basin
prioritization results for the 517 basins and held a 94-day public comment period. Simultaneously, local
agencies requested a subsequent round of basin boundary modifications. This required DWR to prioritize
the basins in two phases (referred to as SGMA 2019 Basin Prioritization Phase 1 and 2).
The SGMA 2019 Basin Prioritization Phase 1 focused on the basins that used the Bulletin 118 – Interim
Update 2016 basin boundary shapefile (California Department of Water Resources 2016b) and not
affected by the 2018 basin boundary modifications. This phase allowed DWR to finalize in January 2019
the SGMA 2019 Basin Prioritization Phase 1 priorities that included 458 basins.
SGMA 2019 Basin Prioritization Phase 2 covers the remaining 57 basins that include the 53 basins that
were modified and approved, as well as two that were not approved by DWR as part of the 2018 basin
boundary modifications, plus two basins whose boundary modifications were from Assembly Bill 1944.
All 57 basins of SGMA 2019 Basin Prioritization Phase 2 used the Bulletin 118 – Update 2019 basin
boundary shapefile (California Department of Water Resources 2019).
SGMA applies to all California groundwater basins and requires that high- and medium-priority
groundwater basins form Groundwater Sustainability Agencies (GSAs) and be managed in accordance
with locally-developed Groundwater Sustainability Plans (GSPs) or Alternatives to GSPs (Alternatives).
High- and medium-priority basins that are identified in Bulletin 118 – Interim Update 2016 as a critically
overdrafted basin are required to submit a GSP by January 31, 2020. The remaining high- and medium-
priority basins identified in January 2015 are required to submit a GSP by January 31, 2022. Basins newly
identified as high- or medium-priority in the SGMA 2019 Basin Prioritization are required to form a GSA
or submit an Alternative within two years from the date the basin’s priority is finalized and are required to
submit a GSP five years from the same finalization date.
4
Stats.2014, c. 346 (S.B.1168), § 3, c. 347 (A.B.1739), § 18, c. 348 (S.B.1319), § 2, eff. Jan. 1, 2015.
5
Water Code sections 10722.4(b) and 10722.4(c)
2 Sustainable Groundwater Management Act 2019 Basin Prioritization | Process and ResultsIV. SGMA 2019 Basin Prioritization
The SGMA 2019 Basin Prioritization process was conducted to reassess the priority of the groundwater
basins following the 2016 basin boundary modification, as required by the Water Code. 6 For the SGMA
2019 Basin Prioritization, DWR followed the process and methodology developed for the CASGEM
2014 Basin Prioritization, adjusted as required by SGMA and related legislation. DWR is required to
prioritize basins for the purposes of SGMA, 7 which was enacted, among other things, to provide for the
sustainable management of groundwater basins. This entailed a reassessment of factors that had been
utilized in the CASGEM program to prioritize basins based on groundwater elevation monitoring. SGMA
also required DWR to continue to prioritize basins based on a consideration of the components specified
in Water Code Section 10933(b), but the list of components had been amended to include the italicized
language:
1. The population overlying the basin or subbasin.
2. The rate of current and projected growth of the population overlying the basin or subbasin.
3. The number of public supply wells that draw from the basin or subbasin.
4. The total number of wells that draw from the basin or subbasin.
5. The irrigated acreage overlying the basin or subbasin.
6. The degree to which persons overlying the basin or subbasin rely on groundwater as their
primary source of water.
7. Any documented impacts on the groundwater within the basin or subbasin, including overdraft,
subsidence, saline intrusion, and other water quality degradation.
8. Any other information determined to be relevant by the department, including adverse impacts
on local habitat and local streamflows [emphasis added].
DWR incorporated new data, to the extent data are available 8, and the amended language of Water Code
Section 10933(b)(8) (component 8) to include an analysis of adverse impacts on local habitat and local
streamflows as part of the SGMA 2019 Basin Prioritization. Evaluation of groundwater basins at a
statewide scale does not necessarily capture the local importance of groundwater resources within the
smaller-size or lower‐use groundwater basins. For many of California’s low‐use basins, groundwater
provides close to 100 percent of the local beneficial uses. Thus, when reviewing the SGMA 2019 Basin
Prioritization results, it is important to recognize the findings are not intended to characterize groundwater
management practices or diminish the local importance of the smaller-size or lower‐use groundwater
basins; rather, the results are presented as a statewide assessment of the overall importance of
groundwater resources in meeting beneficial uses.
6
Water Code Section 10722.4(c)
7
Water Code Section 10722.4(a)
8
Water Code Section 10933(b)
Sustainable Groundwater Management Act 2019 Basin Prioritization | Process and Results 3California Department of Water Resources
The following information was deemed relevant and considered as part of component 8 for the SGMA
2019 Basin Prioritization based on SGMA:
• Adverse impacts on local habitat and local streamflows.
• Adjudicated areas.
• Critically overdrafted basins.
• Groundwater-related transfers.
Additional information about how each of these components were analyzed can be found in the process
section of this document.
V. Process
The CASGEM 2014 and SGMA 2019 basin prioritization used the basin’s total priority points assigned to
each of the eight components to determine the priority. Based on the total accumulated priority points, the
basin was assigned a very low, low, medium, or high priority. Both prioritization processes included
additional evaluations of the basins that could alter the points assigned and thus the priority.
The data sources, processes, and steps used to evaluate each of the eight components of Water Code
Section 10933(b) for the SGMA 2019 Basin Prioritization are described below. Supplemental data
submitted during the May 2018 Draft Basin Prioritization comment period was also considered before
finalization.
Component 1: The population overlying the basin or subbasin 9
Data Source
• 2010 United States Census population block data (California)
Process
Population density was analyzed for the SGMA 2019 Basin Prioritization using the same methods and
data relative to the CASGEM 2014 Basin Prioritization. The 2010 United States Census population block
data (United States Census Bureau 2010a and 2010b) was used to calculate the population overlying each
groundwater basin using the following methods:
• For population blocks contained wholly within a basin boundary, all population in the block
was included in the basin population total.
• For population blocks located partially within the basin, the proportion of the population
included was equal to the proportion of the area of the block contained within the basin and was
applied to the basin population total. For example, if 60% of the population block was within
basin boundaries, then 60% of the reporting block total population was attributed to the total
population of the basin.
9
Water Code Section 10933(b)(1)
4 Sustainable Groundwater Management Act 2019 Basin Prioritization | Process and ResultsStep 1 – Calculate Basin’s Total Population: The basin’s total population was calculated by summing
all the included population blocks per the two methods described above.
Step 2 – Calculate the Population Density: The basin’s 2010 population density was calculated by
dividing the basin’s total population (Step 1) by the basin’s area (square miles – Appendix 1).
Table 1 lists the priority points and associated ranges of population density.
Table 1 Component 1: Priority Points and Ranges for Population Density
Population Density
Priority Points (people/square mile)
‘x’ = population density
0 xCalifornia Department of Water Resources
United States Census population block data were used to calculate the population overlying the non-basin
area in each county:
• For population blocks contained wholly outside of a basin boundary and within the county, all
population in the block was included in the non-basin population total for the county.
• For population blocks located partially outside of a basin boundary and within the county, the
proportion of the population block contained outside of a basin was applied to the non-basin
population total for the county. For example, if 40 percent of the reporting block total
population was located outside of a basin boundary, 40 percent of the population was attributed
to the total population of the non-basin area.
• For population blocks located outside of a basin boundary and partially outside of the county,
the proportion of the population block contained within the county was applied to the non-basin
population total. For example, if 60 percent of the population block was within county
boundaries, then 60 percent of the reporting block total population was attributed to the total
population of the non-basin area.
Step 3 – Calculate the Difference Between the 2000 and 2010 Population: The difference between the
2000 and 2010 population estimates for each of the basins, portions of basins, and non-basin areas was
calculated within each county.
Step 4 – Calculate the Share of the Basin’s Population Growth: The total population difference for the
county was determined by summing the values from Step 3. The share (percentage) of the basin’s
population growth over the 2000 to 2010 decade was calculated by dividing the total basin population
difference by the total county population difference.
Step 5 – Calculate the Projected Population Change from 2010 to 2030: The DOF current trend 2030
population projection for the county was used to determine the total change in county population between
2010 estimates and 2030 population projections.
Step 6 – Calculate the 2030 Population Projection: Each basin and non-basin share percentage (Step 4)
was multiplied by the total 2030 projected change (Step 5) to produce a 2030 population projection for
each basin and non-basin area within the 58 counties. For most basins located within a single county, the
2030 population projection was considered complete. Some low-population basins required minor
adjustments when the projected population resulted in a negative value. In these situations, the population
was adjusted to zero and the initial basin’s results were redistributed to the other basin and non-basin
areas in the county. For basins located in more than one county, the 2030 population projections for each
portion of a basin that crossed a county boundary were summed to produce a 2030 population projection
for the entire basin.
Estimates of population growth obtained using the methods described above were evaluated and adjusted,
as necessary, to conform with DOF current trend 2030 county projections per California Government
Code Section 13073(c).
Part B: Determining the 2030 Population Growth (Percentage)
6 Sustainable Groundwater Management Act 2019 Basin Prioritization | Process and ResultsThe projected percent growth within each basin was determined by subtracting the 2010 population
estimate (component 1) from the 2030 population projection (Step 6 of Part A) and dividing the result by
the 2010 populations estimate:
Percent Growth =
((Projected 2030 Basin Population – 2010 Basin Population) / 2010 Basin Population) * 100
Part C: Determining the Priority Points for Population Growth
Using the percent growth calculated in Step 4 of Part A, the basin was assigned the preliminary priority
points identified in Table 2. Before determining the priority points, additional analysis was completed to
determine if the basin met the minimum requirements for population growth as defined in the CASGEM
2014 Basin Prioritization process (California Department of Water Resources 2014b):
• Does the basin have zero 2010 population?
• Does the basin have less than or equal to zero percent growth?
• Is the basin’s 2010 population (component 1) less than 1,000 people and does the basin have
growth greater than zero?
• Is the basin’s 2010 basin population less than or equal to 25,000 and is the basin's 2010
population density less than 50 people per square mile?
If the answer was ‘yes’ to any of the four questions above, the priority points for component 2 were
recorded as zero. If the answer was ‘no’ to all four questions above, the priority points were applied to
each basin based on the percentage of population growth. Table 2 lists the priority points and associated
ranges of population growth percentage.
Table 2 Component 2: Priority Points and Ranges for Population Growth
Population Growth
Priority Points (percent)
‘x’ = Population growth percentage
0 x≤0
1 0California Department of Water Resources
Component 3: The number of public supply wells that draw from the basin
or subbasin 11
Data Source
• SWRCB, Division of Drinking Water - Public Supply Database, March 2016
• Verified local public supply well location and use information received through public
comment process
Process
Public supply wells were analyzed for the SGMA 2019 Basin Prioritization using the same methods and
updated data relative to the CASGEM 2014 Basin Prioritization.
The SWRCB public supply well database (State Water Resources Control Board 2016) was used to
calculate the number of public supply wells that draw from the basin, as it is the only statewide dataset
that includes records associated with supply water for the public. The SWRCB public supply well
database was accessed during March 2016 for the SGMA 2019 Basin Prioritization process. Each record
in the database contains fields for active and inactive systems, water source (groundwater or surface
water), and testing location. Different records for the same public supply system can exist due to separate
testing locations for water quality. In most cases, the only distinction is in the location name.
The public supply data was processed by taking the following steps:
Step 1 – Query the Public Supply Well Database for Active Wells: The individual public supply wells
that draw from each basin were determined by querying the public supply well database for entries
classified as ‘active,’ and ‘groundwater,’ and that contained the word ‘well’ in the location name. Only
wells active as of the time the data was extracted (March 2016) were included in this analysis. The
number of individual public supply wells determined in this manner is not intended to establish an
absolute value for any given basin, but to provide a relative measure of such wells between basins.
Step 2 – Perform Quality Control of Public Supply Well Coordinates: Each record from Step 1 was
reviewed to identify incomplete or blank coordinates. Incomplete coordinates did not include enough
decimal places in the coordinates to reliably map. They were corrected, when possible, using available
attributes provided with public supply data. Records with blank coordinates were also corrected, when
possible, using available attributes provided with public supply data. Wells with corrected coordinates
were identified as modified with a “DWR” tag.
Step 3 – Compare Coordinates to County Codes: Public supply well locations were compared to the
two-digit County Code included in the Public Water System Identification Number. If the well location
did not fall within the proper county and location information was not readily available in the public
supply well attributes, the public supply well was not included in the dataset.
11
Water Code Section 10933(b)(3)
8 Sustainable Groundwater Management Act 2019 Basin Prioritization | Process and ResultsStep 4 – Sum of Wells in Basin: Using Geographic Information System (GIS) software, the number of
wells in each basin were counted based on the reconciled information from Steps 2 and 3.
Step 5 – Calculate the Public Supply Well Density: To calculate the public supply well density, the
number of public supply wells (Step 4) was divided by the basin area (square miles).
Priority points were applied to each basin based on the calculated public supply well density. Table 3 lists
the priority points and associated ranges of public supply well density.
Table 3 Component 3: Priority Points and Ranges for Public Supply Well Density
Public Supply Well Density
Priority Points
(x = wells per square mile)
0 x=0
1 0 < x < 0.1
2 0.1 ≤ x < 0.25
3 0.25 ≤ x < 0.5
4 0.5 ≤ x < 1.0
5 x ≥ 1.0
Component 4: The total number of wells that draw from the basin or
subbasin 12
Data Source
• Online System for Well Completion Reports (OSWCR) (California Department of Water
Resources 2017)
• Verified local well location and use information received through public comment process
Process
Production wells were analyzed for the SGMA 2019 Basin Prioritization using updated methods and data
relative to the CASGEM 2014 Basin Prioritization. Updated methods included defining production wells
and improving the well location process. Both updated methods are further described below.
DWR’s new OSWCR database, which was not available at the time of the CASGEM 2014 Basin
Prioritization, was used for the SGMA 2019 Basin Prioritization. The OSWCR database is a statewide
dataset of well completion reports (WCRs). Each WCR contains useful information including well type,
location, construction details, time of drilling, well performance, and aquifer characteristics.
12
Water Code Section 10933(b)(4)
Sustainable Groundwater Management Act 2019 Basin Prioritization | Process and Results 9California Department of Water Resources
Part A – Identifying Production Wells
The OSWCR database was used to identify production wells whose well use type within the WCR is
listed as agriculture, domestic, irrigation, municipal, commercial, stock, industrial, or other extraction. If
the well use type was not provided on the WCR, the following information, if present, was evaluated to
determine if the WCR would be used for component 4.
• Many WCRs with an ‘unknown’ well type provide information about the well casing size and
total depth. Criteria for separating production from non-production wells based on well casing
size and total depth was established by reviewing domestic and water quality monitoring
WCRs. It was determined that screening for a well casing greater than or equal to 4 inches and
a total depth greater than or equal to 22 feet to identify production wells would provide the best
balance between the urban and rural well characteristics. If the criteria of a well casing greater
than or equal to 4 inches and a total depth greater than or equal to 22 feet were met, the WCR
was considered to represent a production well.
• In some cases, the WCR only provided information on either well casing diameter or well depth
information. For WCRs that only provided well casing size, the casing had to be greater than or
equal to 4 inches to be considered a production well. For WCRs that only provided well depth,
the well depth had to be greater than or equal to 22 feet to be considered a production well.
Part B – Determining the Location of Production Wells to the Highest Resolution
Well locations were determined using information included on the WCRs. For WCRs that included
latitude and longitude, the coordinates were used to determine well locations. The spatial resolution in
these cases was assumed to be absolute.
For WCRs that provided a spatial reference location based on Public Land Survey System (PLSS) data, a
centroid location was assigned. The spatial reference location for a well gives a general well location
within a known area rather than the actual well location. The process for assigning a well location to a
spatial reference location based on information provided in the WCRs is discussed below:
• WCRs with township-range-section, baseline meridian, and county information: For
WCRs that included township-range-section, baseline meridian, and county information, a
section centroid was used as the well location. If the given section was split by a county line, a
county-section was created for each portion of the section, and WCRs that identified the county
and PLSS location were assigned to that county-section. WCRs were assigned coordinates
representing their respective county-section centroid. The spatial resolution in these cases was
less than or equal to one square mile.
• WCRs with incorrect or without baseline meridian: For WCRs that either did not provide a
baseline meridian or provided an incorrect baseline meridian, the county location information
was relied upon to locate the well to a county-section and assign a respective centroid. The
spatial resolution in these cases was less than or equal to one square mile.
• WCRs with incorrect or without county: For WCRs that either did not provide a county or
provided an incorrect county, the township-range-section and baseline meridian information
was relied on to locate the well to a section and assign a respective centroid. The spatial
10 Sustainable Groundwater Management Act 2019 Basin Prioritization | Process and Resultsresolution in these cases was less than or equal to one square mile.
• WCRs without township-range-section, baseline meridian, and county information: All
WCRs that did not provide township-range-section, baseline meridian, and county information
were discarded from the analysis.
Part C – Estimating Number of Production Wells within a Basin
The total number of production wells in a basin was estimated by considering all the wells actually and
potentially located in the basin. Wells assigned a centroid location were proportionally counted because
the exact location of the wells was unknown. The process for proportionally counting wells is described
below:
Step 1 – Map Wells using GIS Software: All wells with coordinates (absolute or section centroid
coordinates) were mapped using Geographic Information System (GIS) software.
Step 2 – Sum Wells Wholly in Basin: Based on results from Step 1, if a well’s absolute location or
entire section’s area associated with the centroid was wholly within a basin boundary, it was counted as
one well.
Step 3 – Sum Wells Partially in Basin: Based on results from Step 1, if a section’s area associated with
the centroid was only partially located in a basin, all the wells within the section were proportionally
counted based on the proportion of the spatial reference area located in the basin. For example, if only 50
percent of a section’s spatial reference area was located in a basin, then all the wells in the section’s
spatial reference area were given a weighted value of 0.50 for that basin.
Step 4 – Calculate Total Number of Production Wells: The total number of production wells (Steps 2
and 3) in each basin was summed and then rounded down to the nearest whole number.
Part D – Determining the Basin Production Well Density
Once production well totals were calculated for each basin (Part C), the production well density was
calculated by dividing the basin’s total number of production wells by the basin’s area (square mile).
Table 4 lists the priority points and associated ranges of production well density.
Table 4 Component 4: Priority Points and Ranges for Total Production Well Density
Production Well Density
Priority Points
(x = production wells per square mile)
0 x=0
1 0California Department of Water Resources
Component 5: The irrigated acreage overlying the basin or subbasin 13
Data Source
• Statewide Crop Mapping 2014 (California Department of Water Resources 2014c)
• Verified local land use information received through public comment process
Process
The consideration of irrigated acreage as a component of the SGMA 2019 Basin Prioritization used the
same methods with updated data relative to the CASGEM 2014 Basin Prioritization. The CASGEM 2014
Basin Prioritization used DWR Land Use mapping data to determine irrigated acres. However, the land
use data represented multiple years of survey efforts throughout the State. For the SGMA 2019 Basin
Prioritization, the Statewide Crop Mapping 2014 dataset was used to provide statewide coverage for a
single year. The Statewide Crop Mapping 2014 dataset is a statewide, comprehensive field-level
assessment of summer-season agriculture, managed wetlands, and urban boundaries for the 2014 year.
For the purposes of basin prioritization, all agriculture identified in the Statewide Crop Mapping 2014
dataset was identified as irrigated unless an agricultural field had been previously identified by DWR as
dry-farmed. Only irrigated acreage inside the basin boundaries was included in the calculation and
analysis. This was accomplished by overlying the spatial crop mapping data on groundwater basin
boundaries to determine total agricultural field acreage overlying the basin.
The basin’s irrigated acreage density was calculated by dividing the basin’s total irrigated acreage by the
basin’s area (square mile).
Table 5 lists the priority points and associated ranges of density of irrigated acres.
Table 5 Component 5: Priority Points and Ranges for Density of Irrigated Acres
Density of Irrigated Acres
Priority Points
(x = acres of irrigation per square mile)
0 xComponent 6: The degree to which persons overlying the basin or
subbasin rely on groundwater as their primary source of water 14
The groundwater reliance component in basin prioritization is comprised of two elements: total estimated
groundwater use in the basin, referred to as Groundwater Use (sub-component 6.a), and the overall
percent groundwater represents of the estimated total water use in the basin, referred to as Groundwater
Reliance (sub-component 6.b).
Sub-component 6.a: Evaluating Volume of Groundwater Use
The consideration of groundwater use as a sub-component of the SGMA 2019 Basin Prioritization
groundwater reliance component used updated methods and data relative to the CASGEM 2014 Basin
Prioritization. The CASGEM 2014 Basin Prioritization used the DWR Agricultural model. For the
SGMA 2019 Basin Prioritization, agricultural groundwater use was calculated by incorporating the crop
types and total acreage from component 5 (above) into the California Simulation of Evapotranspiration of
Applied Water (Cal-SIMETAW) v3.2 model (Morteza et al. 2013). The Cal-SIMETAW model was used
for the SGMA 2019 Basin Prioritization to be consistent with the California Water Plan Update 2018.
The model results were represented by evapotranspiration of applied water for each crop in the basin,
representing total water demand not met by precipitation in Water Year 2014.
The updated process for this sub-component also included the use of Water Year 2014 (October 1, 2013
to September 30, 2014) data for both agricultural applied water and urban water used. Water Year 2014
was used because the Statewide Crop Mapping 2014 dataset was the best statewide land use information
available at the time of analysis. The 2014 land use information also serves as a bench mark of water use
prior to the enactment of SGMA.
The updated process for calculating urban groundwater use (Part B, below) included the use of local
agency data provided in the SWRCB Public Water System Statistics (PWSS) database (California
Department of Water Resources 2014d) and water purveyor boundaries.
Part A: Estimating Agricultural Groundwater Use
Data Source
• California Simulation of Evapotranspiration of Applied Water v3.2
• Statewide Crop Mapping 2014 (California Department of Water Resources 2014c)
• Irrigated Acres (component 5)
• Water balance data developed to support the California Water Plan
• Verified local agricultural information received through public comment process
Process
Agricultural groundwater use was estimated using the most recent Statewide Crop Mapping 2014 survey
for land use acreages and the Cal-SIMETAW model, which incorporates local soil information, growth
14
Water Code Section 10933(b)(6)
Sustainable Groundwater Management Act 2019 Basin Prioritization | Process and Results 13California Department of Water Resources
dates, crop coefficients, and evapotranspiration data from the Spatial California Irrigation Management
Information System for water use demand estimates. Estimates were calculated using the following steps:
Step 1 – Determine Total Acres of Each Major Crop: The DWR Statewide Crop Mapping 2014
acreage data were overlaid on groundwater basin boundaries to determine the total acres of each DWR-
defined major crop class (see Appendix 2) within the groundwater basins.
Step 2 – Determine Applied Water per Acre per Major Crop: The Cal-SIMETAW model was used to
determine the volume of applied water for the DWR-defined major crop classes within the groundwater
basins. Applied water per single acre of each DWR-defined major crop class was then estimated within
each basin.
Step 3 – Calculate Total Applied Water for Each Crop: The estimates of applied water per single acre
for each major crop class (Step 2) were multiplied by the total acres of DWR-defined major crop classes
(Step 1) to estimate the total applied water for each crop class. The total applied water for each crop class
was added to determine the total applied water for agriculture in the basin. The total applied water for
each crop represents the combination of surface water and groundwater.
Step 4 – Calculate Total Groundwater Use: The total groundwater use (acre-feet) for the basin was
estimated by multiplying the total applied water (Step 3) by the groundwater percentage of total applied
water provided in the California Water Plan Update 2018.
Part B: Estimating Urban Groundwater Use
Data Source
• Public Water System Statistics (PWSS) database (California Department of Water Resources
2014d)
• Water purveyor boundaries (multiple sources)
• United States Department of Agriculture (USDA) National Agricultural Statistics Service
CropScape and Cropland data layers (Urban portion) 2014
• Land Use surveys (Urban portion) (2000 through 2014)
• Groundwater Basin population data (2014)
• Verified local urban water use information received through public comment process
Process
Urban groundwater use was estimated within each groundwater basin using the data sources listed above.
The data sources were processed using the following methods:
Step 1 - Determine Groundwater Basin Population: Actual census population block data and DOF
population estimates are only available for years ending in a zero. DWR required 2014 population data to
process the urban groundwater volumes. DWR accessed a third-party demographics software (Nielsen
Claritas 2014) that estimated the population based on groundwater basin boundaries to determine the
2014 population.
14 Sustainable Groundwater Management Act 2019 Basin Prioritization | Process and ResultsStep 2 - Refine Water Purveyor Service Area: Service area boundaries were compiled using multiple sources including a DWR database, direct inquiries, and information included in Urban Water Management Plans. The service area boundaries were then refined based on the urban land use data (U.S. Department of Agriculture 2014; California Department of Water Resources 2000 through 2014) and overlaid on groundwater basin boundaries. The basin fraction value of the boundary that overlies each basin was used in subsequent steps. Step 3 – Determine Population Served Within Groundwater Basin: Urban water purveyors’ PWSS water use and population served data (California Department of Water Resources 2014d) were linked to their respective service area boundaries as refined in Step 2. The basin fraction value (Step 2) of the water purveyor boundary was applied to the total population served to determine the population served within the basin. Step 4 - Determine Self-Supplied Population: The self-supplied population was determined by calculating the difference between population served in the basin (Step 3) and the basin population (Step 1). Step 5 – Determine Water Purveyor Per-Capita Water Use: The water purveyors’ PWSS water use and population served data were used to develop their respective per-capita water use. Step 6 – Determine Groundwater Basin Per-Capita Water Use: The water purveyors that were identified as having all or part of their service area within a basin were used in this calculation. Each water purveyors’ per-capita water use was averaged together using their respective population served and basin fraction value (Step 2). Step 7 – Calculate Population-Based Water Use: Groundwater basin per-capita estimates (Step 6) were multiplied by the corresponding groundwater basin 2014 population (Step 1) to produce an estimated population-based urban water use. If the groundwater basin did not have any organized water purveyors, DWR provided an estimated average per-capita use to be used in the calculation. Step 8a – Calculate Groundwater Use for Population Served by Water Purveyor: The urban water purveyors’ PWSS data also reports the source of water used in their systems. DWR used this information along with the basin fraction value (Step 2) to calculate the basin’s surface water and groundwater volume and the respective percent of total water supplied. Step 8b – Calculate Groundwater Use for Self-Supplied Population: Self-supplied groundwater use was calculated by multiplying the per-capita value determined in Step 6 by the self-supplied population. DWR determined the source of supply for the self-supplied population to be groundwater in most cases. Step 9 – Estimate Additional Groundwater Use: Additional urban water uses (such as golf courses, parks, and self-supplied industrial) were calculated if data were available from local sources such as Urban Water Management Plans. Step 10 – Calculate Total Urban Groundwater Use: The groundwater amounts calculated in Steps 8a, 8b, and 9 were combined to obtain the total urban groundwater use. Sustainable Groundwater Management Act 2019 Basin Prioritization | Process and Results 15
California Department of Water Resources

Part C: Calculating Total Groundwater Use

Total groundwater use was calculated by adding agricultural groundwater use (Part A, Step 4) and urban
groundwater use (Part B, Step 10). Basin groundwater use per acre was calculated for each basin by
dividing the total acre-feet of groundwater use by the basin area (acres). Table 6 lists the points and
associated ranges of groundwater use per acre.

Table 6 Component 6.a: Points and Ranges for Groundwater Use per Acre
                                                    Groundwater Use per Acre
                        Points
                                                         (x = acre-ft / acre)
                          0                                   x < 0.03
                          1                                 0.03 ≤ x < 0.1
                          2                                 0.1 ≤ x < 0.25
                          3                                 0.25 ≤ x < 0.5
                          4                                 0.5 ≤ x < 0.75
                          5                                   x ≥ 0.75

Sub-component 6.b: Evaluating Overall Supply Met by Groundwater

Data Source
      •   Sub-component 6.a

Process
The consideration of overall supply met by groundwater (percent) as a component of the SGMA 2019
Basin Prioritization used the same methods and updated data relative to the CASGEM 2014 Basin
Prioritization.

After developing the total groundwater volume for the groundwater basin (see sub-component 6.a –
Evaluation of Volume of Groundwater Use), the percentage of groundwater supply was derived as the
ratio of total groundwater volume to total water use.

Step 1 – Calculate Total Groundwater Use: Agricultural groundwater use was added to urban
groundwater use to determine the total groundwater use for each basin (sub-component 6.a, Part C).

Step 2 – Calculate Total Water Use: Agricultural applied water (surface water and groundwater) was
added to urban total supply (surface water and groundwater) to determine total water used within each
basin.

Step 3 – Calculate Percent of Total Water Supply Met by Groundwater: Total groundwater used
(Step 1) was divided by total water used (Step 2) to calculate the groundwater portion of the total water
supply.

Table 7 lists the points and associated ranges of percent of total water supply met by groundwater.

16            Sustainable Groundwater Management Act 2019 Basin Prioritization | Process and Results
Table 7 Component 6.b: Points and Ranges for Percent of Total Water Supply Met by Groundwater
Total Supply Met by Groundwater
Points
(x = Groundwater Percent)
0 x=0
1 0 < x < 20
2 20 ≤ x < 40
3 40 ≤ x < 60
4 60 ≤ x < 80
5 x ≥ 80
Calculating the Total Priority Points for Groundwater Reliance
Priority Points for the degree to which persons overlying the basin rely on groundwater as their primary
source of water was calculated by averaging the points for groundwater volume density (6.a) and percent
of total water supply met by groundwater (6.b).
Average (6.a Points + 6.b Points) = Priority Points
Component 7: Any documented impacts on the groundwater within the
basin or subbasin, including overdraft, subsidence, saline intrusion, and
other water quality degradation 15
Documented impacts on groundwater were analyzed for the SGMA 2019 Basin Prioritization using
updated data and methods relative to the CASGEM 2014 Basin Prioritization. The CASGEM 2014 Basin
Prioritization treated all four of the sub-components (overdraft, subsidence, saline intrusion, and other
water quality degradation) as a single impact and assigned up to five priority points to the basin based on
the effect of the combined documented impacts. The SGMA 2019 Basin Prioritization included separate
evaluation of documented groundwater impacts for each of the four sub-components. Points were
assigned based on the presence or absence of documented impacts for each sub-category, with the
exception of water quality degradation for which points were assigned based on the magnitude and extent
of the reported contaminant levels. The updated process is summarized below and described in detail in
the following sections.
Each of the four sub-components of component 7 were assigned different maximum points based on the
nature of the impact, and whether the impact was susceptible to avoidance or remediation through
sustainable groundwater management practices, as follows:
• Basins with declining groundwater levels were assigned 7.5 points.
• Basins with current inelastic subsidence were assigned 10.0 points; basins with only historical
inelastic subsidence were assigned 3.0 points.
• Basins with saline intrusion were assigned 5.0 points.
• Basins with water quality measurements that exceed maximum contaminant levels (MCLs)
15
Water Code Section 10933(b)(7)
Sustainable Groundwater Management Act 2019 Basin Prioritization | Process and Results 17California Department of Water Resources
were assigned 1.0 to 3.0 points.
Sub-component 7.a: Documented Overdraft or Groundwater Level Decline
Data Source
Declining groundwater levels were evaluated by reviewing groundwater level data published over the last
20 years. Evaluation also consisted of reviewing available hydrographs; groundwater management plans;
annual reports, such as from watermasters and urban water districts; grant applications submitted to
DWR; professional studies; Bulletin 118 – Update 2003; California Water Plan Update 2013 (California
Department of Water Resources 2015); Alternatives submitted pursuant to SGMA; and published
environmental documents.
Process
Based on available groundwater level data, hydrographs, or similar data for each basin, groundwater
levels were classified as being stable, rising, or declining. To make this determination, each piece of data
was viewed back in time as far as possible. In many cases, data limited the review time frames to six to
ten years, while other data extended back 20 years or more. The entire basin did not have to show
declining groundwater levels to be classified as having declining groundwater levels. In most cases,
multiple hydrographs were used to support the overall basin determination concerning the status of
groundwater levels.
Basins that exhibited declining groundwater levels were assigned 7.5 points.
Sub-component 7.b: Documented Subsidence
Data Source
Evaluation of inelastic subsidence consisted of reviewing hydrographs, extensometer data, and land use
data; groundwater management plans submitted to DWR; annual reports, such as from watermasters and
urban water districts; grant applications submitted to DWR; professional studies, including those from the
NASA Jet Propulsion Laboratory and United State Geological Survey (USGS); Interferometric synthetic
aperture radar via Sentinel-1A satellite maps; University NAVSTAR Consortium (UNAVCO) Plate
Boundary Observatory graphs; Bulletin 118 – Update 2003; California Water Plan Update 2013; and
environmental documents.
Process
Water Code Section 10933(b)(7) identifies inelastic subsidence as one of the four documented impacts
DWR needs to consider under SGMA 2019 Basin Prioritization, to the extent data are available. Inelastic
subsidence data related to groundwater extractions were evaluated to determine if inelastic subsidence
was current or historical. To reach one of these determinations, data was viewed back in time as far as
possible. In many cases the time frames were six to ten years for current conditions, while historical
analyses required going back 20 years or more. When both historical and current inelastic subsidence was
identified, only the current inelastic subsidence was considered for this sub-component.
18 Sustainable Groundwater Management Act 2019 Basin Prioritization | Process and ResultsPoints were assigned based on the status of inelastic subsidence found in the basin:
• Basins with no observed inelastic subsidence were assigned 0 points.
• Basins with current inelastic subsidence were assigned 10 points.
• Basins with only historical inelastic subsidence were assigned 3 points.
Sub-component 7.c: Documented Saline Intrusion
Data Source
Saline intrusion was evaluated by reviewing available data published over the last 20 years. Evaluation
consisted of reviewing hydrographs; groundwater management plans; annual reports, such as from
watermasters and urban water districts; grant applications submitted to DWR; professional studies;
Bulletin 118 – Update 2003; California Water Plan Update 2013; Alternatives submitted pursuant to
SGMA; county hazards reports; and environmental documents.
Process
Saline intrusion in the coastal and Sacramento-San Joaquin Delta groundwater basins, as defined in
Bulletin 118 – Interim Update 2016, was determined by researching available documents for references of
past or current excess salinity problems.
The primary source of information used was local reports and studies that focused on the challenges of
saline intrusion within individual basins. The reports and studies directed at managing or preventing
saline intrusion were related to:
• Water quality analyses.
• Projects designed to stop or reverse current or past intrusions.
• Groundwater management re-operation that reduced or shifted current operations to other parts
of the basin or invested in enhanced groundwater and surface water conjunctive management.
Basins with documented evidence of saline intrusion were assigned 5 points.
Sub-component 7.d: Documented Water Quality Degradation
Data Source
• SWRCB, Division of Drinking Water – Public Supply Database, all active wells (March 2016)
• SWRCB – GeoTracker Groundwater Ambient Monitoring and Assessment (GAMA) secure
database (Division of Drinking Water, reported Water Quality results (as of April 4, 2017)
• SWRCB – Maximum Contaminant Level (MCL) list (as of November 2017)
Process
The SGMA 2019 Basin Prioritization followed a multi-part process to analyze water quality degradation
in a basin. Initially, the water quality data maintained by the SWRCB Division of Drinking Water was
used to conduct a statewide assessment of a range of water quality constituents. Data were analyzed using
Sustainable Groundwater Management Act 2019 Basin Prioritization | Process and Results 19California Department of Water Resources
the following methods:
• Water quality testing data were queried statewide in the GeoTracker GAMA secure database
(State Water Resources Control Board 2017) for each constituent with a MCL (Appendix 3).
• Data with a sample date between January 1, 2000 and April 4, 2017 and a recorded constituent
concentration were included in the evaluation.
• Each water quality sample record was assigned to a groundwater basin as defined in Bulletin
118 – Interim Update 2016 using the well location data associated with each sample record in
the GeoTracker GAMA database.
• Constituent concentrations were compared to MCLs, secondary MCLs, and Public Health
Goals as defined in the California Code of Regulations Title 22 Division 4 Chapter 15. Records
with instances of constituent concentrations that exceeded water quality criteria were retained
for further evaluation.
Data were evaluated for both the magnitude of documented groundwater contamination and prevalence of
impact to public drinking water and assigned points as described in sub-components 7.d.1 and 7.d.2,
below. The next step in the analysis was to determine whether the basin had one or more of the
documented impacts identified in component 7 (i.e. subsidence, declining groundwater levels, and saline
intrusion), which are relevant because of the potential to exacerbate water quality degradation in the
basin. The purpose of this analysis was to only include water quality impacts that are redressable through
sustainable groundwater management practices.
Sub-component 7.d.1: Evaluating the Magnitude of Documented Groundwater
Contamination
To compare the magnitude of groundwater contamination across multiple constituents with varying MCL
values, the relative MCL exceedance was calculated for each sample record that exceeded the MCL
value.
Step 1 – Calculate Relative MCL Exceedance for Each Constituent: The relative MCL exceedance
was calculated by dividing the measured constituent concentration by the regulatory MCL value. For
example, a data value that exceeded the regulatory MCL value by twice the limit would have a relative
MCL exceedance of two.
Step 2 – Calculate Average Relative MCL Exceedance for Each Basin: For each basin, relative MCL
exceedances for all constituents were averaged to generate an average relative MCL exceedance for the
entire basin.
Table 8 lists the points and associated ranges of average relative MCL exceedance values for sub-
component 7.d.1.
20 Sustainable Groundwater Management Act 2019 Basin Prioritization | Process and ResultsYou can also read