Bursting Bubble in a Viscoplastic Medium
←
→
Page content transcription
If your browser does not render page correctly, please read the page content below
This draft was prepared using the LaTeX style file belonging to the Journal of Fluid Mechanics   1

                                                     Bursting Bubble in a Viscoplastic Medium
arXiv:2101.07744v1 [physics.flu-dyn] 19 Jan 2021

                                                             Vatsal Sanjay1 †, Detlef Lohse1,2 and Maziyar Jalaal3,4 ‡
                                                            1
                                                             Physics of Fluids Group, Max Planck Center for Complex Fluid Dynamics,
                                                                  MESA+ Institute and J.M. Burgers Center for Fluid Dynamics,
                                                              University of Twente, P.O. Box 217, 7500 AE Enschede, the Netherlands
                                                       2
                                                         Max Planck Institute for Dynamics and Self-Organisation, 37077 Göttingen, Germany
                                                      3
                                                        Department of Applied Mathematics and Theoretical Physics, University of Cambridge,
                                                                               Cambridge CB3 0WA, United Kingdom
                                                     4
                                                       Van der Waals–Zeeman Institute, Institute of Physics, University of Amsterdam, 1098XH
                                                                                   Amsterdam, The Netherlands

                                                                                 (Received xx; revised xx; accepted xx)

                                                   When a rising bubble in a Newtonian liquid hits the liquid-air interface, it can burst,
                                                   leading to the formation of capillary waves and a jet on the surface. Here, we numerically
                                                   study this phenomenon in a yield stress fluid. We show how viscoplasticity controls the
                                                   fate of these capillary waves and their interaction at the bottom of the cavity. Unlike
                                                   Newtonian liquids, the free surface converges to a non-flat final equilibrium shape once
                                                   the driving stresses inside the pool fall below the yield stress. Details of the dynamics,
                                                   including the flow’s energy budgets, are discussed. The work culminates in a regime map
                                                   with four main regimes with different characteristic behaviours.

                                                   Key words:

                                                   1. Introduction
                                                     Bubble bursting processes abound in nature and technology and have been stud-
                                                   ied for long in fluid mechanics (Liger-Belair et al. 2008). For example, they play a
                                                   vital role in transporting aromatics from champagne (Liger-Belair 2012; Vignes-Adler
                                                   2013; Ghabache et al. 2014, 2016), and pathogens from contaminated water (Poulain
                                                   & Bourouiba 2018; Bourouiba 2021). The process is also responsible for forming sea
                                                   spray due to ejecting myriads of droplets (MacIntyre 1972; Singh & Das 2019). Bursting
                                                   bubbles also play an important role in geophysical phenomena such as volcanic eruptions
                                                   (Gonnermann & Manga 2007).
                                                     In Newtonian liquids, the bubble bursting mechanism is controlled by buoyancy,
                                                   surface tension, and viscosity. First, the air bubble (Figure 1(a)) being lighter than the
                                                   surrounding medium, rises and approaches the liquid-air interface (Figure 1(b)). The
                                                   thin film between the bubble and the free surface then gradually drains (Toba 1959;
                                                   Princen 1963) and eventually ruptures, resulting in an open cavity (Figure 1(c), Mason
                                                   (1954)). The collapse of this cavity leads to a series of rich dynamical processes that
                                                   involve capillary waves (Zeff et al. 2000; Duchemin et al. 2002) and may lead to the
                                                   formation of Worthington jet (Gordillo & Rodrı́guez-Rodrı́guez 2019). In some cases,
                                                   the jet might break via a Rayleigh-Plateau instability, forming droplets (Ghabache et al.
                                                                     † Email address for correspondence: vatsalsanjay@gmail.com
                                                                        ‡ Email address for correspondence: m.jalaal@uva.nl
2 V. Sanjay, D. Lohse and M. Jalaal
Gas Bubble
δ
Gas
1
R0
Liquid
(a) (b) (c)
Figure 1. Schematics for the process of a bursting bubble: (a) A gas bubble in bulk. (b) The
bubble approaches the free surface forming a liquid film (thickness δ) between itself and the free
surface. (c) A bubble cavity forms when the thin liquid film disappears.
2014; Ghabache & Séon 2016). The phenomenon is so robust that it even occurs in soft
granular matter, when a rising bubble also bursts at the surface, leading to a granular
jet (Lohse et al. 2004).
The earlier work on bursting bubbles used Boundary Integral Methods in an in-
viscid limit (Boulton-Stone & Blake 1993; Longuet-Higgins & Oguz 1995). However,
the progress in the Direct Numerical Simulation (DNS) tools for multiphase flows
(Tryggvason et al. 2011; Popinet 2003, 2009) has resulted in models that consider the
effects of viscosity. In fact, some recent studies revealed how liquid’s viscosity determines
the fate of the bursting bubbles (Deike et al. 2018; Gordillo & Rodrı́guez-Rodrı́guez 2019).
For Newtonian liquids, Deike et al. (2018) have provided quantitative cross-validation of
the numerical and experimental studies. They have also given a complete quantitative
description of the influence of viscosity, gravity, and capillarity on the process, extending
the earlier work of Duchemin et al. (2002). More recently, the experiments and simulations
are complemented by theoretical frameworks (Gordillo & Rodrı́guez-Rodrı́guez 2019;
Gañán-Calvo 2017), resulting in a profound understanding of the physics of bubble
bursting in Newtonian fluids. Appendix B provides more details on the previous studies
in the Newtonian limit and compares our results with those available in the literature.
Notably, despite many applications, such as in the food industry and geophysics,
the influence of rheological properties on the collapse of bubble cavities is yet to be
understood. Here, we study the dynamics of bursting bubbles in a viscoplastic medium
using Direct Numerical Simulations (DNS). Viscoplastic or yield stress fluids manifest a
mix of solid and fluid behaviour. The materials behave more like an elastic solid below
critical stress (yield stress); however, they flow like a viscous liquid above this critical
stress. Readers can find detailed reviews on yield stress fluids in Bird et al. (1983);
Coussot (2014); Balmforth et al. (2014); Bonn et al. (2017).
Previous experiments and simulations have been reported for trapped bubbles in a
viscoplastic medium (Dubash & Frigaard 2004; Sun et al. 2020; De Corato et al. 2019),
rising bubbles in yield stress fluids (Sikorski et al. 2009; Tripathi et al. 2015; Lopez
et al. 2018; Singh & Denn 2008; Dimakopoulos et al. 2013; Tsamopoulos et al. 2008;
Mougin et al. 2012), and bubbles moving inside tubes filled with viscoplastic fluids (Jalaal
& Balmforth 2016; Laborie et al. 2017; Zamankhan et al. 2018). We will show that
the introduction of non-Newtonian properties can significantly influence the bursting
behaviour of bubbles on a free surface. At moderate values of yield stress, the collapse of
the cavity can still lead to the formation of a Worthington jet, but the droplet formation
might be suppressed. At high yield stress values, the unyielded region of the viscoplastic
fluid can seize the collapse of this cavity, which leads to distinct final crater shapes.Bursting Bubble in a Viscoplastic Medium 3
The paper is organized as follows: § 2 describes the problem and the governing
parameters. § 3 provides a phenomenological analysis, and § 4 presents the different
modes of energy transfer during the viscoplastic bursting process. § 5 presents the final
equilibrium shapes. The work culminates in § 6 where we summarize the different regimes
observed in the process of bursting in a phase diagram. The paper ends with conclusions
in § 7.
2. Numerical framework & problem description
2.1. Governing equations
We consider the burst of a small axisymmetric bubble at a surface of an incompressible
Bingham fluid. To nondimensionalise the governing equations, we remove the length and
velocity scales using the initial bubble radius R0 , and inertia-capillary velocity Vγ , scales,
respectively. Pressure and stresses are scaled with the characteristic capillary pressure
(see appendix A). The dimensionless equations for mass and momentum conservation,
for the liquid phase, then read
∇ · u = 0, (2.1)
∂u
+ ∇ · (uu) = −∇p + ∇ · τ − Bo êZ , (2.2)
∂t
where u is the velocity vector, t is time, p is the pressure and τ represents the deviatoric
stress tensor. We use the regularized Bingham model with
J
τ = 2 min + Oh, Ohmax D, (2.3)
2kDk
where kDk is the second invariant of the deformation rate tensor, D, and Ohmax
is the viscous regularisation parameter. The three dimensionless numbers controlling
the equations above are the capillary-Bingham number (J ), which accounts for the
competition between the capillary and yield stresses, the Ohnesorge number (Oh) that
compares the inertial-capillary to inertial-viscous time scales, and the Bond number (Bo),
which compares gravity and surface tension forces:
τy R0 µl ρl gRo2
J = , Oh = √ , Bo = . (2.4)
γ ρl γR0 γ
Here, γ is the liquid-gas surface tension coefficient, and τy and ρl are the liquid’s yield
stress and density, respectively. Next, µl is the constant viscosity in the Bingham model.
Note that in our simulations, we also solve the fluid’s motion in the gas phase, using a
similar set of equations (see appendix A). Hence, the further relevant non-dimensional
groups in addition to those of equations of equation (2.4) are the ratios of density
(ρr = ρg /ρl ) and viscosity (µr = µg /µl ). In the present study, these ratios are kept fixed
at 10−3 and 2 × 10⁻² , respectively.
2.2. Method
For our calculations, we use the free software program Basilisk C (Popinet & collab-
orators 2013–2020; Popinet 2015). The code uses a Volume of Fluid (VoF) technique
(Tryggvason et al. 2011) to track the interface, introducing a concentration field that
satisfies the scalar advection equation. Hence, equations (2.1) - (2.3) and their counter-
parts for the gas phase are solved using the one-fluid approximation, where the surface4 V. Sanjay, D. Lohse and M. Jalaal
tension acts as a body force only at the gas-liquid interface (Brackbill et al. 1992; Popinet
2009). Basilisk C also provides Adaptive Mesh Refinement (AMR). We use this feature
to minimize errors in the VoF tracer and interface curvature. Additionally, we also refine
based on velocity and vorticity fields to accurately resolve the regions of low strain rates.
For AMR, we use a grid resolution such that the minimum cell size is ∆ = R0 /512,
which implies that to get similar results, one will need 512 cells across the bubble radius
while using uniform grids. We have also carried out extensive grid independence studies
to ensure that changing the grid size does not influence the results. Moreover, we employ
free-slip and no-penetration boundary conditions for both liquid and gas at the domain
boundaries. These boundaries are far away from the bubble (size of the domain is 8R0 )
such that they do not influence the process.
Note that our numerical method uses a regularized form of the Bingham constitutive
equations (see equation (2.3) and Appendix A). Hence, we cannot resolve the exact
position of the yield surface as kDk is never precisely zero. However, we can safely assume
that low values of kDk will be associated with the plastic regions. In our simulations,
Ohmax = 108 . We have ensured that our results are independent of this regularisation
parameter. The regularization of the constitutive model also forces us to choose a criteria
for the stoppage time, ts . In our simulations, we consider a significantly small cut-off
kinetic energy to stop the simulations (see appendix D for details).
2.3. Initial Condition
This initial shape of a bubble at a fluid-fluid interface (Figure 1(b)) can be calculated
by solving the Young-Laplace equations to find the quasi-static equilibrium state for
an arbitrary Bond number, Bo (see Lhuissier & Villermaux (2012); Walls et al. (2015);
Deike et al. (2018); Magnaudet & Mercier (2020)). As a starting point, this study only
concerns the limit of Bo → 0, i.e., when capillary effects dominate the gravitational ones.
We choose Bo = 10−3 for all the simulations in this work. For this value, the initial
bubble is nearly spherical. Following the common assumption in these types of problems
(Deike et al. 2018; Gordillo & Rodrı́guez-Rodrı́guez 2019), we assume that the thin liquid
cap of thickness δ (Figure 1(b)) disappears at t = 0, resulting in the configuration shown
in Figure 1(c), i.e. the initial condition for our simulations. In Figure 1(c), Hi ≈ 2 is the
initial bubble depth, and θi is the initial location of the cavity-free surface intersection.
Note that the curvature diverges at this intersection in such a configuration. We fillet
this corner to circumvent this singularity, introducing a rim with a finite curvature that
connects the bubble to the free surface. We ensured that the curvature of the rim is high
enough such that the subsequent dynamics are independent of its finite value.
3. Effects of yield stress on the bursting bubble
3.1. Phenomenology
This section describes the dynamics of bursting bubbles and the qualitative effects of
the capillary-Bingham number (J ). Figure 2 illustrates four representative cases for this
purpose (videos are available in the supplementary material). For a Newtonian liquid
(Figure 2(a), J = 0), the retraction of the rim leads to the formation of capillary waves.
Part of these waves travels away from the cavity, forming regions of small strain rates
(black dots in Figure 2(a): t = 0.45), which are advected with the train of capillary waves.
Meanwhile the other part of the waves travel down the cavity (Figure 2(a): t = 0.1) and
focuses on the cavity’s bottom (Figure 2(a): t = 0.45). Consequently, a Worthington jet
is formed as depicted in Figure 2(a): t = 0.65. Furthermore, due to the conservation ofBursting Bubble in a Viscoplastic Medium 5
3 (a)
2
1 Rim 0 5 -3 3
0
-1
-2 t = 0.10 t = 0.45 t = 0.65 t = 4.00
3 (b)
2
1
0
-1
-2 t = 0.10 t = 0.50 t = 1.00 t 4.00
3 (c)
2
1
0
-1
-2 t = 0.10 t = 0.25 t = 0.80 t 1.60
3 (d)
2
1
0
-1
-2 t = 0.10 t = 0.25 t = 0.50 t 0.75
-3 -2 -1 0 1 2 3 -3 -2 -1 0 1 2 3 -3 -2 -1 0 1 2 3 -3 -2 -1 0 1 2 3
Figure 2. Bursting bubble dynamics for different capillary-Bingham numbers. (a) J = 0.0:
A typical case with a Newtonian liquid medium, (b) J = 0.1: A weakly viscoplastic liquid
medium in which the process still shows all the major characteristics of the Newtonian liquid,
(c) J = 0.5: A case of moderate yield stress whereby the jetting is suppressed, nonetheless
the entire cavity still yields, and (d) J = 1.0: A highly viscoplastic liquid medium whereby a
part of the cavity never yields. The left part of each panel shows the magnitude of the velocity
field, and the right part shows the magnitude of the deformation tensor on a log10 scale. The
transition to the black region (low strain rates) marks the yield-surface location in the present
study. The time instances in this figure are chosen to show significant events throughout the
process of bursting bubbles for different J numbers. For all the cases in this figure, Oh = 10−2 .
Videos (S1 - S4) are available in the supplementary material.
momentum, a high-velocity jet is also formed opposite to this Worthington jet inside the
liquid pool (Figure 2(a): t = 0.65). The Worthington jet can then break into multiple
droplets due to the Rayleigh-Plateau instability (Walls et al. 2015). In the Newtonian
limit, the flow continues until the free surface is fully flat, when the surface energy is
minimized (Figure 2(a): t = 4.00).
The introduction of the yield stress, in general, slows down the flow due to a larger
apparent viscosity. Remarkably, even at large yield stresses, the early time dynamics
near the retracting rim, remain unchanged due to the highly curved interface, as clearly
shown in the first panels (t = 0.1) of figure 2 (a-d). On the contrary, the anatomy of
the flow inside the pool is considerably affected due to the yield stress. At low yield
stresses (J = 0.1 in Figure 2(b): t = 0.1), everywhere near the bubble cavity yields at6 V. Sanjay, D. Lohse and M. Jalaal
early times. However, as the values of capillary-Bingham number increases, the size of
the yielded region decreases (J = 0.5 & J = 1.0 in Figures 2(c) and 2(d), respectively).
Furthermore, at low values of J , the flow focusing at the bottom of the cavity persists
(Figure 2(b): t = 0.50), although, due to the increased dissipation, it is less vigorous. As
a result, the jet formed post-collapse is thicker, slower, and less prominent (Figure 2(b):
t = 1.00) as compared to the Newtonian case (Figure 2(a): t = 0.65). Notably, for small
values of J , the Worthington jet still forms and breaks up into droplets as a result of
the Rayleigh-Plateau instability.
Note that unlike for the Newtonian case where the final shape is always a flat free-
surface, a viscoplastic medium (i.e., finite J ) comes to a halt when stress inside the liquid
drops below the yield stress. Hence, the final state can feature non-zero surface energy
(Figure 2(b): t = 0.65).
At higher values of J , the capillary waves are so damped that flow focusing at the
bottom of the cavity vanishes. At moderate J numbers (Figure 2(c) where J = 0.5),
the capillary waves are still strong enough to travel over the entire cavity (Figure 2(c):
t = 0.25 − 0.80). As a result, the entire cavity yields, nonetheless, the final shape still
features a deep crater (Figure 2(c): t = 1.60). On further increasing J such that yield
stress is as strong as the capillary stress (τy ∼ γ/R0 , i.e., J ∼ O (1)), the capillary waves
do not yield the entire cavity (Figure 2(c): t = 0.25 − 0.75). Hence, the final shape
furnishes a deep crater that stores a large surface energy, contrary to the final shapes at
small J values.
In this section, we mainly focus on the effect of yield stress (via J ) on the process of
bursting bubbles. Appendix C contains the discussion on the effect of Oh. Furthermore, in
the subsequent sections, we will discuss the features explained above in more quantitative
details. § 3.2 and § 3.3 then delineate the travelling capillary waves and the subsequent
jet formation (or lack of it), respectively.
3.2. Capillary waves in the presence of yield stress
Capillary waves are critical in the bubble bursting process (Gordillo & Rodrı́guez-
Rodrı́guez 2019). Initially, the breakage of the film and the retraction of the rim create a
train of capillary waves of varying strengths (Gekle et al. 2009). However, sharper waves
experience very high viscous dampening. As a result, the wave focusing and jet formation
are controlled by the strongest wave, which is not ceased by viscous damping. We follow
Gordillo & Rodrı́guez-Rodrı́guez (2019) and track the strongest wave by chasing the
maximum curvature of the free surface wave (kκc k). The location of this wave, on the
cavity, is denoted by the angular position, θc (see inset in Figure 3(a)).
For a Newtonian liquid (J = 0), at low Ohnesorge numbers (e.g., Figure 3), the
strongest capillary wave propagates at a constant velocity Vγ , dashed line in Figure 3(a)).
The viscous stress attenuates these waves but does not influence θc . Previous studies
(Krishnan et al. 2017; Gordillo & Rodrı́guez-Rodrı́guez 2019) have found similar results
for Newtonian liquids (see Appendix B for more details). The strength of this wave
decreases as it propagates down the cavity due to continuous viscous dissipation. Around
θc ≈ π/2, the geometry changes leading to flow focusing resulting in an increase in the
strength (κc ) of the wave (see Figure 3(c): t = 0.2 to t = 0.35). This minimum value of κc
non-linearly depends on Oh (see Gordillo & Rodrı́guez-Rodrı́guez (2019) & Appendix B
for details).
As shown in Figure 3(a) and 3(b) (and also discussed in § 3.1), the initial changes
in kθc k and kκc k remain similar to the Newtonian limit, since the highly curved region
near the initial rim retraction fully yields the fluid around it. As the flow develops, the
plasticity effects become more pronounced, and the capillary waves no longer follow theBursting Bubble in a Viscoplastic Medium 7
(a) 1.0 (b) 40
35
0.8
30
0.6 25
κc
20
0.4 15
10
0.2
5
0.0 0
0.0 0.2 0.4 0.6 0.8 1.0 0.0 0.2 0.4 0.6 0.8 1.0
-3 3 (c) (d)
t = 0.05 t = 0.20 t = 0.35 t = 0.50 t = 0.05 t = 0.20 t = 0.35 t 0.75
Figure 3. Effects of viscoplasticity on the traveling capillary waves: (a) Variation of the
location (θc ) of strongest capillary with time. The gray dotted line denotes the Newtonian
limit, θc − θi ∼ −Vγ t as described by Gordillo & Rodrı́guez-Rodrı́guez (2019). (b) Variation
of the strength (kκc k) of the strongest capillary wave with time. Snapshots of the deformation
tensor modulus kDk for (c) J = 0.2, and (d) J = 1.0. For all the cases in this figure, Oh = 10−2 .
Videos (S5 - S7) are available in the supplementary material.
path taken by their Newtonian counterpart. The larger the value of J , the sooner the
dynamics of the capillary waves deviate from the Newtonian limit, and they become
weaker. Eventually, the waves stop at a finite stoppage time, furnishing a finite final θc
and kkc k (represented by θf and kκf k, respectively). In section § 5, we will discuss the
variation of these parameters for the final crater shapes.
3.3. Jet formation in the presence of yield stress
Another interesting feature of the bubble bursting process is the Worthington jet’s
formation as the bubble cavity collapses. To characterize this jet, we track the location
(H) of the interface at the center R = 0. In figure 4(a) shows the temporal variation of H
for different values of J at fixed Oh = 10−2 . As the waves propagate, the cavity begins
to collapse, hence the value of H decreases. A jet forms when the bottom of the cavity
crosses the free surface and H becomes negative (see Figure 4(b)). For small values of
J , the Rayleigh-Plateau instability and a subsequent pinch-off occur, resulting in the
kinks shown in Figure 4(a). The jets eventually retract, and H approaches 0, i.e., a flat
final interface. As the value of J increases, the final value of H increases, approaching
the upper bound of H = Hi = 2, which is set by the initial condition (twice the bubble
radius, i.e., the bottom of the cavity never yields). In fact, for J > 0.65, this value
remains unchanged, meaning the plug region attached to the bottom of the cavity never
yields. Note that, in an intermediate range of J ∼ 0.35, the interplay of the capillary
waves and the yield stress results in a dimple (underdeveloped jet) that never crosses the
free surface (see Figure 4(c)).8 V. Sanjay, D. Lohse and M. Jalaal
(a) (b)
2.0 t = 0.40 t = 0.80 t = 0.81 t 4.00
1.5
-3 3
1.0
0.5
0.0
-0.5
(c)
-1.0
t = 0.65 t = 0.75 t = 1.00 t 1.68
-1.5
-2.0
-2.5 Pinch-off
-3.0
0.0 0.5 1.0 1.5 2.0 2.5 3.0 3.5 4.0
Figure 4. Effects of viscoplasticity on the formation of the jet as a result of the collapsing
cavity: (a) Variation of the depth H of the cavity at its axis with time. The inset shows the
definition of H. Modulus of the deformation tensor kDk for the collapse of the bubble cavity
and formation of the jet for (b) J = 0.1 and (c) J = 0.3. Note that each kink in panel (a) is
associated with the formation of a drop, as illustrated in the insets of the panel (b). For all the
cases in this figure, Oh = 10−2 . Videos (S8 - S10) are available in the supplementary material.
4. What happens to the initial surface energy?
To better understand the bubble bursting dynamics in a viscoplastic medium, we
also looked at the energy budgets. The total energy E is the sum of the total kinetic
energy of the liquid pool Ek , its surface energy Es and the energy dissipation Ed . The
latter contains two parts due to viscous (EdOh ) and yield stress (EdJ ) contributions,
Ed = EdOh + EdJ . Lastly, small energies associated with jet breakup and airflow are
summarized in Em . Hence,
E = Ek (t) + Es (t) + Ed (t) + Em (t) = Ei , (4.1)
where, Ei is the initial energy that is purely the surface energy. Readers are referred to
Appendix D for details for calculating the energy budget.
Figure 5 shows two representative examples of these energy budgets, normalized by
the initial energy Ei . In Figure 5, the time is normalized by the stoppage time ts . Panel
a shows the temporal evolution of different modes of the energy transfer for a low J
number. Initially, at t = 0, the system’s total energy is stored as the bubble cavity’s
surface energy. As the flow starts, a part of this surface energy converts to the kinetic
energy of the flow generated by the travelling capillary waves. The kinetic energy reaches
a maximum when the capillary waves focus at the bottom of the cavity, as the focusing
process forms a region of high velocity. At the instant of focusing, for J = 0.1 & Oh =
10−1 , ∼ 60% of the initial energy is still present in the system as a sum of the kinetic
and surface energy of the liquid pool. Subsequently, the Worthington jet forms and high
dissipation is observed due to an increase in the strain rate (see equation (D 3)). The
surface energy decreases monotonically throughout the process and reaches a finite near-
zero value at the stoppage time ts . This behaviour is different from a Newtonian liquid,
where the surface energy would become exactly zero, as t → ∞.
For J = 1.0 (Figure 5(b)), initially, the surface energy decreases monotonically untilBursting Bubble in a Viscoplastic Medium 9
(a) (b)
1.0
0.8
0.6
0.4
0.2
0.0
0.0 0.2 0.4 0.6 0.8 1.0 0.0 0.2 0.4 0.6 0.8 1.0
(c)
1.0
0.8
0.6
0.4
0.2
0.0
0.1 0.2 0.4 0.6 0.8 1.0 5.0 10.0
Figure 5. Energy budget for the process of the bubble bursting in a viscoplastic medium:
Temporal evolution of the different modes of energy transfers for (a) J = 0.1 & Oh = 10−1 and
(b) J = 1.0 & Oh = 10−2 . (c) Comparison of the energy footprint at the stoppage time, t = ts
for different J and Oh.
it reaches a plateau at t = ts . However, contrary to the example with a small value of J ,
in this case, a major part of the cavity never yields. Consequently, more than 60% of the
initial energy is still stored as the crater’s surface energy. Also note that in the limit of
large J (and low to moderate Oh), yield stress is responsible for the majority of energy
dissipation, i.e., EdOh
EdJ .
The energy footprint at t = ts gives insight into the bubble cavity’s final static shape.
Therefore, we compare these energies for different J and Oh numbers in Figure 5(c). For
all the conditions, Ek → 0, and only surface energy remain in the system at the stoppage
time. Rest of the energy (Ei − Es ) features as dissipation (except for those cases where
drops form and Em is not negligible). For low values of J , the final surface energy Es
is close to zero because the final craters are shallow (see § 5 for details). This residual
surface energy increases with increasing J and Oh; however, the dependency on Oh is10 V. Sanjay, D. Lohse and M. Jalaal
0.5 (a) (b)
0.0
-0.5
-1.0
-1.5
-2.0
0.5 (c) (d)
0.0
-0.5
-1.0
-1.5
-2.0
0.5 (e) (f)
0.0
-0.5
-1.0
-1.5
-2.0
-2.0 -1.0 0.0 1.0 2.0 -2.0 -1.0 0.0 1.0 2.0
Figure 6. Final crater shapes: Variation of the final shapes with the Oh at (a) J = 0.2, (b)
J = 0.4, (c) J = 0.6, (d) J = 1.0, (e) J = 5.0, and (f) J = 10.0.
(a) (b) (c)
Hf /Hi
Figure 7. Quantifying the characteristics of the final shapes as a function of J at different Oh:
(a) Depth Hf of centre-line of the final cavity surface. (b) Location θf and (c) Strength kκf k
of the strongest capillary wave in the final crater. The grey dashed lines in panels b and c are
guides to the eye.
negligible at higher values of J . Lastly, the dissipation due to the yield stress EdJ
contributes more to the overall dissipation for small Oh numbers.Bursting Bubble in a Viscoplastic Medium 11 5. Final crater shapes Previously, we discussed that as t → ∞, instead of forming a flat-free surface, the yield-stress allows the liquids to sustain deformations. This section will look at the final crater shapes we observed in this process. Figure 6 shows the final shapes as observed for different J and Oh numbers, and Figure 7 quantifies the different features of these final shapes by analysing the variation of the location (θf ) and strength (kκf k) of the strongest capillary wave, and the final depth of the crater (Hf ). For the convenience of comparison, we normalize Hf by its initial value Hi ≈ 2, and kκf k is normalized by the initial curvature of the cavity’s bottom kκi k ≈ 2.0. At low values of J , there is an evident effect of Oh on the final shape (Figures 6(a-b), and 7(a): J 6 0.4). As Oh increases, the final cavity height (Hf ) is closer to its initial value, giving Hf ∼ Hi . For higher Oh numbers, the viscous stresses strongly damp the capillary waves. In fact, for Oh > 10−1 , the capillary wave’s amplitude is so close to zero that it becomes impossible to track these waves. Hence, the cavity’s bottom moves very little from its initial position. The same occurs for moderate values of J as well, irrespective of the Oh number, as the effective viscosity is dominated by yield stress (see Figure 6(c)). However, at low J & Oh numbers, the mechanism is different. In this regime, the Worthington jet is formed (see § 3.3 for detailed discussions) which relaxes back towards the flat surface as t → ∞. This jet relaxation results in shallow final cavities. Lastly, for a highly plastic medium, the capillary waves cannot yield the entire cavity. As a result, Hf = Hi for J > 0.65, independent of the values of Oh. For higher Oh, this transition is reached (marginally) earlier (e.g., J > 0.5 for Oh > 1.0). For the cases where the bottom part of the cavity never yields (Figure 6(d) to 6(f)), we can characterize the final shape using the location (θf , Figure 7(b)) and the strength (κf , Figure 7(c)) of the frozen capillary wave. As J increases, the stoppage time ts decreases. As a result, the final angular location of the capillary wave (θf ) is closer to its initial value. Also, the strength κf of this wave decreases with increasing J because the wave gets weaker and is no longer able to yield the cavity. From Figure 7(b) and 7(c), we also notice that for J < 2, an increase in Oh translates to a decrease in the strength of the wave and to conditions where the wave freezes closer to the cavity-free surface intersection. Lastly, For J 1, there is no influence of Oh on the final shape, see for example see Figures 6(e) and 6(f). Also θf and kκf k hardly change with Oh as J > 2 (Figure 7(b) and 7(c)). 6. Regime map In the present study the two crucial control parameters to describe the process of bursting bubbles in a viscoplastic medium are the capillary-Bingham number J , and the Ohnesorge number Oh. In this section, we use these dimensionless numbers to summarize the observed features explained in the text, providing a regime map (or phase diagram). Figure 8 shows this map for the bursting bubble process in a viscoplastic medium. Note that we have run more than 750 simulations to arrive at this regime map, but in figure 8 we only show a few representatives at the transition lines. For Newtonian fluids, the previous studies have found that for Oh > 0.03, viscous stresses dominate over the surface tension, such that the Worthington jet does not break up into droplets (San Lee et al. 2011; Ghabache et al. 2014; Walls et al. 2015). In this work, at J = 0, we have reproduced this transition Oh number (see left axis in figure 8). Increasing J has a similar effect on the jet breakup as it manifests itself as increased apparent viscosity of the liquid. Consequently, even when Oh → 0 the capillary waves
12 V. Sanjay, D. Lohse and M. Jalaal
No Pinch-off
Drops
0 0.1 0.2 0.3 0.4 0.5 0.6 0.7 64
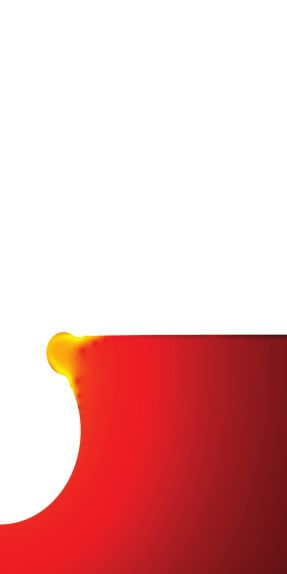
Figure 8. Regime map in terms of the capillary-Bingham number J and the Ohnesorge number
Oh showing the transitions between the different categories identified in the current study. The
insets show a representative case from each of the four regimes, namely formation of jet which
breaks into droplets (blue), formation of jet without droplets (gray), the entire cavity collapses
but the cavity center never crosses the initial pool free surface (white), and a part of the cavity
never yields (red). The symbols represent simulations at the different transition lines.
get severely damped for J > 0.3, and no droplets are formed. The blue area in figure 8
highlights the region in which a Worthington jet forms and disintegrate.
The gray area in figure 8 shows an intermediate regime in which the jet forms and
crosses the free surface line (Z = 0) but does not breakup. This transition, for J = 0,
occurs at Oh ≈ 10−1 . For non-zero J , the transition occurs at a smaller values of Oh as
the jet (if it forms) has less kinetic energy and cannot cross the Z = 0 line.
If the jet does not form (beyond the grey area), the collapse of the cavity results in a
crater. As discussed in § 3.2, if the surface tension stresses are high enough, the whole
cavity yields. Otherwise, for large values of the yield stress (J ∼ O (1)), the plug region
attached to the bottom of the cavity never yields. This transition from a fully yielded
cavity to the cavity with an unyielded bottom is highlighted in Figure 8 with the red
line.
7. Conclusions
In this work, we have studied the capillary driven process of bursting bubbles in a
viscoplastic medium. Like in Newtonian fluids, flow begins when the rim, which connects
the bubble cavity to the free surface, breaks and then retracts. Consequently, the fluid is
yielded, and a train of capillary waves is generated. The yield stress significantly affects
the flow structure inside the pool by making plug regions. The higher the value of the
yield stress, the larger the deviation from the Newtonian counterpart is.
Following the analyses of Deike et al. (2018) and Gordillo & Rodrı́guez-Rodrı́guez
(2019), we provided information on the dynamics of the capillary waves as they travel
down the bubble cavity. In liquids with low yield stresses, the cavity collapse leads to
a Worthington jet that might break up into drops by a Rayleigh-Plateau instability.
However, for liquids with a large yield stress, the jet vanishes. The analysis of the energy
budgets gives insight into the dynamics by showing how the initial surface energy is
dissipated. Eventually, in contrast to the Newtonian fluids, where the final state is alwaysBursting Bubble in a Viscoplastic Medium 13
a flat film, bubble bursting in viscoplastic medium results in final crater shapes with
high residual surface energy. We analysed the geometry of these shapes as a function
of the governing control parameters, namely the Ohnesorge and the capillary-Bingham
numbers. Lastly, we use the same numbers to categorise the four different regimes in
viscoplastic bubble bursting (see the phase diagram in figure 8).
Our study has direct applications in a range of industrial operations, where bubbles
are present at the surface of a yield stress fluids. Moreover, the current results could
be useful in analyzing some geophysical flows, such as those in volcanic eruptions. In
a broader perspective, the work presents a system in which surface tension and yield
stress are the main factors. Such a system is of fundamental interest in design and
manufacturing at small scales when capillary action is competing with the yield stress,
e.g., in 3D printing and coatings polymeric fluids (Rauzan et al. 2018; Nelson et al. 2019;
Jalaal et al. 2019, 2020).
Supplementary data. Supplementary material and movies are available at xxxx
Acknowledgements. We would like to thank Andrea Prosperetti, Arup Kumar Das,
and Stéphaze Zaleski for insightful discussions about the Newtonian limit of bursting
bubble process. We also want to thank Uddalok Sen, Rodrigo Ezeta, and Carola
Seyfert for comments on the manuscript. This work was carried out on the national
e-infrastructure of SURFsara, a subsidiary of SURF cooperation, the collaborative ICT
organization for Dutch education and research.
Funding. The authors acknowledge the ERC Advanced Grant No. 740479-DDDD.
Declaration of Interests. The authors report no conflict of interest.
Author ORCID. V. Sanjay, https://orcid.org/0000-0002-4293-6099; D. Lohse,
https://orcid.org/0000-0003-4138-2255; M. Jalaal https://orcid.org/0000-0002-5654-
8505;
Appendix A. Governing equations
In this appendix, we describe the governing equations that describe the process of
bursting bubbles in a viscoplastic medium. For an incompressible liquid, the continuity
and momentum equations read
∇ · u = 0, (A 1)
∂u
ρl + ∇ · (uu) = −∇p + ∇ · τ + ρl g, (A 2)
∂t
where u is the velocity vector, ρl is the density of the liquid, p is the pressure field,
τ is the stress tensor in liquid, and g is the acceleration due to gravity. We model the
viscoplastic liquid medium as a non-Newtonian Bingham fluid with a yield stress, τy . For
such liquids, the constitutive equation are
(
D =0 kτ k < τy
τy
(A 3)
τ = 2kDk + µl kτ k > τy14 V. Sanjay, D. Lohse and M. Jalaal
(a) (b)
Present Study:
50 Present Study:
Present Study:
Deike et al. (2018)
40 Gordillo &
t = 0.4515
Rodríguez-Rodríguez (2019)
t = 0.5062
30
20
t = 0.4556
10
t = 0.4489 t = 0.5300
-1.0 -0.5 0.0
Figure 9. Characterization of the Worthington jet’s velocity formed as a result of the bursting
bubble process in Newtonian liquids: (a) Variation of the jet’s velocity as it travels through
different axial locations (Oh = 10−2 ). The inset shows the shape of this jet at different time.
The grey dotted line represents the free surface, Z = 0. (b) Comparison of the jet’s velocity
with the data and scaling laws available in the literature for the range of Ohnesorge numbers
used in this study. Note that the scaling law in solid grey line comes from Deike et al. (2018),
whereas the other lines are from Gordillo & Rodrı́guez-Rodrı́guez (2019) as noted in the figure.
T
In the equation above, D = ∇u + (∇u) /2 is the deformation tensor and µl the con-
stant viscosity in the Bingham model. We adopt a regularised revision of equation (A 3)
in our numerical simulations, given by:
τy
τ = 2 min + µl , µmax D (A 4)
2kDk
y τ
In equation (A 4), 2kDk + µl is basically the apparent viscosity (µeff ) of the liquid and
µmax is the “large”regularisation viscosity, such that µeff ← min (µeff , µmax ).
The same sets of mass and momentum conservation equations A 1 – A 2 are also solved
for the gas phase, but now with constant density and viscosity. We use the inertia-
capillary velocity (Vγ ) and inertial-capillary time tγ , and the capillary stress τγ defined
as
s
γ R0 ρl R03
r
Vγ = , tγ = = , (A 5)
ρl R0 Vγ γ
γ
τγ = , (A 6)
R0
to non-dimensionalize above governing equations to find equations (2.1) to (2.4).
Appendix B. The Newtonian limit
One of the essential and widely studied features of the bursting bubble process in a
Newtonian liquid is the resulting Worthington jet’s velocity. This jet is formed because
of the strong flow-focusing caused by the capillary waves at the bubble cavity’s bottom.
In general, this process is very fast, as shown in Figure 9(a). Over a small time span ofBursting Bubble in a Viscoplastic Medium 15
(a) 1.0 (b)
0.8
0.6
0.4
Present Study
0.2
Gordillo & Rodríguez-Rodríguez (2019)
0.0
-0.2 -0.1 0.0 0.1 0.2
Figure 10. (a) Variation of the location θc of the strongest capillary wave with time. The gray
dotted line denotes θc − θi ∼ −Vγ t as described by Gordillo & Rodrı́guez-Rodrı́guez (2019). (b)
Variation of the strength kκ∗c k at θc = π/2 with the Oh numbers. The scaling laws are taken
from Gordillo & Rodrı́guez-Rodrı́guez (2019).
≈ 0.1tγ (see insets of Figure 9), the jet traverses a distance of ≈ 1.5R0 . Moreover, the
inception of this jet is characterized by velocities as high as 50Vγ . This jet’s flow is also
associated with high viscous dissipation (because of the high strain rates resulting from
such high velocities). As a result of these two processes, there is a distinct maximum at
the instant of jet inception (vj,1 ). This velocity could be difficult to calculate, especially
at low Oh numbers because of high-frequency capillary waves. Numerically, it is easiest
to calculate the velocity of the jet as it crosses the free surface, Z = 0 (grey dotted line
in Figure 9(a)). However, in experiments, it is easier to calculate the velocity of the first
droplet that forms as a result of the jet breakup. In the inset of Figure 9(a), the instant
immediately before jet breakup into a droplet gives a velocity of vj,3 . As a result, in
the literature, different authors have reported different jet velocities. We have decided to
plot all three velocities (wherever applicable) in Figure 9(b) along with the scaling laws
proposed by Deike et al. (2018) (grey line) and Gordillo & Rodrı́guez-Rodrı́guez (2019)
(green, red, and blue lines). Our results agree well with the previously published works,
which have been extensively validated with experimental data. Note that the differences
between our data points and those of Gordillo & Rodrı́guez-Rodrı́guez (2019) also arise
because of a slight difference in Bond numbers for the two studies (Bo = 5 × 10⁻² in
Gordillo & Rodrı́guez-Rodrı́guez (2019) as compared to Bo = 10−3 in Deike et al. (2018)
and in the present work). This disagreement is higher for high Oh numbers. Furthermore,
as pointed out by Deike et al. (2018), at lower Bo, the maxima in the vj − Oh plot shifts
to the right with higher velocities, a feature which is distinctly captured by Figure 9(b).
Figure 10(a) shows the temporal evolution of the angular trajectory of the strongest
capillary wave as it travels down the bubble cavity. As predicted by Gordillo & Rodrı́guez-
Rodrı́guez (2019) and shown experimentally by Krishnan et al. (2017), this wave travels at
a constant angular velocity, implying θc − θi ∼ −Vγ t (gray dotted line in Figure 10(a)).
Furthermore, we also compare the strength of this wave with those predicted by the
scaling laws given in Gordillo & Rodrı́guez-Rodrı́guez (2019) and found good agreement
(Figure 10(b)).16 V. Sanjay, D. Lohse and M. Jalaal
(a)
0 5 -3 3
t = 0.10 t = 0.50 t = 1.10 t 3.58
(b)
t = 0.10 t = 0.50 t = 1.00 t 4.00
(c)
t = 0.10 t = 0.50 t = 1.00 t 2.13
(d)
t = 0.10 t = 1.00 t = 2.50 t 18.60
Figure 11. Bursting bubble dynamics for different Ohnesorge numbers: (a) Oh = 10−3 , (b)
Oh = 10−2 , (c) Oh = 10−1 , and (d) Oh = 100 . In the background, the left part of each panel
shows the magnitude of the velocity field and the right part shows the deformation tensor’s
magnitude on a log10 scale. For all the cases in this figure, J = 0.1. Videos (S2 and S11 - S13)
are available in the supplementary material.
Appendix C. The effect of Oh
This appendix describes the dynamics of bursting bubbles and the qualitative effects
of varying Ohnesorge number Oh at given capillary-Bingham number of J = 0.1.
Figure 11 illustrates four representative cases for this purpose. As noted in the text and
several previous studies (Duchemin et al. 2002; Deike et al. 2018; Gordillo & Rodrı́guez-
Rodrı́guez 2019), the initial retraction of the rim forms a train of capillary waves. For low
Ohnesorge numbers, e.g., Oh = 10−3 in Figure 11(a), the viscous dissipation is very small,
and as a result, most of these capillary waves converge at the bottom of the cavity and
result in vigorous surface undulations at the cavity’s bottom (Figure 11(a): t = 0.1−0.50).
These waves result in a thick Worthington jet. As the Oh increases (Oh = 10−2 in
Figure 11(b)), viscous dissipation damps the high-frequency capillary waves and improves
the flow focusing at the cavity’s bottom, leading to thinner and faster jets. This process
is similar to what has been reported in the literature for Newtonian liquids (Duchemin
et al. 2002; Ghabache et al. 2014; Deike et al. 2018). Note that Figure 11(b) is the same
as Figure 2(b) and has been presented again for completeness.
Larger Oh numbers (10−1 & 100 in Figures 11(c) and 11(c), respectively), result inBursting Bubble in a Viscoplastic Medium 17
a longer flow time scales. Nonetheless, at low J numbers (such as 0.1 in Figure 11),
the entire cavity still yields and the center gently approaches the free surface at Z = 0
(Figure 11(b) and 11(c): first three columns). Most of the initial surface energy is lost
as viscous dissipation (both EdOh & EdJ ) and the flow stops as the internal stresses in the
fluid falls below the yield stress (Figure 11(b) and 11(c): last column).
Appendix D. Energy budget calculations
Here, we describe the formulation used to evaluate the different energy transfer modes
discussed in § 4. A similar approach was used by Wildeman et al. (2016) and by Ramı́rez-
Soto et al. (2020) to evaluate the energy budget for impacting droplets and colliding
droplets, respectively. In this work, we have extended the methodology to yield-stress
liquids. The kinetic and the surface energy of the liquid are given by
1
Z
Ek = kuk2 dΩp , (D 1)
2 Ωp
Z
Es = dΓp , (D 2)
Γp
where the energies are normalized by the surface energy γ R02 . The integrals are evaluated
over the volume (Ωp ) and the surface (Γp ) of the biggest liquid continuum in the domain,
disregarding the drops (which are included in the energy budget in a different way
described below). The state of liquid pool with a flat free-surface is taken as the reference
to calculate Es .
The total dissipation in the system is calculated as
!
J
Z Z
2
Ed = 2 Oh + kDk dΩp dt. (D 3)
t Ωp 2kDk
Note that by writing the equation in this form, we assume that the yield stress
contributes to the energy dissipation only through an increase in the effective viscosity
(see Appendix A). In order to isolate the effects of the viscosity and yield-stress associated
viscosity, we can rewrite equation (D 3) as Ed = EdOh + EdJ , where
Z Z !
EdOh = 2 Oh kDk2 dΩp dt, (D 4)
t Ωp
Z Z !
EdJ =J kDk dΩp dt. (D 5)
t Ωp
We present together all other forms of energy as
Z
Em = EkDrops + EsDrops + EdDrops + Bo Z d (Ωp + Ωd ) + Eg . (D 6)
Ωp +Ωd
In equation (D 6), the first two terms, EkDrops & EsDrops denote the kinetic and the
surface energies of the ejected drops, respectively. The third term, EdDrops , is the sum of
the effective dissipation inside the drop. Note that all these three terms are evaluated
like equations D 1 to D 5 with one difference that the volume and surface integrals are
performed over the drops (Ωd and Γd , respectively), instead of over the pool (Ωp and Γp ,
respectively). The next term evaluates the gravitational potential energy for the liquid18 V. Sanjay, D. Lohse and M. Jalaal
(both the pool and the drops). As Bo → 0, this term is insignificant. Lastly, Eg denotes
the sum of energies stored in the gas medium and viscous dissipation due to velocity
gradients inside it:
!
kvk2
Z Z Z
2
Eg = ρr + Bo Z dΩg + 2µg Oh kDk dΩg dt. (D 7)
Ωg 2 t Ωg
Em (equation (D 6)) is only significant when the resultant Worthington jet leads to the
formation of droplets (Figure 5(c)).
Another important consequence of a yield stress is a finite stoppage time. The flow
in a liquid will stop if the stress falls below the yield stress. This implies that kDk
should vanish. Since we use a regularisation method, the flow in our simulations never
really stops (it flows with Ohmax ). Hence, we consider a cut-off kinetic energy of
10−6 × max(Ek ). RWe stop the simulation when the total kinetic energy of the sys-
tem EkTotal = 0.5 Ω kuk2 + ρr kvk2 dΩ is below the cut-off. This analysis gives an
estimate of the stoppage time, ts . However, as clear from our results like those shown
in Figure 2, beyond a certain time, the flow dynamics are too slow for any macroscopic
change in the location or the strength of capillary waves, or the shape of the final cavity.
Appendix E. Code Availability
The codes used in the present article are permanently available at Sanjay (2020).
REFERENCES
Balmforth, N. J., Frigaard, I. A. & Ovarlez, G. 2014 Yielding to stress: recent
developments in viscoplastic fluid mechanics. Annu. Rev. Fluid Mech. 46, 121–146.
Bird, R. B., Dai, G. C. & Yarusso, B. J. 1983 The rheology and flow of viscoplastic materials.
Rev. Chem. Eng. 1 (1), 1–70.
Bonn, D., Denn, M. M., Berthier, L., Divoux, T. & Manneville, S. 2017 Yield stress
materials in soft condensed matter. Rev. Mod. Phys. 89 (3), 035005.
Boulton-Stone, J. M. & Blake, J. R. 1993 Gas bubbles bursting at a free surface. J. Fluid
Mech. 254, 437–466.
Bourouiba, L. 2021 The fluid dynamics of disease transmission. Annu. Rev. Fluid Mech. 53,
473–508.
Brackbill, J. U., Kothe, D. B. & Zemach, C. 1992 A continuum method for modeling
surface tension. J. Comput. Phys. 100 (2), 335–354.
Coussot, P. 2014 Yield stress fluid flows: A review of experimental data. J. Non-Newton. Fluid
Mech. 211, 31–49.
De Corato, M., Saint-Michel, B., Makrigiorgos, G., Dimakopoulos, Y., Tsamopoulos,
J. & Garbin, V. 2019 Oscillations of small bubbles and medium yielding in
elastoviscoplastic fluids. Phys. Rev. Fluids 4 (7), 073301.
Deike, L., Ghabache, E., Liger-Belair, G., Das, A. K., Zaleski, S., Popinet, S. & Séon,
T. 2018 Dynamics of jets produced by bursting bubbles. Phys. Rev. Fluids 3 (1), 013603.
Dimakopoulos, Y., Pavlidis, M. & Tsamopoulos, J. 2013 Steady bubble rise in herschel–
bulkley fluids and comparison of predictions via the augmented lagrangian method with
those via the papanastasiou model. J. Non-Newton. Fluid Mech. 200, 34–51.
Dubash, N. & Frigaard, I. 2004 Conditions for static bubbles in viscoplastic fluids. Phys.
Fluids 16 (12), 4319–4330.
Duchemin, L., Popinet, S., Josserand, C. & Zaleski, S. 2002 Jet formation in bubbles
bursting at a free surface. Phys. Fluids 14 (9), 3000–3008.
Gañán-Calvo, A. M. 2017 Revision of bubble bursting: Universal scaling laws of top jet drop
size and speed. Phys. Rev. Lett. 119 (20), 204502.Bursting Bubble in a Viscoplastic Medium 19
Gekle, Stephan, Gordillo, José Manuel, van der Meer, Devaraj & Lohse, Detlef
2009 High-speed jet formation after solid object impact. Phys. Rev. Lett. 102 (3), 034502.
Ghabache, E., Antkowiak, A., Josserand, C. & Séon, T. 2014 On the physics of fizziness:
How bubble bursting controls droplets ejection. Phys. Fluids 26 (12), 121701.
Ghabache, E., Liger-Belair, G., Antkowiak, A. & Séon, T. 2016 Evaporation of droplets
in a champagne wine aerosol. Sci. Rep. 6, 25148.
Ghabache, E. & Séon, T. 2016 Size of the top jet drop produced by bubble bursting. Phys.
Rev. Fluids 1 (5), 051901.
Gonnermann, H. M. & Manga, M. 2007 The fluid mechanics inside a volcano. Annu. Rev.
Fluid Mech. 39, 321–356.
Gordillo, J. M. & Rodrı́guez-Rodrı́guez, J. 2019 Capillary waves control the ejection of
bubble bursting jets. J. Fluid Mech. 867, 556–571.
Jalaal, M. & Balmforth, N. J. 2016 Long bubbles in tubes filled with viscoplastic fluid. J.
Non-Newton. Fluid Mech. 238, 100–106.
Jalaal, M., Schaarsberg, M. K., Visser, C.-W. & Lohse, D. 2019 Laser-induced forward
transfer of viscoplastic fluids. J. Fluid Mech. 880, 497–513.
Jalaal, Maziyar, Stoeber, Boris & Balmforth, Neil 2020 Spreading of viscoplastic
droplets. arXiv preprint arXiv:2010.02894 .
Krishnan, S., Hopfinger, E. J. & Puthenveettil, B. A. 2017 On the scaling of jetting
from bubble collapse at a liquid surface. J. Fluid Mech. 822, 791.
Laborie, B., Rouyer, F., Angelescu, D. E. & Lorenceau, E. 2017 Yield-stress fluid
deposition in circular channels .
Lhuissier, H. & Villermaux, E. 2012 Bursting bubble aerosols. J. Fluid Mech. 696, 5–44.
Liger-Belair, G. 2012 The physics behind the fizz in champagne and sparkling wines. Eur.
Phys. J. Spec. Top. 201 (1), 1–88.
Liger-Belair, G., Polidori, G. & Jeandet, P. 2008 Recent advances in the science of
champagne bubbles. Chem. Soc. Rev. 37 (11), 2490–2511.
Lohse, D., Bergmann, R., Mikkelsen, R., Zeilstra, C., van der Meer, D., Versluis,
M., van der Weele, K., van der Hoef, M. & Kuipers, H. 2004 Impact on soft sand:
void collapse and jet formation. Phys. Rev. Lett. 93 (19), 198003.
Longuet-Higgins, M. S. & Oguz, H. 1995 Critical microjets in collapsing cavities. J. Fluid
Mech. 290, 183–201.
Lopez, W. F., Naccache, M. F. & de Souza Mendes, P. R. 2018 Rising bubbles in yield
stress materials. J. Rheol. 62 (1), 209–219.
MacIntyre, F. 1972 Flow patterns in breaking bubbles. J. Geophys. Res. 77 (27), 5211–5228.
Magnaudet, J. & Mercier, M. J. 2020 Particles, drops, and bubbles moving across sharp
interfaces and stratified layers. Annu. Rev. Fluid Mech. 52, 61–91.
Mason, B. J. 1954 Bursting of air bubbles at the surface of sea water. Nature 174 (4427), 470.
Mougin, N., Magnin, A. & Piau, J.-M. 2012 The significant influence of internal stresses on
the dynamics of bubbles in a yield stress fluid. J. Non-Newton. Fluid Mech. 171, 42–55.
Nelson, A. Z., Schweizer, K. S., Rauzan, B. M., Nuzzo, R. G., Vermant, J. & Ewoldt,
R. H. 2019 Designing and transforming yield-stress fluids. Curr. Opin. Solid State Mater.
Sci. 23 (5), 100758.
Popinet, S. 2003 Gerris: a tree-based adaptive solver for the incompressible euler equations in
complex geometries. J. Comput. Phys. 190 (2), 572–600.
Popinet, S. 2009 An accurate adaptive solver for surface-tension-driven interfacial flows. J.
Comput. Phys. 228 (16), 5838–5866.
Popinet, S. 2015 A quadtree-adaptive multigrid solver for the serre–green–naghdi equations.
J. Comput. Phys. 302, 336–358.
Popinet, S. & collaborators 2013–2020 Basilisk. http://basilisk.fr (Last accessed:
November 30, 2020).
Poulain, S. & Bourouiba, L. 2018 Biosurfactants change the thinning of contaminated
bubbles at bacteria-laden water interfaces. Phys. Rev. Lett. 121 (20), 204502.
Princen, H. M. 1963 Shape of a fluid drop at a liquid-liquid interface. J. Colloid Sci. 18 (2),
178–195.
Ramı́rez-Soto, O., Sanjay, V., Lohse, D., Pham, J. T. & Vollmer, D. 2020 Lifting a20 V. Sanjay, D. Lohse and M. Jalaal
sessile oil drop from a superamphiphobic surface with an impacting one. Sci. Adv. 6 (34),
eaba4330.
Rauzan, B. M., Nelson, A. Z., Lehman, S. E., Ewoldt, R. H. & Nuzzo, R. G. 2018
Particle-free emulsions for 3d printing elastomers. Adv. Funct. Mater. 28 (21), 1707032.
San Lee, J., Weon, B. M., Park, S. J., Je, J. H, Fezzaa, K. & Lee, W.-K. 2011 Size
limits the formation of liquid jets during bubble bursting. Nat. Commun. 2 (1), 1–7.
Sanjay, V. 2020 Code repository: Bursting bubble in a viscoplastic medium. https://github.
com/VatsalSy/BurstingBubbleInViscoplasticMedium (Last accessed: November 30,
2020).
Sikorski, D., Tabuteau, H. & de Bruyn, J. R. 2009 Motion and shape of bubbles rising
through a yield-stress fluid. J. Non-Newton. Fluid Mech. 159 (1-3), 10–16.
Singh, D. & Das, A. K. 2019 Numerical investigation of the collapse of a static bubble at the
free surface in the presence of neighbors. Phys. Rev. Fluids 4 (2), 023602.
Singh, J. P. & Denn, M. M. 2008 Interacting two-dimensional bubbles and droplets in a
yield-stress fluid. Phys. Fluids 20 (4), 040901.
Sun, B., Pan, S., Zhang, J., Zhao, X., Zhao, Y. & Wang, Z. 2020 A dynamic model for
predicting the geometry of bubble entrapped in yield stress fluid. Chem. Eng. J. 391,
123569.
Toba, Y. 1959 Drop production by bursting of air bubbles on the sea surface (ii) theoretical
study on the shape of floating bubbles. J. Oceanogr. Soc. Jpn. 15 (3), 121–130.
Tripathi, M. K., Sahu, K. C., Karapetsas, G. & Matar, O. K. 2015 Bubble rise dynamics
in a viscoplastic material. J. Non-Newton. Fluid Mech. 222, 217–226.
Tryggvason, G., Scardovelli, R. & Zaleski, S. 2011 Direct numerical simulations of gas–
liquid multiphase flows. Cambridge University Press.
Tsamopoulos, J., Dimakopoulos, Y., Chatzidai, N., Karapetsas, G. & Pavlidis, M. 2008
Steady bubble rise and deformation in newtonian and viscoplastic fluids and conditions
for bubble entrapment. J. Fluid Mech. 601, 123.
Vignes-Adler, M. 2013 The fizzling foam of champagne. Angew. Chem. Int. Ed. 52 (1), 187–
190.
Walls, P. L. L., Henaux, L. & Bird, J. C. 2015 Jet drops from bursting bubbles: How gravity
and viscosity couple to inhibit droplet production. Phys. Rev. E 92 (2), 021002.
Wildeman, S., Visser, C. W., Sun, C. & Lohse, D. 2016 On the spreading of impacting
drops. J. Fluid Mech. 805, 636–655.
Zamankhan, P., Takayama, S. & Grotberg, J. B. 2018 Steady displacement of long gas
bubbles in channels and tubes filled by a bingham fluid. Phys. Rev. Fluids 3 (1), 013302.
Zeff, B. W., Kleber, B., Fineberg, J. & Lathrop, D. P. 2000 Singularity dynamics in
curvature collapse and jet eruption on a fluid surface. Nature 403 (6768), 401.You can also read