Annual Operations Plan - Murrumbidgee Valley 2019-20
←
→
Page content transcription
If your browser does not render page correctly, please read the page content below
Annual Operations Plan
Murrumbidgee Valley 2019-20
Acronym     Definition

Contents                                                             AWD
                                                                                 Available Water
                                                                                 Determination
Introduction        						2
                                                                     BLR         Basic Landholder Rights
   The Murrumbidgee River System			                             2
   Regulated and unregulated system flow trends                 3    BoM         Bureau of Meteorology
   Rainfall trends                                              3
                                                                     CWAP        Critical Water Advisory Panel
   Inflows to dam                                               4
   Water users in the valley					                                                Critical Water Technical
                                                                4    CWTAG
                                                                                 Advisory Group

Water availability			                                           7                Department of Primary
   Current drought conditions                                   9    DPI CDI     Industries - Combined
   Blowering Dam storage                                        10               Drought Indicator

   Burrinjuck Dam storage                                       10               Department of Planning,
   Inter valley transfer                                        11               Industry and Environment -
                                                                     DPIE EES
   Operational surplus                                          12               Environment, Energy &
                                                                                 Science
   Transmission losses                                          12
   Resource assessment                                          15   DPI         Department of Primary
   End of System flow targets			                                17   Fisheries   Industries - Fisheries

                                                                                 Department of Planning,
Water resource forecast                                         18   DPIE
                                                                                 Industry and Environment -
                                                                     Water
   Murrumbidgee catchment - past 24 month rainfall              18               Water
   Blowering Dam - past 24 month inflows/statistical inflows    19
                                                                     FSL         Full Supply Level
   Burrinjuck Dam - past 24 month inflows/statistical inflows   19
   Weather forecast - 3 month BoM forecast                      20   HS          High Security

   Murrumbidgee storage forecast                                20
                                                                     IRG         Incident Response Guide

Annual operations                                               22               Infrastructure State
                                                                     ISEPP       Environmental Planning
   Operational rules                                            22
                                                                                 Policy
   Deliverability                                               24
   Overall scenario assumptions                                 24   LGA         Local Government Areas

                                                                                 River Operations Stakeholder
                                                                     ROSCCo
Critical dates                                                  25               Consultation Committee

                                                                     S&D         Stock & Domestic
Potential projects				                                          26
                                                                                 Valley Technical Advisory
                                                                     vTAG
                                                                                 Group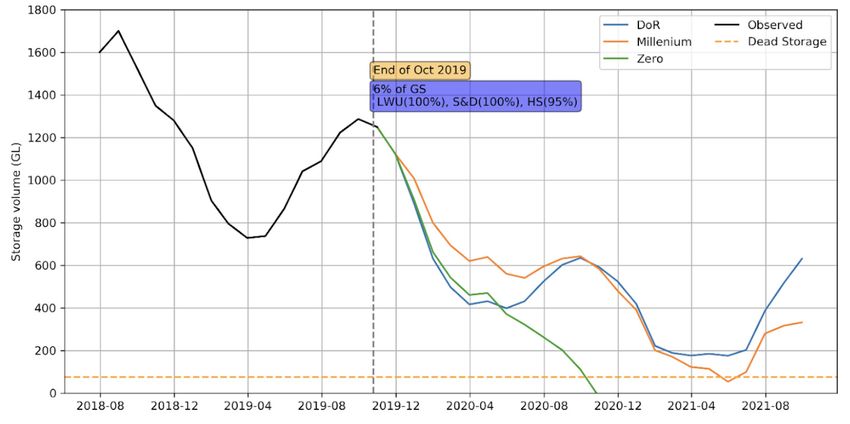
Introduction
The annual operations plan provides an outlook for the coming year in the Murrumbidgee Valley and
considers the current volume of water in storages and weather forecasts. This plan may be updated
as a result of significant changes to the water supply situation.

This year’s plan outlines WaterNSW’s response to the drought in the Murrumbidgee Valley including:
• identification of critical dates
• our operational response
• potential projects to mitigate the impact of the drought on customers and communities within the
  valley.

The NSW Department of Planning, Industry and Environment’s Extreme Events Policy and Incident
Response Guides outline 4 stages of drought. The Murrumbidgee Regulated River system is assessed to
be in stage 1, which is reflecting the normal operation of the river in 2019-20.

The Murrumbidgee River System

The Murrumbidgee River, a major tributary of the Murray-Darling River system, drains much of southern
New South Wales and most of the Australian Capital Territory. It spans almost 1,600 kilometres (km),
rising in the Fiery Range of the Snowy Mountains and flowing generally westward towards its junction
with the Murray River downstream of Balranald.

The Murrumbidgee is regulated downstream of Burrinjuck Dam. The total catchment above Burrinjuck
Dam is about 13,000 km2. Below Burrinjuck Dam, the Murrumbidgee River initially flows in a rugged,
narrow gorge before emerging into a widening valley near Gundagai.

The Tumut River joins Murrumbidgee River upstream of Gundagai. Tumut River, with a catchment area
of about 4,000 km2, is the Murrumbidgee River’s largest tributary. The source of Tumut is around the
snow-capped Mount Jagungal. Most of the Tumut River catchment is controlled by the Snowy Hydro
Scheme and through a series of small reservoirs and power stations. The Tumut River is regulated by
Blowering Dam, which is located near Tumut town. There are several uncontrolled tributaries that
contribute to the Murrumbidgee River flows between Burrinjuck and Blowering Dams, and Wagga
Wagga city as follows:

• Goobaragandra River
• Adjungbilly Creek
• Jugiong Creek
• Muttama Creek
• Adelong Creek
• Tarcutta Creek
• Kyemba Creek.

In addition to the above, there are numerous ungauged tributaries. The approximate catchment
area of the downstream tributaries is about 6,400 km².

Below Wagga Wagga there are no significant tributary inflows to the system. The river is characterised
by Beavers Creek and Old Man Creek anabranch near Wagga Wagga. The anabranch takes
off downstream of Wagga Wagga and re-joins the Murrumbidgee between Berembed Weir and
Narrandera town.

                                                                                                         2
The most important effluent stream in the Murrumbidgee Valley is the Yanco Creek system. Yanco
Creek leaves the main river downstream of Narrandera and is about 800 km in length. Yanco Creek
bifurcates at Morundah into Yanco and Colombo Creeks. Colombo Creek joins Billabong Creek
near Jereldrie, while Yanco Creek also joins Billabong Creek upstream of Conargo. Billabong Creek
continues its journey until it joins Edwards River near Moulamein.
The Murrumbidgee River below Narrandera continues to flow westwards until it joins Murray River. The
river is regulated mainly to the town of Balranald.
The lower part of the Murrumbidgee Valley is also characterised by Lowbidgee floodplain which
is listed as a nationally important wetland within the Directory of Important Wetlands (Environment
Australia 2011).
GOGELDRIE WEIR
STURT CANAL MIA MAIN CANAL
LACHLAN RIVER MURRUMBIDGEE
GREAT CUMBUNG RIVER
SWAMP MAUDE HAY BILLABUNG CREEK
WEIR WEIR BARREN BOX MUTTAMA CREEK
SWAMP HOULAGHANS
MAUDE WEIR CREEK
REDBANK WEIR YANCO WEIR JUGIONG CREEK
BEREMBED COOTAMUNDRA BARRENBACK DAM
TALA LAKE GRIFFITH WEIR
LEETON BURRINJUCK DAM
N BALRANALD
HAY
MAUDE
BALRANALD WEIR NARRANDERA YASS YASS RIVER
Key JUNEE
GUNDAGAI
LAKE GEORGE
Major towns YANGA LAKE WAGGA TUMUT CANBERRA
COLEAMBALLY WAGGA
Major dams OUTFALL DRAIN JERILDERIE QUEANBEYAN
HENTY WEIR
River system WANGANELLA
SWAMP REGULATOR &
EUSTUARY CREEK LAKE URANA
Channel system REGULATOR
MORTIMERS BLOCK DAM TARABAH WEIR
River catchment & JUNCTION WEIR LACMALAC
BEAVERS CREEK WEIR COOMA
WARRISTON WEIR TUMUT RIVER QUEANBEYAN
Regulated weirs BILLABONG CREEK RIVER
HARTWOOD WEIR BLOWERING DAM
Unregulated weirs KYEAMBA CREEK
JERILDERIE WEIR HILLAS CREEK
YANCO CREEK TARCUTTA CREEK
Water bodies
COLOMBO CREEK GOOBARRAGANDRA RIVER
Regulated and unregulated system flow trends
Murrumbidgee is a regulated river system which receives inflows from different tributaries and the
Snowy Hydro Scheme in the upstream. In a normal year, Murrumbidgee receives around 1,026,000
megalitres (ML) from the Snowy Hydro Scheme. Burrinjuck Dam receives 1,239,000 ML and Blowering
Dam receives 347,000 ML natural inflows on average. Murrumbidgee also receives on average
750,000 ML from tributaries which join down stream of Blowering and Burrinjuck Dams.
Rainfall trends
For the period April 2017 to March 2019, lowest-on-record rainfall was observed over southern
inland Queensland and areas of northwestern New South Wales. Over most of this area, rainfall for
the period was less than 50% of the 1961-1990 average. Large areas from central to southwestern
Queensland, and northcentral and northwestern New South Wales, into northeastern South Australia,
have seen rainfall totals between 40% to 60% of this average, implying that nearly one year’s worth of
average rainfall has been missed over this two-year period.
The recent dry periods have been especially severe during the cooler months of April to September,
an important time for agriculture and the replenishment of surface and groundwater storages
3across southern Australia. Averaged over the Murray-Darling Basin (MDB), the total rainfall over two
consecutive April to September periods was the lowest on record, at 217.5 millimetres (mm). This is
around 15% below the previous record, which saw 255.7 mm over the 1940-41 April to September
period. It was also the only instance of an April to September rainfall total below 125 mm in two
consecutive years.
Rainfall for the combined two-year 2017 and 2018 April to September period was the lowest on record
and very much below average (lowest 10% of all such periods) for large parts of south eastern and
southwestern Australia. Around 50% of New South Wales was lowest-on-record for these two periods
combined.
The 2019 winter continued to see dry conditions, which means three consecutive winters of below
average rainfall.
Inflows to dam
In the 28 months since the previous allocation in July 2017, inflows to Burrinjuck and Blowering Dams
have been approximately 688,000 ML and 584,000 ML respectively. In the 2017-18 water year, system
inflows to Burrinjuck and Blowering Dams have been at just 407,000 ML and 250,000 ML respectively.
In addition, Blowering Dam received 1,079,000 ML of water from Snowy Hydro Limited as required
annual release (RAR) and Burrinjuck Dam received 41,000 ML of water under the Snowy-Montane
release.
In the 2018-19 water year, system inflows to Burrinjuck and Blowering Dams have been low at just
200,000 ML and 180,400 ML respectively. In addition, Blowering Dam received 682,000 ML of water
from Snowy Hydro Limited as RAR and Burrinjuck Dam received 10,000 ML of water under the Snowy-
Montane release.
Water users in the valley
Basic Land Holder Rights (BLR)
BLR includes water for Domestic and Stock extracted from a water source fronting a landholder’s
property, or from any aquifer underlying the land, and for native title rights. It is estimated that the
volume of BLR in the Murrumbidgee is 1,690 megalitres per year (ML/year).
The water supply system shall be managed so that it would be capable of maintaining supply to
those exercising Domestic and Stock rights through a repeat of the worst period of low inflows into this
water source (based on historical flow information held by the Department of Planning, Industry and
Environment - Water, as at 1 July 2004).
Sufficient volumes of water must be set aside from assured inflows into this water source and reserves
held in Burrinjuck Dam and Blowering Dam water storage.
The Minister for Water may issue an order under section 324 of the Water Management Act 2000
to restrict the exercise of Domestic and Stock basic rights from this water source to protect the
environment, for reasons of public health, or to preserve basic landholder rights.
Domestic and Stock use
The share components of Domestic and Stock access licences authorised to take water from these
water sources will total 30,157 unit shares.
4Local water utilities
The share components of local water utility access licences authorised to take water from these water
sources will total 23,816 ML/year.
High security
The share components of regulated river (high security) access licences in the Murrumbidgee
Regulated River water source totals 364,330 unit shares. Of this total, 15,480 unit shares are
environmental licences held by the Commonwealth and New South Wales state.
General security
The share components of regulated river (general security) licences in the Murrumbidgee Regulated
River water source will total 1,891,990 unit shares. Of this total, 474,900 unit shares are environmental
licences held by the Commonwealth and New South Wales state. The average water allocation of
general security licenses over the last 10 years in the valley is 75.8%.
Rice and a wide range of horticultural crops are the major crops cultivated in the Murrumbidgee
Valley.
Conveyance
The share component of conveyance access licences in the Murrumbidgee Regulated River water
source is 373,000 unit shares held by Coleambally Irrigation Ltd and Murrumbidgee Irrigation Ltd. Of
this total, 65,750 unit shares are environmental licences held by the Commonwealth and New South
Wales state.
Environmental Water
Planned environmental flow rules
In accordance with the Water Management Act 2000, planned environmental water is water
that is committed by management plans for fundamental ecosystem health or other specified
environmental purposes, either generally or at specified times or in specified circumstances and that
cannot, to the extent committed, be taken or used for any other purpose.
Minimum flow at Balranald
WaterNSW must maintain a minimum daily flow in the Murrumbidgee River at downstream Balranald
Weir site throughout a water year. A minimum daily flow in megalitres per day (ML/day) must be
maintained throughout the water year in the Murrumbidgee River at Balranald gauge (410003), as
calculated using the following formula:
300+(0.4X ((95TH percentile natural daily flow for the month)-300))
where the 95th percentile natural daily flow is the daily flow for each month that is exceeded in 95%
of the days in that month.
The minimum daily flow cannot be used to meet access licence water requirements or bulk water
transfer requirements (inter-valley transfers to the Murray Regulated River system etc) below Balranald.
5Month Minimum daily flows at Balranald (ML/day)
January 186
February 180
March 180
April 180
May 297
June 429
July 829
August 1,087
September 1,330
October 1,030
November 568
December 254
The supply of the above minimum flows is subject to the following conditions:
a. The average daily flow for each month, measured at Balranald, is maintained at the target
minimum environmental flow;
b. A variability of 25% below the target is not exceeded for a period greater than seven (7) days
consecutive days and/or ten (10) days per month;
c. Exceedance of the target by up to 25% is used to offset existing shortfalls; and
d. The cumulative shortfall in daily target flows for any month is distributed evenly to the daily
target for the next month’s minimum flow.
e. Exceedance of environmental water releases cannot be used as a credit against future
shortfalls.
Minimum flow at Darlot
WaterNSW must maintain a minimum daily flow of 50ML/day in the Billabong Creek at Darlot site
throughout a water year. The minimum daily flow cannot be used to meet access licence water
requirements or bulk water transfer requirements (inter-valley transfers to the Murray Regulated River
system etc.) below Darlot.
The supply of the above minimum flows is subject to the following conditions:
a. The average daily flow for each month, measured at Darlot, is maintained at the target
minimum environmental flow;
b. A variability of 25% below the target is not exceeded for a period greater than seven (7) days
consecutive days and/or ten (10) days per month;
c. Exceedance of the target by up to 25% is used to offset existing shortfalls; and
d. The cumulative shortfall in daily target flows for any month is distributed evenly to the daily
target for the next month’s minimum flow.
e. Exceedance of environmental water releases cannot be used as a credit against future
shortfalls.
6Transparent releases from Blowering Dam
When previous twenty-four-hour natural inflows below T1 power station are less than 560 ML/day, the
minimum release from Blowering Dam must be greater than or equal to natural inflows plus any water
orders in the Tumut River between the dam and the confluence with the Murrumbidgee River. The
24-hour natural inflow is estimated ending each mid-night by Snowy Hydro. The estimates are based
on complex water balance equations for the internal storages held by Snowy Hydro. The estimated
figures are sent to WaterNSW on a daily basis only for 9-days a fortnight.
Transparent releases from Burrinjuck Dam
WaterNSW must ensure a transparent release volume for Burrinjuck Dam is calculated each day and is
the lesser of either the volume of inflows to the dam over the previous 24 hours or 615 ML. Water orders
between Burrinjuck Dam and the Tumut River confluence is added to the daily transparent release
volume.
The inflow to Burrinjuck Dam is calculated at the dam wall, taking into account the net evaporation
corrected rainfall over the Burrinjuck Lake.
Translucent releases from Burrinjuck Dam
Translucent releases, where a portion of dam inflows is released coincidentally with their occurrence,
are made from Burrinjuck Dam each day between 22 April and 21 October.
Daily release volumes are calculated based on:
• catchment conditions as determined through average daily flows measured at Goodradigbee
River at Wee Jasper gauge
• the 24-hour inflows to the storage
• the effective storage volumes in Burrinjuck Dam (equal to the active storage volume in Burrinjuck
Dam minus half the volume in regulated river (general security) access licence accounts that was
carried over from the previous water year).
Daily release volumes are then subject to a set of complex rules to clip the calculated release
volumes. The clipped volumes (also known as foregone volumes) are then credited to environmental
water accounts.
The calculated release volumes are also subject to the provision of instream ecological benefits to the
riverine environment below the storages.
Water availability
Water allocations in the Murrumbidgee Regulated River water source for 2019-20, as of 26 November
2019:
• local water utility and Domestic and Stock water access licence holders receive an allocation of
100% of entitlement
• high security water access licence holders in the Murrumbidgee Regulated River water source and
its sub categories receive an allocation of entitlement as shown in the table below
• general security water access licence holders receive an allocation of 6% of entitlement.
7Available Water Determinations (AWD) for Murrumbidgee - 26 November 2019
Licence Category AWD Deliverability
Domestic and Stock 100% Unrestricted
Domestic and Stock - domestic 100% Unrestricted
Domestic and Stock - stock 100% Unrestricted
Local water utility 100% Unrestricted
Regulated River (general security) 6% Unrestricted
Regulated River (general security 8% Unrestricted
carryover allocations
Regulated River (high security) 95% Unrestricted
The following table shows the water availability for different licence categories (as of 26 November
2019):
Licence Category Share Available AWD Carryover Allocation Allocation Usage
Compo- balance volume in Assign- Assign-
nent ments in ments out
Coleambally Irrigation 130,000 44,051 111,605 0 0 56,412 10,172
(conveyance)
Domestic and Stock 19,260 9,287 11,997 -20 0 0 9,117
Domestic and Stock - 271 177 271 -16 0 0 16
domestic
Domestic and Stock - 10,626 3,730 10,520 0 0 0 5,647
stock
Local water utility 23,816 20,619 23,816 0 42 0 2,883
Miscellaneous transfer 307 0 0 0 0 0 0
Murrumbidgee 243,000 63,965 153,552 1 0 19,039 58,648
Irrigation
(conveyance)
Regulated River 2,968 178 178 0 0 0 0
(conveyance)
Regulated River 1,891,995 215,654 113,519 151,721 211,231 198,419 36,494
(general security)
Regulated River 364,279 208,197 345,468 -145 46,727 121,462 59,207
(high security)
Regulated River (high 2,150 2,150 2,150 0 0 0 0
security, aboriginal
cultural)
Regulated River (high 300 92 300 0 0 0 0
security, research)
Regulated River (high 19,769 0 19,769 0 0 0 19,769
security, town water
supply)
Supplementary water 198,780 198,780 198,584 0 4,112 3,916 0
Supplementary water 747,000 747,000 747,000 0 0 0 0
(Lowbidgee)
GRAND TOTAL: 3,654,522 1,513,879 1,738,730 151,541 262,112 399,247 201,952
8The allocation made to the general security category so far in the current water year is given below:
Date AWD ML/share Total %
15 August 2019 0.03 3%
20 September 2019 0.03 6%
Supplementary access
No supplementary event has been triggered so far in 2019-20. There have been very small tributary
inflows into the system so it is insufficient to share the volumes equitably and in a productive manner.
Current drought conditions
The river system continues to experience low inflows to Burrinjuck and Blowering Dams and
downstream tributaries. Over the last 10 years, good inflows occurred in three years: 2010-11, 2011-12
and 2016-17.
Extremely low inflows also occurred in three years: 2009-10, 2017-18 to 2018-19. The last two years, from
November 2017 to October 2019, has seen the lowest inflow similar to the lowest on record inflows to
Burrinjuck Dam for a 24-month period. Recent inflows to Blowering Dam are higher than the 2006-2009
drought period inflows and it shows a similar trend to that of the 2001-2004 inflows to Blowering.
Murrumbidgee Valley Inflows
3,500,000
3,000,000
2,500,000
Inflow (ML)
2,000,000
1,500,000
1,000,000
500,000
0
2009-10 2010-11 2011-12 2012-13 2013-14 2014-15 2015-16 2016-17 2017-18 2018-19 2019-20
Dam inflows Tributary Inflows
As of 15 November, Burrinjuck Dam is at 33% capacity with an active storage volume of 1,028,000 ML.
Blowering Dam is at 53% capacity with an active storage volume of 1,628,000 ML.
9Blowering Dam storage
As a result of the low inflows to Blowering and Burrinjuck Dams over the past two years, the volume
of water stored in the dams has slowly declined. The volume of water stored at Blowering Dam has
declined from 95.3% of capacity in December 2016 to 44.6 % capacity in June 2019. The graph below
shows Blowering Dam’s behaviour for the 2018-19 water year, compared to the last four water years.
Blowering Dam storage
110%
100%
90%
80%
70%
Storage (%)
60%
50%
40%
30%
20%
10%
0%
Jul Aug Sep Oct Nov Dec Jan Feb Mar Apr May Jun
2015/16 2016/17 2017/18 2018/19 2019/20
Burrinjuck Dam storage
The volume of water stored at Burrinjuck Dam has declined from 97% capacity in October 2016 to
30.6% capacity in June 2019. The graph below shows Burrinjuck Dam’s behaviour for the 2018-19
water year, compared to the last four water years.
Burrinjuck Dam storage
110%
100%
90%
80%
70%
Storage (%)
60%
50%
40%
30%
20%
10%
0%
Jul Aug Sep Oct Nov Dec Jan Feb Mar Apr May Jun
2015/16 2016/17 2017/18 2018/19 2019/20
10Inter valley transfer (IVT)
The trading of allocated water is allowed in accordance with the Water Sharing Plans between the
regulated Murrumbidgee River and Murray River, Lower Darling River and Snowy River catchments. The
Murrumbidgee inter-valley transfer (IVT) account keeps track of net allocation trade to and from the
Murrumbidgee Valley, and the delivery of that water to the Murray. A positive IVT account balance
means there is currently net trade out of the valley that has not been delivered to the Murray. Trade
into the Murrumbidgee can only occur as a back-trade of water that has been traded out but not
yet delivered to the Murray. A negative value would mean net trade into the valley from downstream
which cannot be physically delivered from the Murray to the Murrumbidgee Valley. A negative balance
means further trade into the valley is not allowed as this water cannot be physically delivered upstream.
Tagged licences
An entitlement can be ‘tagged’ on a register, allowing the water to be taken at the different location in
another hydraulically connected valley. Like other water licenses, the tagged licenses are also subject
to water ordering conditions. The license holder should place a valid water order with WaterNSW before
water is extracted. The approval of such water orders is subject to prevailing IVT trade conditions.
Current status
The 2019-20 IVT opening balance was about 18,700 ML.
• IVT trade into Murrumbidgee was open from the beginning of the water year and remained
active. The IVT balance reached the 100,000 ML limit by 22 August 2019 and the trade out of the
Murrumbidgee Valley was closed.
• The physical delivery of IVT volume at Balranald commenced on 15 November 2019. With contin-
ued IVT delivery, the IVT balance reached the trigger for opening the IVT trade out of the valley
on 21 November 2019. The trade was closed the same day with the IVT balance having reached
100,000 ML limit.
The IVT trend in 2019-20 is shown in the following chart:
2019 - 20 Murrumbidgee IVT Account Chart
120,000 120,000
Year-to-date - Total Trade Volumes (ML)
Volume Available for Trade (ML)
100,000 100,000
80,000
80,000
60,000
60,000
40,000
40,000
20,000
20,000
0
-20,000 0
1-Jul
31-Jul
30-Aug
29-Sep
28-Nov
28-Dec
27-Jan
26-Feb
27-Mar
25-Jun
29-Oct
26-May
26-Apr
Volume available for Trade into Murrumbidgee Volume available for Trade out of Murrumbidgee
Year-to-date – Total Trade out of Valley Year-to-date – Total Trade into Valley
For most recent update refer to Murrumbidgee IVT Account.
Customers can subscribe to IVT emails at waternsw.com.au/customer-service/news/subscribe
11Operational surplus
Operational surplus is water released from storage above that which could reasonably be expected
to pass the last extraction point on each given river/creek. Two main causes of operational surplus are
over ordering, and rain rejection during the irrigation season when the river flow is being controlled
to meet consumptive demands and environmental flow requirements to minimise surpluses. The
operational surplus is deemed as nil when the system spills due to tributary inflows under wet
conditions, and when the dams are on minimum release. Operational surpluses are a significant
concern in the regulated system because lost water may not be providing significant environmental
benefits and it compromises the long-term water security in the valley.
In the Murrumbidgee River system, the operational surplus is measured at Balranald and Darlot.
However, at times operational surplus is also noted at Bundidgerry Escape and Warriston Weir. The
following chart provides the operational surplus in the valley. The chart also shows the operational
surplus as a percentage of diversions in the valley (regulated sales, planned and discretionary
environmental flows, and IVT delivery). WaterNSW targets the operational surplus to be less than 5%. In
the Murrumbidgee Valley, delivery of IVT assists in minimising the operational surplus as the IVT delivery
rates and pattern is negotiated with MDBA so that during a period of IVT delivery the operational
surplus is minimal. Operations surplus for 2019-20 in the Murrumbidgee Valley is forecast to be about
40,000 ML (upper bound).
Murrumbidgee River - Water Delivery Operational Surplus Vs Sales -
2019-20 Cumulative %
6%
5%
4%
3%
Target below 5%
2%
1%
0%
st
r
ch
er
r
ril
ne
y
r
ry
ly
ay
be
be
be
ar
Ap
gu
Ju
ua
ob
ar
Ju
M
nu
em
m
m
Au
br
M
ct
ve
ce
Ja
Fe
pt
O
No
De
Se
12Transmission losses
The transmission loss is a major part of the essential requirements to run the river. The transmission
loss includes but is not limited to Basic Landholder Rights (BLR), channel net evaporation, potential
evapotranspiration along river banks, groundwater seepage, losses to floodplain or effluent streams,
or during overbank flows, gauging and metering errors. The transmission loss for the Murrumbidgee
River system and the Yanco - Colombo - Billabong systems are treated separately. The transmission
loss for Murrumbidgee River is calculated from the water balance between Wagga Wagga and
Balranald, considering diversions by the licenced customers, diversions into Yanco Creek and
Lowbidgee channels, and net difference in the re-regulation storages and channel storages.
The following chart shows the estimated annual transmission losses for Murrumbidgee River over last
five years 2013-14 excluding the flood year 2016-17.
Annual Murrumbidgee River loss
350
300
Cumulative transmission loss (GL)
250
200
150
100
50
0
Jul Aug Sep Oct Nov Dec Jan Feb Mar Apr May Jun
Months
2013/14 (1,543 GL) 2014/15 (1,691 GL) 2015/16 (1,155 GL)
2017/18 (1,720 GL) 2018/19 (1,002 GL) 2019/20 (YTD)
2019/20 (projected) (730 GL)
*Note: Data for flood year 2016-17 is excluded in this chart. Total regulated use for each year is given in bracket.
In the above chart, the transmission loss in 2015-16 was very low because of the wet conditions both
at the start and end of the year. The approach adopted to forecast the river transmission loss under
the resource assessment process is based on the total forecast regulated sales in the valley. Based on
the historic relationship between these two parameters, an envelope curve has been adopted that is
governed by the following equation:
Loss ML = 0.03 * Regulated Sale (ML) + 310,000
Where, regulated sale is the forecast on-allocation diversions by the licenced customers. However, the
budget is continually reviewed at each month to adjust for increased or decreased system losses. The
above chart also shows how the initial budget made at the start of the current water year (2019-20) in
this month.
13The transmission loss in Yanco Creek is estimated as the water balance between the total inflows
into the system including offtake flows, unregulated inflows from Billabong Creek measured at
Cocketgedong, regulated inflows from the escapes from irrigation corporations and metered/assessed
extractions in the creek system and the end of system flows at Darlot and Warriston weir. The following
chart shows estimated transmission losses for Yanco Creek over the last five years excluding the flood
year 2016-17.
Annual Yanco Creek loss
90,000
* Data for flood year 2016/17 is excluded in this chart
80,000
Cumulative transmission loss (ML)
70,000
60,000
50,000
40,000
30,000
20,000
10,000
0
Jul Aug Sep Oct Nov Dec Jan Feb Mar Apr May Jun
2013/14 2014/15 2015/16 2017/18
2018/19 2019/20 (YTD) 2019/20 Projected
The average annual transmission loss in the Yanco - Colombo - Billabong system has a fixed budget of
about 70,000 ML. This is based on the historic data available with WaterNSW. However, the budget is
continually reviewed at each month to adjust for increased or decreased system losses.
14Resource assessment
The resource assessment is the process of calculating how much water is available based on the rules
of the Water Sharing Plan (WSP). This is done at the end of the month and when any significant inflow
event occurs.
The planning horizon for this resource assessment is 19 to 30 months depending on the month of
assessment. Taken into consideration is the volume of water held in Blowering and Burrinjuck Dams
and the minimum required release from the Snowy Hydro Scheme, plus the expected minimum inflow
based on historical records for the 19 to 30-month period.
As required by the Murrumbidgee Work Approval, the resource assessment was checked for any
new Available Water Determination (AWD) for drought, restarting in October 2019. There is no
improvement in resources to recommend a new AWD on 15 November 2019.
As of 15 November 2019, the total amount of water available (total active storage volume in
Blowering and Burrinjuck Dams) at the day of assessment is 1,683,000 ML. This includes:
1. any usable flows in transit
2. drought inflows for the rest of the year
3. Snowy Hydro’s assured Required Annual Release (RAR)
To date, 165,000 ML of the water available has been used.
Commitments for the planning horizon include:
• 116,000 ML of general security and carryover allocations
• 698,000 ML of high security allocations
• 74,000 ML of towns and Domestic and Stock
• 265,000 ML of conveyance allocation.
About 120,000 ML is set aside as rules based environment water. 352,000 ML is for storage evaporation,
essential requirements and losses resulting from the running of the river - this includes the delivery of
replenishment flows and river losses.
This assessment is replicated below in charts and in a water balance table.
Murrumbidgee resource distribution 2019-20 – 15 November 2019
e-water 28,000 ML e-water 40,000* ML
consumptive use consumptive use
Total general security 85,000 ML 112,000 ML
Total
Rules-based
Total carry over carryover
Rules-based env water
152,000 ML
env water 120,000 ML
Rules-based Environmental Water 350,000 ML Total GS
265,000 ML
2020-21 High priority needs
Conveyance
IVT account 265,000 ML
High Security IVT account
24,000 ML
Towns + Domestic and Stock
Conveyance
Losses
Losses
352,000 ML
Reserves High security
348,000 ML
Total Resource: 1,848,000 ML
Reserves Towns + Domestic and Stock
* indicative breakdown of held environmental 50,000 ML 74,000 ML
water holdings (OEH, TLM, CEWH)
15
Supply distributionReserves High security
348,000 ML
Total Resource: 1,848,000 ML
Reserves Towns + Domestic and Stock
* indicative breakdown of held environmental 50,000 ML 74,000 ML
water holdings (OEH, TLM, CEWH)
Murrumbidgee resource distribution 2019-20 – 15 November 2019
Supply distribution
Minimum inflows - 474,000 ML
Useage to date - 165,000 ML
Total = 1,848,000 ML
Blowering Dam - 869,000 ML
Burrinjuck Dam - 340,000 ML
Resource Distribution for 2019-20 (15 November) Volume ML
Total Available Resource 1,848,000
less
Carryover (general security and conveyance) 152,000
Rules based environmental water 120,000
Towns, Domestic and Stock 74,000 (100%)
Reserves 50,000
Conveyance 265,000
Announced high security 348,000 (95%)
Losses (transmission, evaporation, operational) 352,000
Murrumbidgee IVT account (carryover as of 1 July) 24,000
Late season inflows 0
Announced general security 113,000 (6%)
Future (2020-21) high priority needs 350,000
Prognosis
The chances of improved general security allocation based on various possible inflow scenarios:
Historical inflow scenario 1 December 2019 1 February 2019
99 chances in 100 (extreme) (99%) 6 6
9 chances in 10 (very dry) (90%) 6 6
3 chances in 4 (dry) (75%) 6 6
1 chance in 2 (mean) (50%) 6 6
16End of System flow targets
Minimum flow at Balranald
Balranald EoS Target - Planned eWater and other downstream orders
2,500
Orders, Delivery and Surplus (ML/day)
2,000
1,500
1,000
500
0
19
19
19
9
9
9
20
20
20
20
20
20
01
01
01
20
20
20
20
20
20
20
20
20
/2
/2
/2
7/
8/
9/
1/
2/
3/
4/
5/
6/
10
11
12
1/
1/
1/
1/
1/
1/
1/
1/
1/
1/
1/
1/
Actual delivery Required flow Balranald operations surplus and spills
The above figure shows the Balranald end of system (EoS) actual delivery, required flow and
operational surplus. The end of system target includes planned environmental water, irrigation orders
below Balranald and any IVT or other operational orders by MDBA.
Minimum flow at Darlot
Darlot EoS Target - Planned eWater and other downstream orders
450
Orders, Delivery and Surplus (ML/day)
400
350
300
250
200
150
100
50
0
9
9
9
19
19
19
0
0
0
0
0
0
01
01
01
02
02
02
02
02
02
20
20
20
2
2
2
2
2
2
2
2
2
7/
8/
9/
0/
1/
2/
1/
2/
3/
4/
5/
6/
1/
1/
1/
1
1
1
1/
1/
1/
1/
1/
1/
1/
1/
1/
Actual delivery Required flow Darlot operations surplus and spills
The above figure shows the Darlot end of system (EoS) actual delivery, required flow and operational
surplus. The end of system target includes planned environmental water, irrigation orders below Darlot
and any IVT or other operational orders by MDBA.
17Water resource forecast
Murrumbidgee Catchment - past 24-month rainfall
Over the last 24 months, the total rainfall across the Murrumbidgee catchment was in the range of
800 mm to 2400 mm. The average annual rainfall across the Murrumbidgee is 600 mm to 1,000 mm
per year.
Total NSW rainfall (mm) for 24 months - 1 November 2017 to 31 October 2019
NSW rainfall deciles (mm) for 24 months - 1 November 2017 to 31 October 2019
18Blowering Dam - past 24-month inflows/statistical inflows
The inflows for the last 24 months for Blowering Dam (November 2017 to October 2019) was
411,000 ML. This is above the previous minimum observed 24-month inflow of 155,000 ML.
Comparison of actual inflow and statistical inflow - Blowering Dam
900,000
800,000
Cumulative inflows (ML)
700,000
600,000
500,000
400,000
300,000
200,000
100,000
0
Fe 8
M 8
A 8
M 18
Ju 8
18
8
Se 8
O 8
N 18
D 18
Ja 8
Fe 9
M 9
A 9
M 19
Ju 9
19
A 19
Se 9
O 9
9
Ja 7
7
1
1
-1
-1
l-1
-1
1
-1
1
1
-1
-1
-1
1
-1
-1
-1
n-
b-
-
n-
p-
-
-
n-
b-
-
n-
l-
p-
ar
pr
ay
ug
ct
ov
ec
ar
pr
ay
ug
ct
ec
ov
Ju
Ju
A
N
D
Minimum 20th percentile 50th percentile 80th percentile Current
Burrinjuck Dam - past 24-month inflows/statistical inflows
The inflows for the last 24 months for Burrinjuck Dam (November 2017 to October 2019) was
548,000 ML. This is similar to the previous minimum observed 24-month inflow of 547,000 ML.
Comparison of actual inflow and statistical inflow - Burrinjuck Dam
4,000,000
3,500,000
Cumulative inflows (ML)
3,000,000
2,500,000
2,000,000
1,500,000
1,000,000
500,000
0
Fe 8
M 18
A 8
M 18
Ju 8
18
8
Se 8
O 8
N 18
D 18
Ja 8
Fe 9
M 19
A 9
M 19
Ju 9
19
A 19
Se 9
O 9
9
7
7
1
-1
-1
l-1
-1
1
-1
1
-1
-1
-1
1
-1
-1
-1
n-
b-
-
n-
p-
-
-
n-
b-
-
n-
l-
p-
ar
pr
ay
ug
ct
ov
ec
ar
pr
ay
ug
ct
ec
ov
Ju
Ju
Ja
N
A
D
Minimum 20th percentile 50th percentile 80th percentile Current
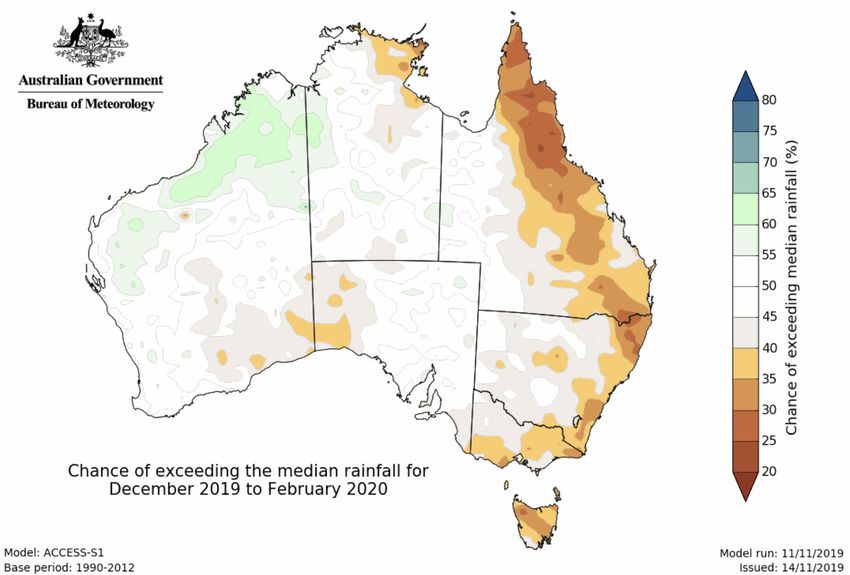
19Three-month weather forecast
The Bureau of Meteorology seasonal outlook for November 2019 to January 2020 indicates that the
Murrumbidgee catchment is likely to experience drier than average conditions, with the later part of
summer likely to be near average. While near average conditions may be expected, it is important to
note that the wet season is over and that average inflows for the remainder of the water year are low.
Daytime temperatures are likely to be above average, while overnight temperatures may be near
average. The BoM indicates that the El Niño-Southern Oscillation (ENSO) remains neutral. Modelling
suggests that the ENSO is likely to remain neutral over the remainder of 2019 and into 2020. Positive
Indian Ocean Dipole (IOD) conditions are forecast for the remainder of spring and into summer.
A positive IOD will likely result in below average spring rainfall and above average temperatures.
The figure below shows that there is a 35-55% probability of the Murrumbidgee Valley receiving above
median rainfall during summer.
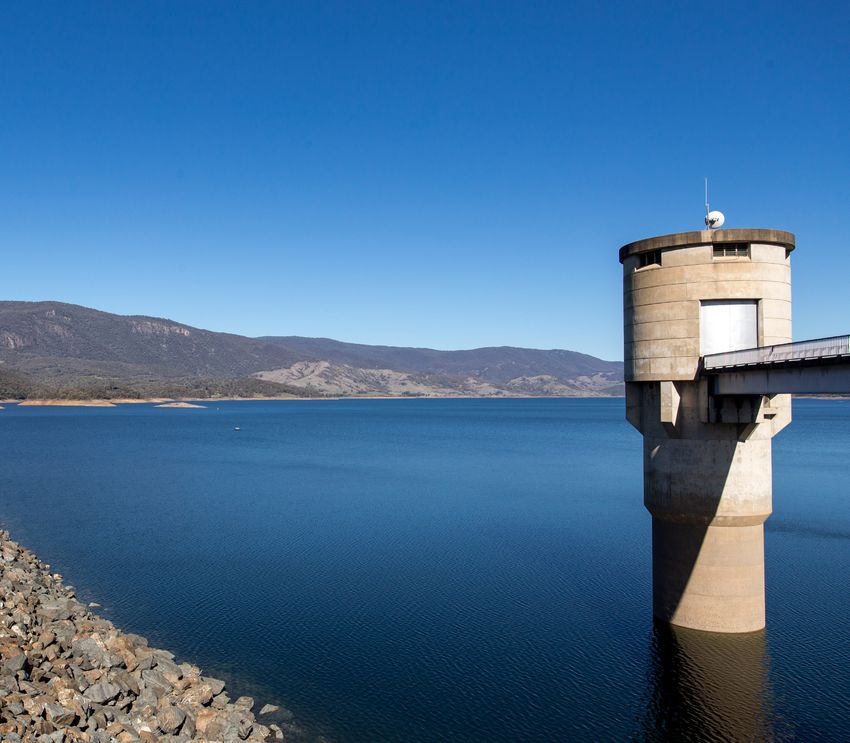
Murrumbidgee storage forecast
The figures below demonstrate the behaviour of Murrumbidgee Dams under different inflow
conditions through to June 2021. Under wet conditions (dark blue line) with 20th percentile inflows
(meaning flows that are expected to exceed in only 2 years out of 10), Blowering Dam may reach
1,313,000 ML (80%) and Burrinjuck Dam may reach 891,000 ML (87%) by the end of June 2021.
Under median conditions (light blue line) with inflows expected to exceed 5 years out of 10, Blowering
storage is likely to exceed 46% capacity, and Burrinjuck exceeds 37% by the end of June 2021.
A dry scenario (green line), where conditions are expected to exceed this inflow 8 years out of 10,
would still see the Blowering storage reaches above 3% capacity and Burrinjuck reaches 9% by June
2021. The forecast under a repeat of minimum inflow (grey) conditions indicates that Blowering Dam
will stay around 3% and Burrinjuck around 2.2% of capacity by July 2021.
20Blowering storage forecast
Blowering Dam forecast storage capacity updated - November 2019
1,800,000
1,600,000
End of month storage (ML)
1,400,000
1,200,000
1,000,000
800,000
600,000
400,000
* Including Snowy releases
200,000
0
Feb-18
Apr-18
Jun-18
Aug-18
Oct-18
Dec-18
Feb-19
Apr-19
Jun-19
Aug-19
Oct-19
Dec-19
Feb-20
Apr-20
Jun-20
Aug-20
Oct-20
Dec-20
Feb-21
Apr-21
Jun-21
Jul-17
Oct-17
Dec-17
Aug-17
Wet scenario (20%) Average scenario (50%) Dry scenario (80%)
Extreme dry scenario (99%) Actual
Burrinjuck storage forecast
Burrinjuck Dam forecast storage capacity updated - November 2019
1,200,000
1,000,000
End of month storage (ML)
800,000
600,000
400,000
200,000
* Including Snowy releases
0
Feb-18
Apr-18
Jun-18
Aug-18
Oct-18
Dec-18
Feb-19
Apr-19
Jun-19
Aug-19
Oct-19
Dec-19
Feb-20
Apr-20
Jun-20
Aug-20
Oct-20
Dec-20
Feb-21
Apr-21
Jun-21
Jul-17
Oct-17
Dec-17
Aug-17
Wet scenario (20%) Average scenario (50%) Dry scenario (80%)
Extreme dry scenario (99%) Actual
21Annual operations
Operational Rules
Maintenance of water supply
The water supply system is managed to maintain supply on an annual basis to those exercising
Domestic and Stock rights and native title rights through a repeat of the worst period of low inflows
into this water source, as represented in flow information held by the Department when the first water
sharing plan for this water source made under the Act came into force.
Available water determinations of 100% of share components can be maintained for Domestic and
Stock access licences and local water utility access licences through a repeat of the worst period of
low inflows to this water source, as represented in flow information held by the Department when the
first water sharing plan for this water source made under the Act came into force.
Available water determinations for regulated river (high security) access licences of 0.95 ML/unit
share can be maintained through a repeat of the worst period of low inflows to this water source,
as represented in flow information held by the Department when the first water sharing plan for this
water source made under the Act.
Sufficient volumes of water must be set aside from inflows into this water source and in reserves held in
Burrinjuck Dam, Blowering Dam and other water storages to achieve it.
Water delivery and channel capacity constraints
The following channel capacity constraints are applicable in the Murrumbidgee and Yanco system.
Murrumbidgee River has the following physical or operational blockages that limit the volumes of
water that can be delivered to meet the demand:
• Tumut River at Oddy’s Bridge - 9,000 ML/day
• Tumut River at Tumut - 9,300 ML/day
Due to the significant influence of the uncontrolled catchment of Goobaragandra River, this
constraint is subject to the provision that the flow targets are not exceeded by the lesser of 10% or
1500 ML/day for a consecutive period of 8 hrs or more on any day and or not exceeded on five (5)
days or more for a calendar month.
• Murrumbidgee River at Gundagai 32,000 ML/day
• Yanco Creek at the off-take 1,400 ML/day.
If the flow rates are taken above these volumes, the water would break out of the channels and can
impact public and private property.
The Tumut River constraints are perhaps the most significant because they limit the rate at which
water can be released from Blowering Dam.
Rates of change to storage releases
The rules governing the rates of change take into account relevant environmental considerations,
damage to river banks, public safety, and any other matters considered relevant by the Minister.
22Dam operations during floods and spills
The operation of Burrinjuck Dam and Blowering Dam during times of flood and spilling of water is to
be undertaken in a manner that maintains the safety of dam infrastructure and limits damage to
downstream communities. In addition, operation should leave the storage as full as possible at the
completion of the flood event, subject to airspace requirements.
Airspace operation rules
Airspace is a volume of the storage that is deliberately left empty to mitigate potential flooding at
some time in the future. Releases to achieve airspace are usually made when the storage reaches a
specified level.
There are two types of airspace operation:
a. Variable - when the storage volume is reduced to a specified level when the inflow
characteristics of the recession flow provide a very high level of confidence that the storage will
refill to a nominated volume without further rain
b. Fixed - when the storage is maintained at a specified level during a specified period. The
level may be determined using a probability analysis based on time of year and antecedent
conditions.
Burrinjuck Dam airspace requirements
Burrinjuck Dam water storage is operated under a variable airspace policy. Burrinjuck Dam can be
reduced to a level that is sufficient for the dam to refill based on the minimum forecast recession
inflows. The variable airspace policy provides flood mitigation, while meeting the primary objectives of
dam safety and filling the dams.
When Burrinjuck Dam is near full and catchments are wet, WaterNSW continually re-assess ‘refill lines’
based on ‘assured inflows’. If the estimated inflow would result in the storage level above the refill line,
then an additional volume of water can safely be released, and the dam would still be filled with the
assured inflow.
For the purpose of airspace calculations, the following methods are adopted:
a. long term minimum monthly inflow statistics
b. daily recessions of current measured flows
c. serial correlation using historic data
d. BOM seasonal forecasts
Blowering Dam airspace requirements
Airspace operation of Blowering Dam water storage follows a fixed airspace policy and must be
undertaken in accordance with the provisions of the Blowering Airspace Deed, to which the Water
Administration Ministerial Corporation (WAMC) and the Snowy Hydro Limited (SHL) are parties. WAMC,
which owns the Blowering Dam, has made a 25-year agreement ‘Blowering Airspace Deed’ with SHL
in 2002 with respect to air space provision in Blowering Reservoir by making pre-releases. The deed
specifies complex calculations including calculation of airspace, required airspace provision and
pre-releases, channel capacity considerations and compensation releases.
As per the Blowering Airspace Deed, WaterNSW maintains a fixed airspace in the Blowering Dam as
directed by SHL from time to time. Usually, an airspace of 100,000 ML is maintained, however this may
be increased up to 190,000 ML as per the Blowering Airspace Deed.
23Deliverability
Progressive contingency measures include restricting access to general security carryover allocations,
cutting down transmission losses by ceasing flows in the Yanco Creek and reducing the delivery of
Domestic and Stock. Further operational changes will be considered to extend the supplies to critical
human needs in 2020-21 based on monthly water resource assessments.
The following figure shows a depletion curve for Blowering and Burrinjuck Dams considering zero
inflows to the dam, and zero downstream tributary flows.
Deliverability is assessed based on three different scenarios of inflows
1. Drought of Record (DoR) – using inflow statistics provided by the Department of Planning, Industry
and Environment as per the Water Sharing Plan 2016 (based on data before 2004)
2. Millennium drought – Assuming Murrumbidgee Valley receives the same inflows as the Millennium
drought (similar to November 2005 – October 2007 inflow)
3. Zero inflow – Assuming zero inflows to the dams in the current year, and Snowy Required Annual
Release (RAR) is expected as planned as it is already stored in Snowy Hydro storages and the
second year is with zero Snowy RAR.
Overall scenario assumption
1. The above forecasted scenario is based on the end of October 2019 assessment.
2. Considering 14% of general security effective allocation (6% available water determinations and
8% carryover) supply from October 2019 onwards up to June 2020, then no general security after
that, 95% high security supply and 100% town water supply and Domestic and Stock up to October
2021.
3. Considering minimum releases from Burrinjuck Dam and Blowering Dam according to water
sharing plan.
4. Deep storage considered is 75,000 ML.
24Under zero inflow, it indicates that in September 2020, there will be cease-to-flow conditions from both
dams as the water level reaches deep storage level.
While the use of the zero-inflow scenario is extremely conservative, the very dry catchment and the
significant depletion of soil moisture across the catchment means the use of this extreme scenario for
drought planning purposes is justified.
Under the DoR and under millennium drought inflow scenarios, Murrumbidgee River will be able to
meet the demand up to October 2021. Therefore, high security and other high priority water will most
likely be delivered until September 2021.
Comparison of drought inflows - Blowering + Burrinjuck dam - Drought Inflows for 36 months
2,000,000
1,800,000
1,600,000
Cumulative inflows (ML)
1,400,000
1,200,000
1,000,000
800,000
600,000
400,000
200,000
0
1 2 3 4 5 6 7 8 9 10 11 12 13 14 15 16 17 18 19 20 21 22 23 24 25 26 27 28 29 30 31 32 33 34 35 36
1901-11-1904-10 2001-11-2004-10 2005-11-2008-10 2016-11-2019-10 2017-11-2019-10
The figure above shows the current combined inflow to the dams in comparison with the four worst
sequences of inflows starting in November. As current inflow to the dams is higher than the historical
minimum inflow, WaterNSW will continuously monitor the inflows and if the inflows go below the historical
minimum, it will implement water restrictions to different water users according to the incident response
guide and water sharing plan. Drought contingency measures will be reviewed prior to 1 July 2020
water availability announcements.
Critical dates
• Storage volumes in the dams at 30 June 2020 will determine the water availability for 2020-21.
• General security account balances at 30 June 2020 will determine the amount of carryover
available in 2020-21.
• Customers are reminded to consider their carryover into next year when planning this year’s
operations and water trading. Carryover is limited to 30% of each general security share
component.
25Potential projects
Potential projects and contingency measures in 2019-20 for extending supplies to critical human
needs in 2020-21
The following options can be considered as drought management plans in Murrumbidgee Valley:
1. Using groundwater source as an alternative supply source:
a. Billabong Creek alluvial groundwater source
b. Gundagai alluvial groundwater source
c. Kyeamba alluvial groundwater source
d. Mid-Murrumbidgee zone 3 alluvial groundwater source
e. Wagga Wagga alluvial groundwater source.
2. Reduce the water allocation for different users.
3. Reduce the operational loss and capture the tributaries flow using regulated weirs along the river:
a. increase the airspace in the weir
b. reduce the lead-order time
c. capture rain rejection.
4. Installation of pipelines to supply critical human water needs to reduce the conveyance loss in the
Murrumbidgee irrigation and Coleambally irrigation areas.
5. Work closely with Shires in securing water supply under drought scenarios. Currently, the water
supply works require higher river levels which increases the losses and reduces the ability to capture
the rain rejection and tributary flows.
26You can also read