An intelligent radiation frost forecasting and warning system for agricultural environments
←
→
Page content transcription
If your browser does not render page correctly, please read the page content below
An intelligent radiation frost forecasting and
warning system for agricultural environments
Nikrooz Bagheri ( n.bagheri@areeo.ac.ir )
Agricultural Research, Education and Extension Organization (AREEO)
meisam bagheri
Shahid Beheshti University
Movahed Sepahvand
Agricultural Research, Education and Extension Organization (AREEO)
Research Article
Keywords: Deep Learning, Frost, Intelligent agriculture, Wireless sensor network
Posted Date: January 3rd, 2023
DOI: https://doi.org/10.21203/rs.3.rs-2410927/v1
License: This work is licensed under a Creative Commons Attribution 4.0 International License.
Read Full License
Page 1/16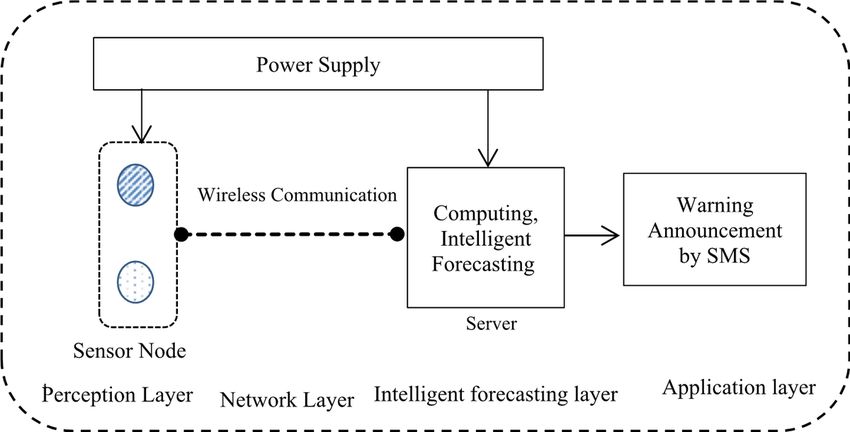
Abstract
Every year, radiation frost causes the loss of a large number of agricultural products. Currently, there is
numerous equipment to protect plants against frost. Turning on the equipment late causes inefficiency in
raising the air temperature in time, and turning them on early increases energy consumption and costs.
Therefore, accurately forecasting frost is very important for turning on the equipment in time. Therefore,
in this research, an intelligent radiation frost forecasting and warning system was designed and
constructed. This system is composed of a wireless sensor, computing and intelligent forecasting based
on deep learning methods and warning announcements to the farmer by the SMS. Intelligent forecasting
is based on forecasting dew point temperature for the next three hours according to the in-situ
measurement of temperature and relative humidity of the air. The meteorological data of the studied
regain from 2011–2021 were used to train the network. The Performance evaluation of the IFFS was
carried out. Based on the obtained results, the system accuracy in measuring temperature and relative
humidity of the air was 99% and 98%, respectively. The F-score of the IFFS obtained 96%, and the system
accuracy in the announcement of the warning obtained 100%. Due to the high accuracy of the IFFS for
forecasting radiation frost, the application of this system is recommended for better protection of plants.

1. Introduction
Climate change is the main source of agricultural production risk [1] which can have a great negative
effect on the quantity and quality of the products [2, 3]. Frost is one of the consequences of climate
change and every year damages many crops, especially horticultural crops around the world [4].

Currently, numerous active methods including machinery and equipment are used to protect plants
against frost. The efficiency of these methods depends on the time of turning on the equipment [5].
Turning on the equipment late makes their use inefficiency and turning it on early increases energy
consumption and costs. Therefore, it is necessary to forecast frost with the aim of timely use of active
protection methods. In reality, forecasting frost occurrence has been introduced as one of the strategies
to reduce damage to agricultural products [6].

In the past, weather forecasts were based on a statistical analysis of meteorological data, but today
artificial intelligence and expert decision-making systems have provided a good opportunity to provide
more accurate forecasting models [1]. Takle (1990) used an expert system to forecast frost. The
minimum and maximum temperature of the previous day, cloud cover percentage, current dew point
temperature, precipitation and wind speed were used as input variables. The results showed that the
accuracy of forecasting by the expert system was comparable with human forecasting methods [1].
Hoogenboom et al. (2000) built an Automated Environmental Monitoring Network (AEMN). This system
consisted of more than 70 meteorological stations in agricultural areas. The meteorological stations
collected data related to air temperature, air relative humidity, soil temperature (at a depth of 5, 10 and 20
cm), wind speed and direction, and solar radiation. The data of each station were averaged every 15
minutes and the average data was sent to the data logger and stored in it. The accuracy of this system in

                                                   Page 2/16
recording air temperature, air relative humidity, wind speed, solar radiation and soil temperature was
obtained ± 0.5 oC, 2%, ± 1.5%, ± 5% and ± 0.4 oC, respectively [2]. Robinson and Mort (1997) developed a
neural network-based system for frost forecasting. The input variables included temperature, cloud cover,
wind speed and direction, and air relative humidity [8].

This system was able to forecast frost for the next 24 hours with acceptable accuracy. Hubbard et al.
(2003) developed Kimball et al.'s research to provide a more accurate and less complicated method for
forecasting and estimating dew point temperature. They showed that the combination of minimum and
maximum temperature and the average temperature is the best input variable for estimating dew point
temperature. The root means square error (RMSE) and mean absolute error (MAE) were obtained as 3.23
and 2.55, respectively [9]. Jain et al (2006) forecasted frost risk in three regions of Georgia using an
artificial neural network. This system was able to forecast the temperature from 1 to 12 hours in the
future. The data included meteorological variables such as air temperature, wind speed, rainfall, relative
humidity and solar radiation. The results showed that the rainfall variable does not affect the air
temperature forecast and also the absolute average error increases with the increase of the forecast
period. Also, they estimated the most appropriate forecast interval to be 2–6 hours. The absolute average
error in forecasting one to 12 hours earlier was 0.6 oC and 2.5 oC, respectively [10]. Prabha and
Hoogenboom (2008) proposed a local-scale weather forecasting model for both advection and radiation
frost in peach and blueberry orchards. They found that the accuracy of forecasting dew point
temperature depends on the time of day. They suggested that their local-scale model could be used along
with AEMN online system [11]. Shank et al (2008) used an artificial neural network for the estimation of
air dew point temperature. They obtained accuracy of about 0.8 for forecasting air dew point temperature
within the 2 next hours later [12]. Smith et al (2009) developed 12 artificial neural network models to
forecast the air temperature in the next 1–12 hours. The average absolute forecasting error in this
method ranged from 0.52 oC in forecasting one hour earlier to 1.9 oC in forecasting 12 hours earlier [13].
Chevalier et al. (2012) designed an expert system based on web-based fuzzy logic to prevent the frost of
peach and blueberry crops. They used the regional meteorological data bank and an expert system to
forecast frost from one to 12 hours in advance [4]. Castanda-Miranda and Castano-Meneses (2017) used
an artificial neural network to forecast frost in a greenhouse. The variables including the temperature of
outside the greenhouse, outside and inside relative humidity, solar radiation, and wind speed were used
as network inputs [14]. The accuracy of frost forecasting obtained 0.95. In the year of 2020, theses
researchers succeeded in building an intelligent system based on the IoT to protect greenhouse tomatoes
against frost. In this system, the parameters of temperature, relative humidity, wind speed and solar
radiation were received from the weather station and by using an artificial neural network and fuzzy
(ANFIS), the future temperature and frost were forecasted. The probability of frost was announced to the
greenhouse keeper through mobile phones and internet. Also, in the frost situation, the sprinkler system
will automatically start to increase the temperature of the environment [15]. Guillen-Navarro et al. (2021)
developed an IoT system to reduce frost damage to orchard trees [5]. Ding and Tamura (2021) used a
machine-learning method for forest forecasting. They applied time-series temperature data developing a
model and forecasting forest. The accuracy of the system was 0.6 in experiments [16].

                                                   Page 3/16
Considering the lack of weather stations near farms and orchards for continuous monitoring of weather
conditions, and the inefficiency of existing frost forecasting methods based on meteorological data, the
purpose of this research is to design and construct an intelligent system for local-scale forecasting the
frost.
2. Materials And Methods
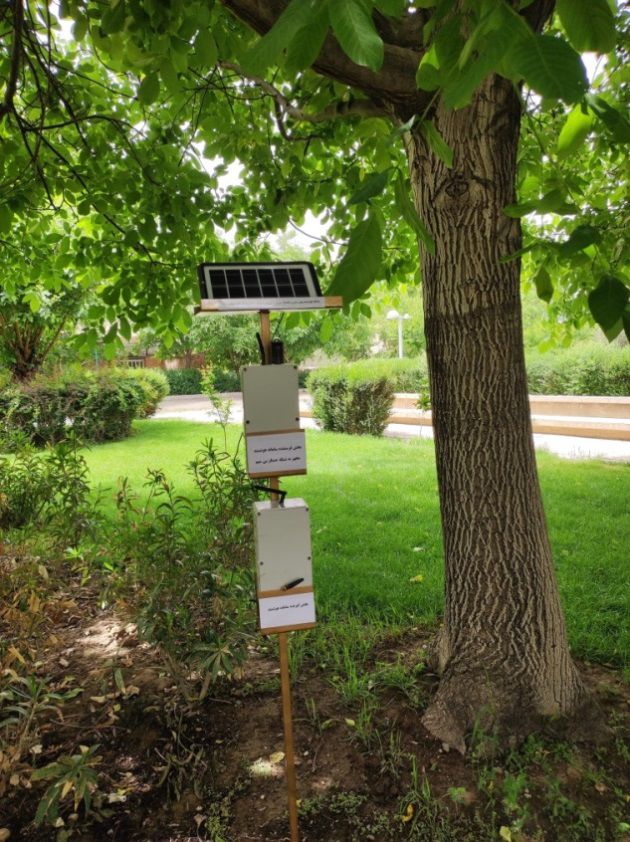
In this research, an intelligent system for local-scale frost forecasting was designed and constructed (Fig.
1). This system calculates the current dew point temperature and forecasts the dew point temperature for
the next three hours by deep learning. If frost is forecasted in the next few hours, it sends a warning to the
farmer by the SMS. The implementation of the research is as follows:
2.1 Identifying variables affecting the radiation frost
Based on documentary studies and the review of previous research, the variables affecting crop frost
include minimum and maximum air temperature, dew point temperature, cloud cover, air relative humidity
[17], wind speed and direction, and solar radiation. Although all the mentioned parameters are effective
on the frost the most influential parameters include air temperature, air relative humidity and dew point
temperature [4]. So, based on the obtained results, these three variables can forecast frost with an
accuracy of over 90%. Therefore, in this research, the air temperature, air relative humidity and dew point
temperature were used for local-scale forecasting of the radiation frost.
2.2 Design and construction of frost forecasting intelligent
system
The IoT-based block diagram of the IFFS is shown in Fig. 2. This system consists of four layers including
the perception layer, network layer, intelligent forecasting layer and application layer. The task of the
perception layer is to collect and store the data of the temperature and the relative humidity of the air. The
task of the network layer is to transfer the stored data from the perception layer to the intelligent
forecasting layer. The intelligent forecasting layer is responsible for calculating the current dew point
temperature and predicting the future dew point temperature based on the deep learning method. An
application layer announces a warning to the farmer by the SMS. More details are below:
2.2.1 The perception layer of the IFFS
The SHT35 digital sensor was used to measure air temperature and air relative humidity due to its high
accuracy and ability to work in an open environment and harsh weather conditions. This sensor is for
simultaneous measurement of temperature (in the range of -40 to + 125 0C) and air relative humidity (in
the range of 0-100%) with a digital output with an accuracy of ± 0.2 0C in temperature measurement and
an accuracy of ± 1.5% in humidity measurement. The SHT35 sensor is fully calibrated and its output is
linear. The working voltage of the sensor is 2.4-5.5V. Reliability, high stability and high signal-to-noise
Page 4/16ratio are the characteristics of this sensor. The sensor needed a special board to connect to the circuit
board, which was connected to it. The sensor was set to measure and store the data every 60 seconds
and then transmit it to the intelligent forecasting layer through the wireless link. The Arduino UNO R3
board by Atmega 328 microcontroller with 5V operating voltage and 40mA direct current was used to
store and transfer sensor data.
Due to the lack of electricity outdoors, a solar power bank was made to provide the required electric power
for the system. It includes the following components:
- Rechargeable 18650 lithium-ion battery with a voltage of 2.4 volts and a current of 3300 mAh
- A 18650 lithium-ion battery charger module (voltage 5 volts, current 1 A, USB output)
- Charge controller module
- Solar panel model Cl-650 with 24 cells and 4 watts capacity (CCLAMP Company, China) with fast
charging capability.
2.2.2 The network layer of the IFFS
Wireless communication was used to connect the perception layer (sensor node) to the intelligent
forecasting layer. Among the types of communication protocols, the ZigBee communication protocol was
chosen according to the distance, environmental conditions and cost. The Zigbee DRF 1605H CC2530CA
module with long-range antenna, a voltage of 2.6-3.6V, a maximum current consumption of 120mA, a
frequency of 2.4GHz, a maximum range of 1600 m, with communication protocol: UART, a working
temperature − 40 to + 85 0C are used. The CC2530 Zigbee Module USB to UART Backplane (DRF1605-
USB) board was used to set up the Zigbee module and connect it to the USB port.
2.2.3 The intelligent forecasting layer of the IFFS
The Raspberry Pi 4 with 4GB memory (5V, 3A) was used as hardware for data calculating and
forecasting. It acts as a base station and is connected to the perception layer through wireless
communication protocol. Its operating system is Linux and its programming language is Python. After
transmitting the online sensor data to the Raspberry Pi, the current dew point temperature was calculated
from Eq. (1) [18]:
T 0.125
d=(0.1T −112)+(112+0.9T )(RH)
1
Where:
RH: Air Relative Humidity (%)
T: Air Temperature (oC)
Page 5/16Td: Dew Point Temperature (oC)
Frost was forecasted based on forecasting the future dew point temperature using the deep learning
method and applying the gradient boosting algorithm. The frost threshold was set to a dew point
temperature of 0 oC. The threshold value can be changed according to the critical frost temperature of the
plant. To implement the gradient boosting algorithm, the GBM method and xgboost 1.6.1 library of PyPi
were used. The minmaxscaler method was used to normalize the data and also the grid-search method
was used to find the best grid parameters in the training. Finally, the optimal parameters were obtained.
Also, the num_boost_round parameter, which specifies the number of repetitions of the training, was
considered to be 5.
For intelligent forecasting, the time series temperature and relative humidity data of April and May for ten
years (2011–2021) were gathered from the national meteorological organization. The time interval
between data was 3 hours and the total number of data was 4961. The data was separated into three
categories: 65% of data for training, 10% of data for testing and 25% of data for evaluation.
2.2.4 The application layer of the IFFS
When the frost risk is detected in the next 3 hours, a warning announces to the farmer by the SMS. A
SIM800C SIM (Subscriber Identity Module) card shield with a GSM shield antenna was used to send the
SMS. This shield was compatible with Raspberry Pi and its power supplies by that. Its communication
protocol was serial UART, voltage 5-18V, working temperature from − 25°C to + 85°C, and data transfer
rate of 2400-115200 bits per second. To prevent entering rain, snow, or moisture into the system, as well
as to prevent animal damage devices were placed in waterproof and resistant boxes.
2.3 The pperformance evaluation of the IFFS
The evaluation of the performance of the IFFS was carried out in three stages as follows:
2.3.1 Evaluation of the performance of the IFFS in measuring the temperature and relative humidity of the
air
To evaluate the system's accuracy in measuring temperature and relative humidity, the sensor data were
compared with the meteorological reference data. So, the IFFS was placed next to the accurate
temperature and relative humidity sensors of the meteorological organization's synoptic station for 5
days. Data were recorded and stored every hour. Then the gathered data were compared.
2.3.2 Evaluation of the accuracy of IFFS in forecasting
To evaluate the accuracy of IFFS in frost forecasting, the forecasted model based on the deep learning
method was tested. The confusion matrix of the results was presented and the accuracy, sensitivity,
specificity and the F-Score were obtained based on the below formulas (Cadenas et al., 2020):
TP+TN
Accuracy = [19] (1)
TP+TN+FP+FN
Page 6/16Sensitivity =
TP
TP+FN
[19] (2)
Specificity =
TN
TN+FP
[19] (3)
F − Score =
2TP
2T P +F P +F N
[20] (4)
Where:
TP (True Positive): Forecasted Frost
FP (False Positive): Forecasted False Frost
FN (False Negative): Frost Not Forecasted
TN (True Negative): No Frost
2.3.3 Evaluation of the accuracy of the system in warning
announcement
To evaluate the accuracy of the IFFS for announcing warnings, the system was placed in an orchard
under different weather conditions in the months of March and May. Then the performance of the IFFS in
sending SMS in frost conditions was evaluated.
3. Results And Discussion
To evaluate the performance of the IFFS system, the hardware is located in the orchard near the trees.
The distance between the sensor node and Raspberry Pi could be a maximum of 1000 meters and the
height of the sensor from the ground level should be 1.5-2 meters. The results are presented as follows:
3.1 Evaluation of the performance of the IFFS in measuring the temperature and relative humidity of the
air
In Fig. 3 the result of comparing the air temperature recorded by the IFFS with the air temperature
recorded by the meteorological reference sensor is shown. Based on the figure, the correlation between air
temperature data recorded by the IFFS and the air temperature data recorded by the meteorological
sensor was 0.99. The results confirm the accuracy of the temperature sensor.
Also, in Fig. 4. the result of comparing the air relative humidity recorded by the IFFS with the air relative
humidity recorded by the meteorological sensor is shown.
Based on the figure, the data of the air relative humidity recorded by the IFFS had a correlation of 0.98
with the air relative humidity data of the meteorological reference sensor. Therefore, the sensor has
sufficient accuracy to measure the air relative humidity in real conditions.
Page 7/163.2 Evaluation of the performance of IFFS in frost
forecasting
The confusion matrix of the test data is shown in Fig. 5. Also, the results of measuring accuracy,
sensitivity, specificity, and F-Score are presented in Table 1.
Based on the figure, out of 495 data used for the testing model, 390 data forecasted non-frost conditions
(True Positive) and 75 data forecasted freezing conditions (True Positive). The 20 data forecasted frost
(False Positive) and 10 data forecasted non-frost (False Negative).
Based on the results of Table 1, the accuracy of the IFFS forecasting model was 94%. In fact, 94% of frost
and non-frost events forecasting were correct, and the false positive error was about six percent. The
sensitivity of the IFFS forecasting model was also 88.2%. In other words, more than 88% of the results
that forecasted frost were corrected and the false negative error was about 12%. Also, the specificity of
the IFFS obtained 0.95 means that 95% of the results of forecasting non-frost events were corrected. Also,
the F-score or harmonic mean of results of accuracy and sensitivity was equal to 96%, which shows the
high accuracy of the forecasting model.
Table 1
The results of the confusion matrix of test data
Accuracy Sensitivity Specificity F-Score
0.939 0.882 0.951 0.963
3.3 Evaluation of the performance of the IFFS in frost
warning announcement
The result of the evaluation of the performance of the IFFS in warning announcement is presented in
Table 2. In all cases where the IFFS forecasted the frost, a warning message was sent to the farmer. Also,
in all the cases where the IFFS forecasted the non-frost, a warning message was not sent to the farmer.
The results indicated an accuracy of 100% in warning announcements.
Page 8/16Table 2
The performance of the IFFS in warning announcement
Frost Forecasting Warning Announcement
Frost No Frost Sending SMS Not Sending SMS
√ - √
√ - √ -
- √ - √
√ - √ -
- √ - √
- √ - √
√ - √ -
√ - √ -
√ - √ -
- √ - √
This system is designed in such a way that it announces warning messages in two situations:
- When forecasting the frost in the next three hours
- When the sensor node does not send data to the Raspberry PI according to the schedule (due to battery
or sensor failure).
4. Conclusions
In this research, an intelligent system for local-scale forecasting of radiation frost and announcing
warnings to farmers is designed and constructed. This system is based on IoT and consists of 4 layers
including a perception layer, network layer, intelligent forecasting layer and application layer. Intelligent
Frost forecasting was done using the deep learning method and gradient boosting algorithm. The 10-year
meteorological data (from 2011–2021) were used to train the network. If frost is forecasted within the
next three hours, the system will announce a warning via SMS to the farmer.
The performance evaluation result showed that the accuracy of the IFFS in measuring air temperature
and air relative humidity was 0.99 and 0.98, respectively. Also, the F-score obtained 0.96 and the accuracy
in announcing the warning was 100%. Due to the acceptable accuracy of the system, the IFFS is
recommended for forecasting radiation frost. This system can be developed to forecast radiation frost of
all agricultural products by having air temperature, air relative humidity and dew point temperature data
of the last 10 years of the region, and the frost critical temperature of the plant.
Page 9/16To get better results in using this system, farmers must do the following work:
- Always keep the mobile phone on while using the IFFS.
- Considering the plant protective equipment must start working before the air temperature reaches the
critical value, operators should turn on equipment at least 30 minutes before starting the forest.
Declarations
Acknowledgement
The authors are grateful to the Agricultural Jihad Organization of Lorestan Province for the financial
support of the project and thanks to the Meteorological organization of Alborz Province for their
cooperation in the performance evaluation of the sensor.
Ethical Approval
not applicable
Competing interests
not applicable
Authors' contributions
N. Bagheri gathered data, designed and constructed the IFFS and also evaluated it. M. Bagheri
cooperated in the design and construction of the IFFS and also he designed an artificial intelligent part of
the IFFS. M. Sepahvand cooperated in gathering data and evaluating the IFFS.
Funding
This project is supported by the Agricultural Jihad Organization of Lorestan Province of Iran (Grant No.
15583-166748).
Availability of data and materials
The data that support the findings of this research are available from the Agricultural Jihad Organization
of Lorestan Province but restrictions apply to the availability of these data, which were used under license
for the current research, and so are not publicly available.
Code Availability
The code is subject to third-party restrictions. So, it is not available.
Ethics Approval: Not applicable.
Page 10/16Consent to Participate: All authors have read and agreed to the published version of the manuscript.
Consent for Publication: All authors guarantee that the manuscript is an independent and original
achievement, and the content is free from plagiarism and plagiarism. The relevant contents of the
manuscript have not been published in various languages at home and abroad. No
longer contribute to any other publication in any language after submitting to the magazine; This paper
does not submit more than one draft. All authors agree with the above statement.
Conflicts of interest: The authors declare that they have no competing or conflicting interests.
References
1. Fraisse CW, Breuer NE, Zierden D, Bellow JD, Paz J, Cabrera VE, Garcia A, Garcia Y, Ingram KT, Hatch
U, Hoogenboomd G, Jones JW, O’Brien JJ (2006) AgClimate: A climate forecast information system
for agricultural risk management in the southeastern USA. Computers and Electronics in Agriculture
53: 13–27. https://doi.org/10.1016/j.compag.2006.03.002
2. Hoogenboom G (2000) Contribution of agrometeorology to the simulation of crop production and its
applications. Agricultural and Forest Meteorology. 103 (1-2): 137-157.
https://doi.org/10.1016/S0168-1923(00)00108-8
3. Ding L, Tamura Y, Yoshida S, Owada K, Toyoda T, Morishita Y, Noborio K, Shibuya K (2021) Ensemble
casual modeling for frost forecast in vineyard. 25th International Conference on Knowledge-based
and Intelligent Information & Engineering Systems. Procedai Computer Science 192. 3194-3203.
https://doi.org/ 10.1016/j.procs.2021.09.092
4. Chevalier RF, Hoogenboom G, McClendon RW, Paz JO (2012) A web-based fuzzy expert system for
frost warnings in horticultural crops. Environmental Modelling & Software 35: 84-91.
https://doi.org/10.1016/j.envsoft.2012.02.010
5. Guillen-Navarro MA, Martinez-Espana R, Lopez B, Cecilia JM (2021) A high-performance IoT solution
to reduce frost damages in stone fruits. Concurrency and Computation: Practice and Experience. 33
(2). e5299. https://doi.org/10.1002/cpe.5299
6. Fraisse C, Andreis J, Borba T, Cerbaro V, Gelcer E, Pavan W, Pequeno D, Perondi D, Shen. X, Staub C,
Uryasev O, Wagner AP (2016) AgroClimate – Tools for managing climate risk in agriculture.
Agrometeoros 24 (1): 121-129.
7. Takle ES (1990) Bridge and roadway frost: occurrence and prediction by use of an expert system.
Journal of Applied Meteorology 29: 727-734. https://doi.org/10.1175/1520-
0450(1990)0292.0.CO; 2
8. Robinson C, Mort N (1997). A neural network system for the protection of citrus crops from frost
damage. Computer and Electronics in Agriculture. 16 (3): 177-187. .https://doi.org/10.1016/S0168-
1699(96)00037-3
Page 11/169. Hubbard K, Mahmood R, Carlson C (2003) Estimating daily dew point temperature for the northern
great plains using maximum and minimum temperature. Agronomy Journal 95: 323–328.
https://doi.org/10.2134/agronj2003.0323
10. Jain A, McClendon RW, Hoogenboom G (2006) Freeze prediction for specific locations using artificial
neural networks. Transactions of the ASABE 49 (6): 1955-1962.
https://doi.org/10.13031/2013.22275
11. Prabha T, Hoogenboom G (2008) Evaluation of the Weather Research and Forecasting model for two
frost events. Computers and Electronics in Agriculture. 64 (2): 234-247.
https://doi.org/10.1016/j.compag.2008.05.019
12. Shank DB, Hoogenboom G, McClendon RW (2008) Dew point temperature prediction using artificial
neural networks. Journal of Applied Meteorology and Climatology. 47 (6): 1757-1769.
https://doi.org/10.1080/08839510802226785
13. Smith BA, Hoogenboom G, McClendon RW (2009) Artificial neural networks for automated year-
round temperature prediction. Computers and Electronics in Agriculture 68 (1): 52-61.
https://doi.org/10.1016/j.compag.2009.04.003
14. Castaneda-Miranda A, Castano-Meneses VM (2017) Smart frost control in greenhouses by neural
networks models. Computers and Electronics in Agriculture 137: 102-114.
https://doi.org/10.1016/j.compag.2020.105614
15. Castaneda-Miranda A, Castano-Meneses VM (2020). Internet of things for smart farming and frost
intelligent control in greenhouses. Computers and Electronics in Agriculture 176: 105-114.
https://doi.org/10.1016/j.compag.2020.105614
16. Ding L, Tamura Y (2021). Frost forecast -a practice of machine learning from data. International
Journal Reasoning-based Intelligent Systems. 13(4): 191-203.
https://doi.org/10.1504/IJRIS.2021.10038162
17. Perry KB (1998) Basics of frost and freeze protection for horticultural crops. HortTechnology 8: 10-
15. https://doi.org/10.21273/HORTTECH.8.1.10
18. Alizadeh A (2006) Principles of applied hydrology. Publications of Imam Reza University. Twenty-
sixth edition. 811 pages. (In Persian)
19. Cadenas JM, Garrido MC, Martinez-Espana R, Guillen-Navarro MA (2020) Making decisions for frost
prediction in agricultural crops in a soft computing framework. Computers and Electronics in
Agriculture. 175. 105587. https://doi.org/10.1016/j.compag.2020.105587
20. Hand DJ, Christen P, Kirielle N (2021) F*: an interpretable transformation of the F‑measure. Machine
Learning 110: 451–456. https://doi.org/10.1007/s10994-021-05964-1
Figures
Page 12/16Figure 1
The IFFS system
Page 13/16Figure 2
The IoT-based block diagram of the IFFS
Figure 3
Page 14/16Comparing the air temperature recorded by the IFFS with the air temperature recorded by the reference
sensor
Figure 4
Comparing the air relative humidity recorded by the IFFS with the air relative humidity recorded by the
reference sensor
Page 15/16Figure 5
The confusion matrix of the test data
Page 16/16You can also read