A Machine Learning Approach for Mortality Prediction in COVID-19 Pneumonia: Development and Evaluation of the Piacenza Score - Journal of Medical ...
←
→
Page content transcription
If your browser does not render page correctly, please read the page content below
JOURNAL OF MEDICAL INTERNET RESEARCH                                                                                                               Halasz et al

     Original Paper

     A Machine Learning Approach for Mortality Prediction in COVID-19
     Pneumonia: Development and Evaluation of the Piacenza Score

     Geza Halasz1*, MD; Michela Sperti2*, PhD; Matteo Villani3, MD; Umberto Michelucci4, PhD; Piergiuseppe Agostoni5,
     MD; Andrea Biagi1, MD; Luca Rossi1, MD; Andrea Botti6, MD; Chiara Mari6, MD; Marco Maccarini7, MSc; Filippo
     Pura7, MSc; Loris Roveda7, MSc; Alessia Nardecchia8, PhD; Emanuele Mottola9, BA; Massimo Nolli3, MD; Elisabetta
     Salvioni5, MD; Massimo Mapelli5, MD; Marco Agostino Deriu2, PhD; Dario Piga7, PhD; Massimo Piepoli1, MD,
     PhD
     1
      Department of Cardiology, Guglielmo Da Saliceto Hospital, Piacenza, Italy
     2
      PolitoBIOMed Lab, Department of Mechanical and Aerospace Engineering, Politecnico di Torino, Torino, Italy
     3
      Anesthesiology and ICU Department, Guglielmo da Saliceto Hospital, Piacenza, Italy
     4
      TOELT LLC - AI Research and Development, Dubendorf, Switzerland
     5
      Department of Clinical Sciences and Community Health, Centro Cardiologico Monzino, Istituto di Ricovero e Cura a Carattere Scientifico, Milano,
     Italy
     6
      Department of Clinical and Experimental Medicine, University of Parma, Parma, Italy
     7
      Dalle Molle Institute for Artificial Intelligence, Università della Svizzera italiana/Scuola universitaria professionale della Svizzera italiana, Lugano,
     Switzerland
     8
      Istituto Istruzione Superiore, Casalpusterlengo, Italy
     9
      7HC SRL, Rome, Italy
     *
      these authors contributed equally

     Corresponding Author:
     Geza Halasz, MD
     Department of Cardiology
     Guglielmo Da Saliceto Hospital
     Via Taverna 49,
     Piacenza, 29121
     Italy
     Phone: 39 3517489495
     Email: geza.halasz@gmail.com

     Abstract
     Background: Several models have been developed to predict mortality in patients with COVID-19 pneumonia, but only a few
     have demonstrated enough discriminatory capacity. Machine learning algorithms represent a novel approach for the data-driven
     prediction of clinical outcomes with advantages over statistical modeling.
     Objective: We aimed to develop a machine learning–based score—the Piacenza score—for 30-day mortality prediction in
     patients with COVID-19 pneumonia.
     Methods: The study comprised 852 patients with COVID-19 pneumonia, admitted to the Guglielmo da Saliceto Hospital in
     Italy from February to November 2020. Patients’ medical history, demographics, and clinical data were collected using an
     electronic health record. The overall patient data set was randomly split into derivation and test cohorts. The score was obtained
     through the naïve Bayes classifier and externally validated on 86 patients admitted to Centro Cardiologico Monzino (Italy) in
     February 2020. Using a forward-search algorithm, 6 features were identified: age, mean corpuscular hemoglobin concentration,
     PaO2/FiO2 ratio, temperature, previous stroke, and gender. The Brier index was used to evaluate the ability of the machine learning
     model to stratify and predict the observed outcomes. A user-friendly website was designed and developed to enable fast and easy
     use of the tool by physicians. Regarding the customization properties of the Piacenza score, we added a tailored version of the
     algorithm to the website, which enables an optimized computation of the mortality risk score for a patient when some of the
     variables used by the Piacenza score are not available. In this case, the naïve Bayes classifier is retrained over the same derivation
     cohort but using a different set of patient characteristics. We also compared the Piacenza score with the 4C score and with a naïve
     Bayes algorithm with 14 features chosen a priori.

     https://www.jmir.org/2021/5/e29058                                                                         J Med Internet Res 2021 | vol. 23 | iss. 5 | e29058 | p. 1
                                                                                                                              (page number not for citation purposes)
XSL• FO
RenderX
JOURNAL OF MEDICAL INTERNET RESEARCH                                                                                                 Halasz et al

     Results: The Piacenza score exhibited an area under the receiver operating characteristic curve (AUC) of 0.78 (95% CI 0.74-0.84,
     Brier score=0.19) in the internal validation cohort and 0.79 (95% CI 0.68-0.89, Brier score=0.16) in the external validation cohort,
     showing a comparable accuracy with respect to the 4C score and to the naïve Bayes model with a priori chosen features; this
     achieved an AUC of 0.78 (95% CI 0.73-0.83, Brier score=0.26) and 0.80 (95% CI 0.75-0.86, Brier score=0.17), respectively.
     Conclusions: Our findings demonstrated that a customizable machine learning–based score with a purely data-driven selection
     of features is feasible and effective for the prediction of mortality among patients with COVID-19 pneumonia.

     (J Med Internet Res 2021;23(5):e29058) doi: 10.2196/29058

     KEYWORDS
     artificial intelligence; prognostic score; COVID-19; pneumonia; mortality; prediction; machine learning; modeling

     Introduction                                                        Methods
     Despite measureless efforts to limit the spread of COVID-19,        Population and Collected Data
     over 100 million people have been confirmed positive for            The study was conducted at Guglielmo da Saliceto Hospital,
     SARS-CoV-2 infection and more than 2 million people have            which serves a population of about 300,000 people in the area
     died from the virus worldwide, as of February 10, 2021 [1].         of Piacenza, Emilia Romagna, in northern Italy. This region has
     While these numbers are rapidly increasing day by day, hospitals    the second highest number of COVID-19 deaths in the country
     have been receiving requests beyond capacity and face extreme       (6219 as of December 7, 2020).
     challenges concerning a sharp increase in the demand for
     medical resources as well as a shortage of hospital beds and        This study retrospectively analyzed the EHRs of a cohort of
     critical care equipment for the timely treatment of ill patients.   852 patients diagnosed with COVID-19 pneumonia according
     Additionally, the clinical spectrum of SARS-CoV-2 infections        to the World Health Organization interim guidance and admitted
     ranges from asymptomatic status to severe viral pneumonia           to the hospital from February to November 2020. COVID-19
     with respiratory failure and even death, making reliable and        infection was diagnosed by a positive result on a reverse
     successful patient triaging challenging [2].                        transcriptase–polymerase chain reaction (RT-PCR) assay of a
                                                                         specimen collected on a nasopharyngeal swab. Pregnant women,
     Data from epidemiological studies suggest that severe illness       children (
JOURNAL OF MEDICAL INTERNET RESEARCH Halasz et al
represents the mortality risk; (2) it can handle both categorical validation cohort has been considered to further validate the
and continuous features; and (3) it can handle missing values, Piacenza score performance. The external validation cohort
thus providing a mortality risk even when all variable inputs consisted of data from 86 patients with COVID-19 enrolled at
for a patient are not available. Moreover, it proved a successful Centro Cardiologico Monzino Hospital (Milan, Italy).
approach in predicting clinical outcomes in several medical
The performance of Piacenza score was evaluated in terms of
scenarios [9,10]. Other key advantages of using a naïve Bayes
discrimination and calibration capabilities. The discrimination
classifier are its easy implementation, computational efficiency,
ability was determined by computing the receiver operating
optimal scaling performance, and the fact that it achieves good
characteristic (ROC) curve on the test cohort and the associated
results even in small data sets. Furthermore, it is not influenced
AUC, together with its 95% CI. As additional metrics, the
by irrelevant features or outliers.
negative predictive value (NPV), the positive predictive value
Its major limitation stands in the assumption at the core of the (PPV), the accuracy, the sensitivity, the specificity, and the F1
method: features independence. Even if this assumption is and F2 scores were computed. These metrics were calculated
almost never satisfied, the classifier proved to reach reasonable for a threshold value obtained by maximizing the F2 score. The
results in many scenarios, especially in text classification. calibration ability was derived by the so-called calibration plots,
Another drawback of naïve Bayes is that if a categorical feature which compare observed and predicted outcomes with associated
presents a value in the test data set, which was not observed in uncertainties. The Brier index was used to evaluate the ability
the training data set, then the model will be unable to make a of machine learning to stratify and predict observed outcomes.
prediction. Nevertheless, this issue can be solved with various The Brier index is defined as the mean-squared difference
smoothing techniques. Patients missing some features can be between the observed and predicted outcomes and ranges from
easily handled. In fact, only the features’ probability 0 to 1, with 0 representing the best calibration.
distributions need to be computed in training a naïve Bayes
Finally, the variable relative importance was quantified for the
classifier. Thus, no imputation was performed and all patients
identified 6 most relevant patient features. The relative
were included in the training phase, since not all missing data
importance is a comparative measure of the patient feature’s
were considered for every feature. Furthermore, when applying
weight in determining the Piacenza risk score.
the trained model to make inferences, the final user can insert
missing data, still obtaining a reliable result. Usability, Flexibility, and Customization
Derivation and Test Cohorts The Piacenza score was specifically designed to be an easy,
fast, versatile, fair, open, and user-friendly tool. To reach this
The EHRs of 852 patients were randomly split into derivation
goal, a web-based calculator of the score, via a website, was
(70%) and test (30%) cohorts. The derivation cohort was first
released [12]. This calculator can be used by clinicians to
used to select, among the considered 62 patient features, the
estimate a hospitalized patient’s risk of 30-day mortality.
most significant ones, and then to train the naïve Bayes classifier
using only the best predictors, while the predictive ability of We added a tailored version of the algorithm to the website,
the estimated model was assessed on the test cohort. which enables an optimized computation of the mortality risk
score for a patient even when some variables used by the
Piacenza Score Development, Optimization, and Piacenza score are not available. In this case, the naïve Bayes
Identification of Variable Importance classifier is retrained over the same derivation cohort but using
The Piacenza score has been developed and tailored to (1) a different set of patient characteristics. Moreover, a second
minimize the number of clinical variables to be ingested and naïve Bayes model has been presented as a possible example
(2) to maximize the overall prediction performance (ie, in terms of the Piacenza score’s customization and flexibility. The
of maximization of the area under the receiver operating above-mentioned model has been trained with the following 14
characteristic curve [AUC]) and patient stratification ability. variables, chosen a priori by the physician for their association
The most significant patient features were identified through with mortality in COVID-19 pneumonia: age, gender, diabetes,
the so-called forward-search approach [11]. length of symptoms before hospital admission, systolic blood
pressure, respiratory rate, PaO2/FiO2 ratio, platelets and
The forward-search approach is a purely data-driven
dimensionality reduction technique that is able to identify, given eosinophils count, neutrophil-to-lymphocyte ratio, C-reactive
a large set of input features, the minimum combination of those protein, direct bilirubin, creatinine, and lactate dehydrogenase.
features, which maximizes the performance metrics associated Finally, we compared the performance of the Piacenza score
with a machine learning algorithm. The forward-search approach with the above-mentioned “clinical” naïve Bayes classifier to
was employed here to reduce the number of patient variables show the flexibility of the method, which can be easily retrained
from 62 to the 6 most relevant ones used to train the naïve Bayes with another subset of predictors.
classifier. Website Design and Development
Piacenza Score Evaluation and Metrics The website has been developed in Python (Python Software
The test cohort was used to assess the performance of the Foundation), using the Flask framework, and Hosting is
Piacenza score. In order to increase the statistical significance managed through Docker.
of the results, bootstrapping was used to randomly generate 100 The site consists of three main pages: Home, Custom Analysis,
test sets from the original test cohort. Moreover, an external and Multiple Analysis. The Home and the Custom Analysis
https://www.jmir.org/2021/5/e29058 J Med Internet Res 2021 | vol. 23 | iss. 5 | e29058 | p. 3
(page number not for citation purposes)
XSL• FO
RenderXJOURNAL OF MEDICAL INTERNET RESEARCH Halasz et al
pages require submitting a form that is dynamically composed test to assess differences between binary variables and the Welch
in the backend through a Python dictionary variable. This allows two-sample t test to assess differences between continuous
us to easily change the form without changing the HTML code. variables. The overall implementation of all codes for the
The current dictionary contains the following fields machine learning score and analysis tools was performed in the
characterizing the features: name, type (continuous or binary), Python 3.7.4 environment. The Python libraries employed were
measurement unit, information for the user, value, and pandas (for data set management), NumPy (for numerical
mandatory flag. computations), and sklearn (for data set preprocessing; eg, data
set splitting). The naïve Bayes classifier at the core of the
On the Home page, once a form is submitted, the backend
Piacenza score was manually implemented (without any
receives and sends the parsed data to the previously trained
additional machine learning framework used) since an existing
naïve Bayes classifier, which computes the mortality risk that
algorithm for naïve Bayes classification dealing both with
is visualized on the website, typically in less than 1 second. On
continuous and categorical variables as well as missing data
the Custom Analysis page, once a form is submitted and parsed,
was not available in the sklearn library. The forward-search
a naïve Bayes classifier is trained using only the specified
algorithm for feature selection was also manually implemented.
features. Since the overall training process may be
time-consuming as it also performs feature selection, the final
results are automatically sent to the email address specified by
Results
the user after completing the training. The Multiple Analysis Patient Characteristics and Events
page allows users to compute mortality risks for many patients,
without the need to manually fill in a form for every single A total of 852 patients with SARS-CoV-2 pneumonia were
patient. Clinicians are requested to submit a CSV hospitalized during the study period, of which 242 (28%) were
(comma-separated values) file containing the values of the 6 admitted to the intensive care unit (ICU). The mean age of the
features characterizing the Piacenza score. An example of the patients was 70 (SD 14) years, and 599 (70%) were male.
structure of a CSV file is provided on the website. Comorbidities were present in 602 patients (71%): mainly
arterial hypertension (n=499, 59%), dyslipidemia (n=205, 24%),
Comparison With Conventional Risk Models and diabetes (n=157, 18%). The mean time between onset of
To further assess the performance of the Piacenza score, we symptoms and hospital admission was 6.5 (SD 3.9) days. Fever
compared it with the 4C mortality score, which considers the (n=776, 91%), dyspnea (n=543, 64%), and cough (n=400, 47%)
following predictors: age, gender, number of comorbidities, were the most common symptoms at admission. A total of 293
respiratory rate, peripheral oxygen saturation (sO2), level of patients (34%) died within 30 days after hospital admission.
consciousness (Glasgow coma scale), urea level, and C-reactive The median time from hospital admission to discharge or death
protein. The same test cohort used to test the Piacenza score was 9 days. A comparison of clinical characteristics between
was employed. survivors and nonsurvivors showed that the latter were older
(PJOURNAL OF MEDICAL INTERNET RESEARCH Halasz et al
Table 1. Study population characteristics and a comparison of survivors and nonsurvivors.
Characteristic All patients (N=852) Patients discharged alive (n=559) Deceased patients (n=293) P valuea
Gender (male), n (%) 599 (70) 386 (69) 213 (73) .30
Age (years), mean (SD) 70 (14) 65 (14) 78 (10) .001
Comorbidities, n (%) 602 (71) 364 (65) 238 (81) .001
Hypertension 499 (59) 294 (53) 205 (70) .001
Atrial fibrillation 109 (13) 58 (10) 51 (17) .005
Chronic obstructive pulmonary disease 130 (15) 76 (14) 54 (18) .07
Dyslipidemia 205 (24) 132 (24) 73 (25) .67
Chronic kidney disease 75 (9) 42 (8) 33 (11) .07
Diabetes 157 (18) 90 (16) 67 (23) .02
Cancer 65 (8) 38 (7) 27 (9) .22
Stroke 28 (3) 9 (2) 19 (6) .001
Peripheral artery disease 19 (2) 10 (2) 9 (3) .23
Coronary artery disease 96 (11) 58 (10) 38 (13) .26
Symptoms
Time from symptom onset to admis- 6.54 (3.94) 6.71 (3.79) 6.27 (4.16) .001
sion, mean (SD)
Fever, n (%) 776 (91) 513(92) 263(90) .32
Dyspnea, n (%) 543 (64) 317(57) 225(77) .002
Cough, n (%) 400 (47) 280 (50) 120 (41) .18
Fatigue, n (%) 174 (20) 118 (21) 56 (19) .32
Diarrhea, n (%) 77 (9) 66 (12) 11(4) .05
Syncope, n (%) 43 (5) 36 (6.5) 7 (2) .18
Baseline clinical findings, mean (SD)
PaO2/FiO2 ratio 225.93 (96.34) 270.54 (83.82) 196.54 (92.70) .001
pH 7.45 (0.07) 7.46 (0.07) 7.45 (0.07) .35
PaO2 60.16 (18.58) 59.68 (15.94) 60.56 (20.54) .71
PaCO2 35.75 (10.37) 35.36 (8.52) 36.05 (11.58) .62
HCO3 25.43 (6.78) 26.22 (9.12) 24.81 (3.97) .23
a
P value refers to either the Student t test or the chi-square test. Italicized values are significant.
Major laboratory markers were tracked upon admission. values (PJOURNAL OF MEDICAL INTERNET RESEARCH Halasz et al
Table 2. Laboratory findings upon admission for the overall study sample and a comparison of survivors and nonsurvivors.
Laboratory parameter All patients (N=852), mean Patients discharged alive (n=559), Deceased patients (n=293), P valuea
(SD) mean (SD) mean (SD)
Glucose (mg/dl) 145 (66) 137 (59) 159 (76) .001
Urea (mg/dl) 57 (40) 47 (24) 76 (54) .001
Creatinine (mg/dl) 1.24 (0.90) 1.06 (0.54) 1.59 (1.27) .001
Sodium (mEq/l) 137 (8) 137 (8) 137 (7) .24
Potassium (mEq/l) 4.17 (0.55) 4.14 (0.49) 4.24 (0.65) .04
Chloride (mEq/l) 99.26 (7.21) 98.84 (7.19) 100.05 (7.17) .02
Total bilirubin (mg/dl) 0.75 (0.48) 0.72 (0.35) 0.82 (0.66) .02
Direct bilirubin (mg/dl) 0.22 (0.60) 0.21 (0.69) 0.25 (0.37) .31
ASTb (U/L) 61 (84) 53 (37) 79 (136) .004
ALTc (U/L) 48 (70) 47 (44) 48 (103) .90
LDHd (U/L) 430 (220) 391 (160) 509 (292) .001
Creatine kinase (U/L) 300 (637) 231 (387) 429 (932) .001
Amylase (U/L) 73 (48) 69 (37) 80 (63) .01
Lipase (U/L) 47 (72) 43 (46) 56 (105) .06
Serum cholinesterase (U/L) 6275 (1858) 6674 (1763) 5576 (1812) .001
e 3 8.12 (4.68) 7.86 (4.72) 8.63 (4.56) .02
WBC × 10 /µl
RBCf × 106/µl 4.69 (0.72) 4.79 (0.68) 4.51 (0.77) .001
Hemoglobin (g/dl) 13.59 (1.91) 13.83 (1.72) 13.14 (2.16) .001
Hematocrit (%) 41.84 (5.70) 42.37 (5.34) 40.83 (6.22) .001
MCVg (fl) 89.74 (6.66) 89.18 (5.62) 90.80 (8.19) .003
MCHh (pg) 29.13 (2.38) 29.05 (2.12) 29.28 (2.80) .23
MCHCi (g/dl) 32.43 (1.36) 32.56 (1.15) 32.17 (1.66) .001
Platelets × 103/µl 217.75 (117.90) 221.08 (127.10) 211.41 (97.72) .22
RDWj (%) 13.65 (1.65) 13.27 (0.27) 14.29 (1.99) .001
Neutrophils (%) 77.45 (11.57) 75.81 (11.75) 80.56 (10.55) .001
Lymphocytes (%) 15.17 (9.20) 16.48 (9.45) 12.67 (8.15) .001
Monocytes (%) 6.89 (4.30) 7.16 (4.01) 6.36 (4.76) .02
Eosinophils (%) 0.32 (0.91) 0.38 (1.05) 0.20 (0.54) .001
Lymphocytes × 103/µl 1.09 (0.99) 1.15 (0.94) 0.98 (1.09) .03
Monocytes × 103/µl 0.51 (0.41) 0.52 (0.35) 0.51 (0.51) .77
Eosinophils × 103/µl 0.02 (0.07) 0.03 (0.08) 0.02 (0.05) .04
Neutrophils × 103/µl 6.41 (3.72) 6.05 (3.41) 7.11 (4.15) .001
PTk (seconds) 15.84 (8.38) 15.07 (5.83) 17.03 (11.11) .02
Prothrombin activity (%) 68.40 (15.96) 69.86 (14.38) 66.27 (17.82) .009
INRl 1.40 (0.76) 1.34 (0.65) 1.51 (0.93) .01
PTTm (seconds) 31.70 (5.74) 31.32 (4.48) 32.29 (7.22) .08
PTT ratio 1.02 (0.19) 1.00 (0.14) 1.04 (0.25) .06
C-reactive protein (mg/dl) 11.19 (8.55) 9.85 (7.88) 13.74 (9.17) .001
https://www.jmir.org/2021/5/e29058 J Med Internet Res 2021 | vol. 23 | iss. 5 | e29058 | p. 6
(page number not for citation purposes)
XSL• FO
RenderXJOURNAL OF MEDICAL INTERNET RESEARCH Halasz et al
Laboratory parameter All patients (N=852), mean Patients discharged alive (n=559), Deceased patients (n=293), P valuea
(SD) mean (SD) mean (SD)
NLRn 7.99 (6.74) 6.78 (5.04) 10.27 (8.68) .001
a
P value refers to either the Student t test or the chi-square test. Italicized values are significant.
b
AST: aspartate aminotransferase.
c
ALT: alanine aminotransferase.
d
LDH: lactate dehydrogenase.
e
WBC: white blood cell count.
f
RBC: red blood cell count.
g
MCV: mean corpuscular volume.
h
MCH: mean corpuscular hemoglobin.
i
MCHC: mean corpuscular hemoglobin concentration.
j
RDW: red cell distribution width.
k
PT: prothrombin time.
l
INR: international normalized ratio.
m
PTT: partial thromboplastin time.
n
NLR: neutrophil-to-lymphocyte ratio.
The NPV of the Piacenza score was 93% with a PPV of 40%
Significant Predictors and the Piacenza Score (Table 3).
Using the forward-search algorithm, the following 6 most
important predictors at hospital admission were identified and The calibration plot of the Piacenza score over the range of risk
used to compute the Piacenza score: age, MCHC, PaO2/FiO2 showed a Brier score of 0.19. The risk deciles are grouped into
three levels: low risk (first to fifth deciles), intermediate risk
ratio, temperature, previous cerebrovascular stroke, and gender.
(sixth to eighth deciles), and high risk (ninth and tenth deciles).
The median of the ROC curve over 100 test cohorts (generated A gradual and progressive increase in absolute event rates was
through bootstrapping) is reported in Figure 1. The observed across risk classes for all the Piacenza scores (death:
corresponding median of the AUC is equal to 0.78 (95% CI 14% [18/125] in low-risk deciles vs 36% [27/75] in
0.74-0.84) with a sensitivity of 94% and specificity of 37%. intermediate-risk deciles vs 66% [33/50] in high-risk deciles).
Figure 1. (A) Receiver operating characteristic (ROC) curves obtained by evaluating the Piacenza score (red curve) on the test cohort and on the
external validation cohort. (B) ROC curves obtained by evaluating the Piacenza score (red curve) and the naïve Bayes (NB) model trained with 14
manually chosen features (green curve). AUC: area under the ROC curve.
https://www.jmir.org/2021/5/e29058 J Med Internet Res 2021 | vol. 23 | iss. 5 | e29058 | p. 7
(page number not for citation purposes)
XSL• FO
RenderXJOURNAL OF MEDICAL INTERNET RESEARCH Halasz et al
Table 3. Negative predictive value (NPV), positive predictive value (PPV; or precision), accuracy, sensitivity (or recall), specificity, F1 score, and F2
score for all scores. These metrics have been calculated for a specific threshold value on the final risk score probability chosen by maximizing the F2
score, the reason being that F2 privileges a high recall and therefore a broader confidence for correctly identifying patients at risk.
Scores Threshold NPV PPV Accuracy Sensitivity Specificity F1 score F2 score
Piacenza score 0.16 0.93 0.40 0.55 0.94 0.37 0.56 0.74
Piacenza score–external 0.16 0.97 0.37 0.57 0.95 0.44 0.53 0.72
validation
Naïve Bayes model 0.04 0.88 0.54 0.67 0.88 0.55 0.67 0.78
trained with 14 manually
chosen features
4C mortality score 0.12 0.98 0.39 0.53 0.99 0.34 0.56 0.76
From the computed calibration plot, we can observe that the Regarding the relative importance of each features independent
mortality risk is underestimated only in the first few deciles, from the others, age was the most important feature to predict
while in the higher deciles the risk is slightly overestimated death followed by MCHC, PaO2/FiO2 ratio, previous
(Figure 2A-D). cerebrovascular stroke, gender, and temperature (Figure 3).
Figure 2. Risk of observed death according to deciles of event probability based on the Piacenza score (A), the Piacenza score on the external validation
data set (B), and the naïve Bayes (NB) model trained with 14 manually chosen features (C). For every single case, the corresponding calibration plots
with standard deviations calculated over the deciles are also shown below each respective graph (D, E, and F).
https://www.jmir.org/2021/5/e29058 J Med Internet Res 2021 | vol. 23 | iss. 5 | e29058 | p. 8
(page number not for citation purposes)
XSL• FO
RenderXJOURNAL OF MEDICAL INTERNET RESEARCH Halasz et al
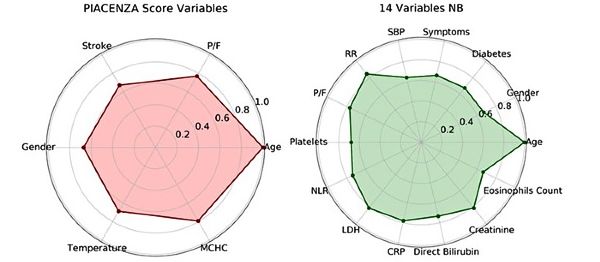
Figure 3. Radar plot for the 6 Piacenza score predictors of death and for the 14 manually chosen features, showing their relative importance. Feature
importance is scaled with respect to the most important feature. NB: naïve Bayes, MCHC: mean corpuscular hemoglobin concentration, CRP: C-reactive
protein, LDH: lactate dehydrogenase, NLR: neutrophil-to-lymphocyte ratio, P/F: PaO2/FiO2, RR: respiratory rate, SBP: systolic blood pressure.
Comparison With the 4C Mortality Score and the
External Validation
Naïve Bayes Model Using Manually Chosen Features
The corresponding median of the AUC in the external validation
cohort was 0.79 (95% CI 0.68-0.89) with a Brier score of 0.16 The median of the AUC was 0.78 (95% CI 0.73-0.83) with a
(Figure 1A), a sensitivity of 95%, and a specificity of 44% sensitivity of 99% and specificity of 34% for the 4C score when
(Table 3). evaluated on the test cohort. The corresponding Brier score was
equal to 0.26 (Figure 4). The naïve Bayes model with 14 features
The calibration plot is reported in Figure 2B and showed again chosen manually based on clinician experience achieved an
a gradual and progressive increase in absolute event rates across AUC of 0.80 (95% CI 0.75-0.86) with a sensitivity of 88%, a
risk classes (death: 10% [4/40] in low-risk deciles vs 29% [7/24] specificity of 55%, and a Brier score of 0.17 (Figure 1B). The
in intermediate-risk deciles vs 38% [6/16] in high-risk deciles). detailed performance metrics of both scores are reported in
Table 3. The relative importance of the selected 14 features of
the naïve Bayes model is shown on the radar plot in Figure 3.
Figure 4. Performance of the 4C mortality score (both in terms of discrimination and calibration abilities) calculated on the test cohort. ROC: receiver
operating characteristic, AUC: area under the ROC curve.
The observed mortality increased gradually and progressively deciles vs 36% (18/50) in high-risk deciles. Both scores achieved
for the naïve Bayes model with manually chosen a satisfactory patient stratification only in the last three deciles
features—death: 14% (17/125) in low-risk deciles vs 32% whereas the 4C mortality score overestimated the prediction in
(14/75) in intermediate-risk deciles vs 72% (36/50) in high-risk the high-risk deciles and underestimated it in the low-risk ones
deciles. This was not observed for the 4C score—death: 33% (Figures 2C-4).
(41/125) in low-risk deciles vs 31% (23/75) in intermediate-risk
https://www.jmir.org/2021/5/e29058 J Med Internet Res 2021 | vol. 23 | iss. 5 | e29058 | p. 9
(page number not for citation purposes)
XSL• FO
RenderXJOURNAL OF MEDICAL INTERNET RESEARCH Halasz et al
laboratory markers: lactate dehydrogenase, high-sensitivity
Discussion C-reactive protein, and lymphocyte percentage. This score was
Principal Findings developed from a cohort of 1479 patients and externally
validated in 2 independent cohorts, reaching an accuracy of
In this study, we developed and validated a machine 95% in predicting the risk of mortality. However, the model
learning–based risk score—the Piacenza score—to predict comprised only Chinese patients during the early stages of the
mortality risk among hospitalized patients with COVID-19 outbreak and, more importantly, it seems to have a significant
pneumonia. This score is based on only 6 variables that are selection bias as it did not include patients with mild and
readily available at hospital admission. moderate disease at admission [21].
Satisfactory performance, measured in terms of AUCs in both The 4C mortality score, developed and validated by the
the testing and external validation cohorts, was achieved with International Severe Acute Respiratory and Emerging Infections
excellent patient stratification. More specifically, the Piacenza Consortium, based on 8 clinical and laboratory variables,
score showed a higher sensitivity with a lower specificity. achieved an AUC of 0.78 in predicting mortality. It is easy to
Likewise, it underestimated the mortality risk in the first three use and has a pragmatic design. In fact, to calculate the score,
risk deciles; slight overestimation occurred in the other deciles. no external tool or complex mathematical equation is required,
This behavior is acceptable and preferred in an acute setting and results can be immediately retrieved at the bedside [5].
since the score has been designed as a screening predictive tool However, due to the rapidly evolving characteristics of the virus
capable of correctly identifying patients at low risk from those and its impact on the population, the score should be
at high risk of mortality. continuously updated. For example, the 4C score did not include
In crowded hospitals, and with shortages of medical resources, patients from the second wave of the pandemic. At the same
this simple model can help to quickly prioritize patients: if the time, if a broad range of individuals are included, the score may
patient’s estimated risk is low, the clinician may choose to become unsuitable for more specific clinical scenarios, such as
monitor the patient, whereas a high-risk estimate might support patients affected by severe pneumonia.
aggressive treatment or admission to the ICU. Data from China, The performance of our model is comparable with the 4C
Europe, and the United States reported a hospitalization rate of mortality score applied to the test cohort used in this paper.
20% to 31%, an ICU admission rates from 17% to 35%, and an However, we remark that the 4C mortality score was derived
in-hospital mortality rate between 15% and 40% [13]. In our based on a population of 35,000 patients, while the naïve model
study, the in-hospital 30-day mortality rate was 34% with lower providing the Piacenza score was trained using information
survival rates for older patients with pre-existing comorbidities coming only from 852 patients. This is indicative of the high
and with clinical signs and symptoms suggesting respiratory representativeness of the training cohort considered in our study.
failure at hospital admission. In line with previous findings, we Furthermore, although there is a similar discriminative power
found that the most common laboratory abnormalities among between the 4C score and the Piacenza score, the latter score
patients who died were related to the inflammatory process, showed better performance in stratifying patients according to
renal and liver damage, and procoagulation status [14,15]. their mortality risk, which is of paramount importance in
In the presence of a large number of patients requiring intensive selecting the appropriate treatment and for resource allocations.
care and threatening to overwhelm health care systems around We also externally tested our score, achieving good performance
the world, several models to predict survival and guide clinical and confirming that our data-driven model is robust despite its
decisions in COVID-19 pneumonia were developed [16]. reliance on variables deemed relevant in this context without
However, many of these models have been found to have a high actually knowing their semantics.
risk of bias, which could reflect their development based on a Characteristics of the Piacenza Score
small study population with high risk of overfitting and poor
generalization properties to new cohorts, and without clear The Piacenza score contains parameters reflecting patient
details of model derivation and testing [6]. demographics, comorbidity, and physiology at hospital
admission. It shares some characteristics with the 4C score such
The recent spread of artificial intelligence has brought novel as age, gender, comorbidities, and PaO2/FiO2 but also includes
ways to combat current global pandemics by collecting and unexplored features like temperature and MCHC deriving from
analyzing large amounts of data, identifying trends, stratifying a substantially different selection of variables. Unlike traditional
patients on the basis of risk, and proposing solutions at the scores based on logistic regression analysis mixed with a
population level instead of at the single individual level [17,18]. knowledge-driven approach where a score is assigned by an
Comparison With Other Risk Stratification Scores expert to each of the limited number of selected variables, the
proposed predictive model is purely data driven and is not
During the COVID-19 pandemic, machine learning approaches
affected by a clinically oriented, potentially biased choice of
have been used to predict the outbreak, to diagnose the disease,
variables [22].
to analyze chest x-ray and CT (computed tomography) scan
images, and more recently to predict mortality or progression The Piacenza score is highly customizable and can be adapted
risk to severe respiratory failure [19,20]. as more information becomes available on disease progression
and the impact of interventions like vaccines and new
Yuan and colleagues [21] developed a simple prognostic risk
pharmacological treatments. In fact, the naïve Bayes algorithm,
score based on a logistic regression classifier that included 3
during its learning phase, generates a summary of the data set
https://www.jmir.org/2021/5/e29058 J Med Internet Res 2021 | vol. 23 | iss. 5 | e29058 | p. 10
(page number not for citation purposes)
XSL• FO
RenderXJOURNAL OF MEDICAL INTERNET RESEARCH Halasz et al
where each variable is associated with the outcome in terms of diseases. In this context, several researchers have developed
a probabilistic dependence. This summary describes the prognostic risk scores for HF such as the Seattle Heart Failure
distribution of the current data set and can be quickly and easily Model and the Meta-Analysis Global Group in Chronic Heart
updated when a new observation is available, adapting itself to Failure [23,24]. However, these models do not necessarily
changes within the population. Likewise, if new data are predict mortality in patients with HF at the individual level and
available, they can be used to train a new version of the Piacenza do not present the same flexibility as the Piacenza score. When
score and study the possible fingerprints of COVID-19 variants. dealing with cardiovascular diseases, the flexibility of the scores
is of crucial importance due to the continuous and rapid changes
The Piacenza score is thus highly flexible; if the some of the
in therapeutic strategies; this makes the above-mentioned scores
required variables are missing, the model can be retrained and
less useful or not reliable in clinical practice.
the physician can still receive a customized result (associated
with the best possible accuracy with respect to the variables Limitations
provided). The retraining process can take up to 10 hours, This study has room for further improvement, which is left for
depending on the number of features inserted. However, future work. First, given that the proposed machine learning
depending on future requests, codes can be easily optimized method is purely data driven, our model may vary if a different
and run on more powerful hardware. data set is used. As more data become available, the model can
An example of a personalized model different from the Piacenza be refined and performance of the Piacenza score can further
score is the naïve Bayes model trained with 14 manually chosen increase. To this aim, we are currently looking forward to
features, which showed a predictive power comparable to that subsequent large-sample and multicentered studies. Second, the
of the Piacenza score. Other models differ in performance; forward-selection algorithm (used to select the Piacenza score
however, as demonstrated, the variables age and PaO2/FiO2 predictors and most importantly to personalize the Piacenza
ratio have the biggest contribution to the predictive power of score on any other subset of features) may be an expensive
the model. Therefore, starting with age and the PaO2/FiO2 ratio option to be considered and may surely be optimized in further
and adding more variables will lead to predictive performances versions of the code. Finally, new variables such as d-dimer
similar to that of the Piacenza score, which represents the best and troponin, currently not available, but which are known to
combination for stratifying patients and predicting mortality. be associated with a higher mortality risk in cases of COVID-19
pneumonia may be included in future analyses.
Finally, our score’s predictors were not chosen a priori (like,
for example, the 4C mortality score) but as the product of a Conclusion
machine learning–based optimization technique, which considers In conclusion, we have developed and validated robust machine
the smallest possible subset of leading predictors associated learning models, which could be used to predict the prognosis
with the best possible performance. of patients with COVID-19. The Piacenza score has several
advantages: first, it relies on objective clinical and laboratory
The Piacenza Score Beyond the COVID-19 Pandemic measurements not affected by human interpretation; second, it
The approach proposed in our paper is suitable for risk was tested and validated in patients belonging to the second
stratification and mortality assessment of other conditions as wave of the pandemic; third, it is automatically generated
well, such as heart failure (HF), which constitutes a growing through a combination of variables widely available at hospital
public health issue. In fact, although machine learning has made admission and can be calculated through a user-friendly web
significant contributions to health care in just a few years, little interface; and finally, as opposed to traditional epidemiological
evidence exists on the role of machine learning in predicting predictive models, the Piacenza score has the added advantage
mortality in patients with HF and in general with cardiovascular of adaptive learning, trend-based recalibration, and flexibility.
Acknowledgments
No sponsor had any role in the study design, data collection, data analysis, data interpretation, or writing of the paper.
Authors' Contributions
GH, DP, MV, and MAD conceived the study. A Biagi, LR, A Botti, CM, AN, MM, and ES collected the data. MS, UM, AN,
and DP managed and analyzed the data. MM, FP, LR, and EM developed the website. PA and MN provided clinical expertise.
MP supervised the work. All authors interpreted the results. GH, MAD, MV, and DP wrote the manuscript, which was approved
by all the authors.
Conflicts of Interest
None declared.
References
1. The Novel Coronavirus Pneumonia Emergency Response Epidemiology Team. Vital surveillances: the epidemiological
characteristics of an outbreak of 2019 novel coronavirus diseases (COVID-19)? China CDC Weekly 2020;2(8):113-122
[FREE Full text] [doi: 10.46234/ccdcw2020.032]
https://www.jmir.org/2021/5/e29058 J Med Internet Res 2021 | vol. 23 | iss. 5 | e29058 | p. 11
(page number not for citation purposes)
XSL• FO
RenderXJOURNAL OF MEDICAL INTERNET RESEARCH Halasz et al
2. Guan W, Ni Z, Hu Y, Liang W, Ou C, He J, et al. Clinical Characteristics of Coronavirus Disease 2019 in China. N Engl
J Med 2020 Apr 30;382(18):1708-1720. [doi: 10.1056/nejmoa2002032]
3. Zhou F, Yu T, Du R, Fan G, Liu Y, Liu Z, et al. Clinical course and risk factors for mortality of adult inpatients with
COVID-19 in Wuhan, China: a retrospective cohort study. The Lancet 2020 Mar;395(10229):1054-1062. [doi:
10.1016/s0140-6736(20)30566-3]
4. Biagi A, Rossi L, Malagoli A, Zanni A, Sticozzi C, Comastri G, et al. Clinical and epidemiological characteristics of 320
deceased patients with COVID-19 in an Italian Province: A retrospective observational study. J Med Virol 2020 Nov
29;92(11):2718-2724 [FREE Full text] [doi: 10.1002/jmv.26147] [Medline: 32515500]
5. Knight SR, Ho A, Pius R, Buchan I, Carson G, Drake TM, et al. Correction: Risk stratification of patients admitted to
hospital with covid-19 using the ISARIC WHO Clinical Characterisation Protocol: development and validation of the 4C
Mortality Score. BMJ 2020 Nov 13;371:m4334 [FREE Full text] [doi: 10.1136/bmj.m4334] [Medline: 33187971]
6. Wynants L, Van Calster B, Collins G, Riley RD, Heinze G, Schuit E, et al. Prediction models for diagnosis and prognosis
of covid-19 infection: systematic review and critical appraisal. BMJ 2020 Apr 07;369:m1328 [FREE Full text] [doi:
10.1136/bmj.m1328] [Medline: 32265220]
7. Estiri H, Strasser ZH, Klann JG, Naseri P, Wagholikar KB, Murphy SN. Predicting COVID-19 mortality with electronic
medical records. NPJ Digit Med 2021 Feb 04;4(1):15 [FREE Full text] [doi: 10.1038/s41746-021-00383-x] [Medline:
33542473]
8. Vaishya R, Javaid M, Khan IH, Haleem A. Artificial Intelligence (AI) applications for COVID-19 pandemic. Diabetes
Metab Syndr 2020 Jul;14(4):337-339 [FREE Full text] [doi: 10.1016/j.dsx.2020.04.012] [Medline: 32305024]
9. Wolfson J, Bandyopadhyay S, Elidrisi M, Vazquez-Benitez G, Vock DM, Musgrove D, et al. A Naive Bayes machine
learning approach to risk prediction using censored, time-to-event data. Stat Med 2015 Sep 20;34(21):2941-2957 [FREE
Full text] [doi: 10.1002/sim.6526] [Medline: 25980520]
10. Kanwar MK, Gomberg-Maitland M, Hoeper M, Pausch C, Pittrow D, Strange G, et al. Risk stratification in pulmonary
arterial hypertension using Bayesian analysis. Eur Respir J 2020 Aug 04;56(2):2000008 [FREE Full text] [doi:
10.1183/13993003.00008-2020] [Medline: 32366491]
11. Pudil P, Novovičová J, Kittler J. Floating search methods in feature selection. Pattern Recognition Letters 1994
Nov;15(11):1119-1125. [doi: 10.1016/0167-8655(94)90127-9]
12. Halasz G, Sperti M, Villani M, Michelucci U, Agostoni P, Biagi A, et al. The Piacenza Score. URL: https://covid.7hc.tech
[accessed 2021-05-18]
13. Wiersinga W, Rhodes A, Cheng A, Peacock S, Prescott H. Pathophysiology, Transmission, Diagnosis, and Treatment of
Coronavirus Disease 2019 (COVID-19): A Review. JAMA 2020 Aug 25;324(8):782-793. [doi: 10.1001/jama.2020.12839]
[Medline: 32648899]
14. Kermali M, Khalsa RK, Pillai K, Ismail Z, Harky A. The role of biomarkers in diagnosis of COVID-19 - A systematic
review. Life Sci 2020 Aug 01;254:117788 [FREE Full text] [doi: 10.1016/j.lfs.2020.117788] [Medline: 32475810]
15. Lippi G, Plebani M. Laboratory abnormalities in patients with COVID-2019 infection. Clin Chem Lab Med 2020 Jun
25;58(7):1131-1134. [doi: 10.1515/cclm-2020-0198] [Medline: 32119647]
16. Schwab P, DuMont Schütte A, Dietz B, Bauer S. Clinical Predictive Models for COVID-19: Systematic Study. J Med
Internet Res 2020 Oct 06;22(10):e21439 [FREE Full text] [doi: 10.2196/21439] [Medline: 32976111]
17. Fu Z, Hong S, Zhang R, Du S. Artificial-Intelligence-Enhanced Mobile System for Cardiovascular Health Management.
Sensors (Basel) 2021 Jan 24;21(3):773 [FREE Full text] [doi: 10.3390/s21030773] [Medline: 33498892]
18. D'Ascenzo F, De Filippo O, Gallone G, Mittone G, Deriu MA, Iannaccone M, et al. Machine learning-based prediction of
adverse events following an acute coronary syndrome (PRAISE): a modelling study of pooled datasets. The Lancet 2021
Jan;397(10270):199-207. [doi: 10.1016/s0140-6736(20)32519-8]
19. Ferrari D, Milic J, Tonelli R, Ghinelli F, Meschiari M, Volpi S, et al. Machine learning in predicting respiratory failure in
patients with COVID-19 pneumonia-Challenges, strengths, and opportunities in a global health emergency. PLoS One
2020 Nov 12;15(11):e0239172 [FREE Full text] [doi: 10.1371/journal.pone.0239172] [Medline: 33180787]
20. Yadaw AS, Li Y, Bose S, Iyengar R, Bunyavanich S, Pandey G. Clinical features of COVID-19 mortality: development
and validation of a clinical prediction model. The Lancet Digital Health 2020 Oct;2(10):e516-e525. [doi:
10.1016/s2589-7500(20)30217-x]
21. Yuan Y, Sun C, Tang X, Cheng C, Mombaerts L, Wang M, et al. Development and Validation of a Prognostic Risk Score
System for COVID-19 Inpatients: A Multi-Center Retrospective Study in China. Engineering (Beijing) 2020 Nov 28 [FREE
Full text] [doi: 10.1016/j.eng.2020.10.013] [Medline: 33282444]
22. Taylor RA, Pare JR, Venkatesh AK, Mowafi H, Melnick ER, Fleischman W, et al. Prediction of In-hospital Mortality in
Emergency Department Patients With Sepsis: A Local Big Data-Driven, Machine Learning Approach. Acad Emerg Med
2016 Mar 13;23(3):269-278 [FREE Full text] [doi: 10.1111/acem.12876] [Medline: 26679719]
23. Levy WC, Mozaffarian D, Linker DT, Sutradhar SC, Anker SD, Cropp AB, et al. The Seattle Heart Failure Model: prediction
of survival in heart failure. Circulation 2006 Mar 21;113(11):1424-1433. [doi: 10.1161/CIRCULATIONAHA.105.584102]
[Medline: 16534009]
https://www.jmir.org/2021/5/e29058 J Med Internet Res 2021 | vol. 23 | iss. 5 | e29058 | p. 12
(page number not for citation purposes)
XSL• FO
RenderXJOURNAL OF MEDICAL INTERNET RESEARCH Halasz et al
24. Rich JD, Burns J, Freed BH, Maurer MS, Burkhoff D, Shah SJ. Meta-Analysis Global Group in Chronic (MAGGIC) Heart
Failure Risk Score: Validation of a Simple Tool for the Prediction of Morbidity and Mortality in Heart Failure With Preserved
Ejection Fraction. J Am Heart Assoc 2018 Oct 16;7(20):e009594 [FREE Full text] [doi: 10.1161/JAHA.118.009594]
[Medline: 30371285]
Abbreviations
AUC: area under the receiver operating characteristic curve
CSV: comma-separated values
CT: computed tomography
EHR: electronic health record
HF: heart failure
ICU: intensive care unit
MCHC: mean corpuscular hemoglobin concentration
NPV: negative predictive value
PPV: positive predictive value
ROC: receiver operating characteristic
RT-PCR: reverse transcriptase–polymerase chain reaction
Edited by G Eysenbach; submitted 29.03.21; peer-reviewed by D Lazzeroni, X Cheng, M Elbattah, P Zhao, L Li; comments to author
18.04.21; revised version received 15.05.21; accepted 16.05.21; published 31.05.21
Please cite as:
Halasz G, Sperti M, Villani M, Michelucci U, Agostoni P, Biagi A, Rossi L, Botti A, Mari C, Maccarini M, Pura F, Roveda L, Nardecchia
A, Mottola E, Nolli M, Salvioni E, Mapelli M, Deriu MA, Piga D, Piepoli M
A Machine Learning Approach for Mortality Prediction in COVID-19 Pneumonia: Development and Evaluation of the Piacenza Score
J Med Internet Res 2021;23(5):e29058
URL: https://www.jmir.org/2021/5/e29058
doi: 10.2196/29058
PMID: 33999838
©Geza Halasz, Michela Sperti, Matteo Villani, Umberto Michelucci, Piergiuseppe Agostoni, Andrea Biagi, Luca Rossi, Andrea
Botti, Chiara Mari, Marco Maccarini, Filippo Pura, Loris Roveda, Alessia Nardecchia, Emanuele Mottola, Massimo Nolli,
Elisabetta Salvioni, Massimo Mapelli, Marco Agostino Deriu, Dario Piga, Massimo Piepoli. Originally published in the Journal
of Medical Internet Research (https://www.jmir.org), 31.05.2021. This is an open-access article distributed under the terms of
the Creative Commons Attribution License (https://creativecommons.org/licenses/by/4.0/), which permits unrestricted use,
distribution, and reproduction in any medium, provided the original work, first published in the Journal of Medical Internet
Research, is properly cited. The complete bibliographic information, a link to the original publication on https://www.jmir.org/,
as well as this copyright and license information must be included.
https://www.jmir.org/2021/5/e29058 J Med Internet Res 2021 | vol. 23 | iss. 5 | e29058 | p. 13
(page number not for citation purposes)
XSL• FO
RenderXYou can also read