Joint space and hip osteoarthritis risk Hip joint space width is causally related to hip osteoarthritis risk via distinct protective and ...
←
→
Page content transcription
If your browser does not render page correctly, please read the page content below
medRxiv preprint doi: https://doi.org/10.1101/2023.03.01.23286618; this version posted March 3, 2023. The copyright holder for this preprint
 (which was not certified by peer review) is the author/funder, who has granted medRxiv a license to display the preprint in perpetuity.
                                         It is made available under a CC-BY 4.0 International license .

          Joint space and hip osteoarthritis risk

          Hip joint space width is causally related to hip osteoarthritis risk via distinct protective and

          susceptibility mechanisms: findings from a genome-wide association study meta-analysis

          Monika Frysz1,2 *, Benjamin G. Faber1,2 *, Cindy G. Boer3, Daniel S. Evans4, Raja Ebsim5,
          Kaitlyn A. Flynn MSc6, Mischa Lundberg 7, Lorraine Southam BSc8, April Hartley2, Fiona R.
          Saunders9, Claudia Lindner5, Jennifer S. Gregory9, Richard M. Aspden DSc9, Nancy E.
          Lane10, Nicholas C. Harvey11,12, David M. Evans 2,6,7, Eleftheria Zeggini 8,13, George Davey
          Smith FRS2, Timothy Cootes5, Joyce Van Meurs 3, John P. Kemp2,6,7 +, Jonathan H.
          Tobias1,2 +

          1) Musculoskeletal Research Unit, University of Bristol, UK
          2) Medical Research Council Integrative Epidemiology Unit at the University of Bristol, UK
          3) Department of Internal Medicine, Erasmus Medical Centre, Rotterdam, The Netherlands
          4) California Pacific Medical Center Research Institute, San Francisco, USA
          5) Division of Informatics, Imaging and Data Sciences, The University of Manchester, UK
          6) Institute for Molecular Bioscience, The University of Queensland, Brisbane, Australia
          7) The University of Queensland Diamantina Institute, The University of Queensland,
             Brisbane, Australia
          8) Institute of Translational Genomics, Helmholtz Zentrum Munchen – German Research
             Centre for Environmental Health, Neuherberg, Germany
          9) Centre for Arthritis and Musculoskeletal Health, University of Aberdeen, UK
          10)     Center for Musculoskeletal Health, University of California Davis, Sacramento, USA
          11)     Medical Research Council Lifecourse Epidemiology Centre, University of
             Southampton, UK
          12)     NIHR Southampton Biomedical Research Centre, University of Southampton and
             University Hospital Southampton NHS Foundation Trust, UK
          13)     Technical University of Munich and Klinikum Rechts der Isar, TUM School of
             Medicine, Germany
          *
              joint first author, +joint senior author

          Corresponding author:

          Dr Monika Frysz
          Translational Health Sciences
          Bristol Medical School
          University of Bristol

          Musculoskeletal Research Unit
          Learning and Research Building, Level One
          Southmead Hospital
          Bristol BS10 5NB
          Monika.frysz@bristol.ac.uk

                                                                         1
       NOTE: This preprint reports new research that has not been certified by peer review and should not be used to guide clinical practice.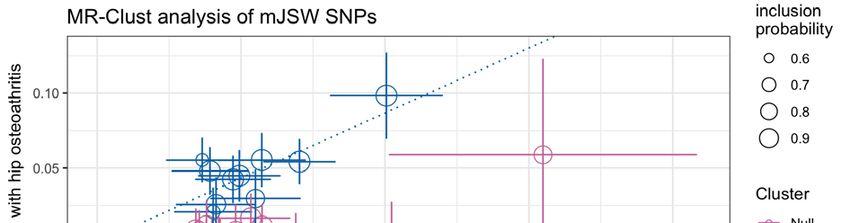
medRxiv preprint doi: https://doi.org/10.1101/2023.03.01.23286618; this version posted March 3, 2023. The copyright holder for this preprint
(which was not certified by peer review) is the author/funder, who has granted medRxiv a license to display the preprint in perpetuity.
It is made available under a CC-BY 4.0 International license .
Joint space and hip osteoarthritis risk
Abstract
Objective
Minimum joint space width (mJSW) from 2-dimensional images provides a proxy for
cartilage thickness. This study aimed to conduct a genome-wide association study (GWAS)
of mJSW to (i) identify new genetic determinants of mJSW and use them to (ii) examine
causal effects of mJSW on hip osteoarthritis (HOA) risk.
Methods
GWAS meta-analysis of hip mJSW derived from plain X-rays (four cohorts) or DXA (one
cohort) was performed, stratified by sex and adjusted for age and ancestry principal
components. Mendelian randomisation (MR) and cluster analyses were used to examine
causal effect of mJSW on HOA.
Results
50,745 individuals were included in the meta-analysis. 42 SNPs, which mapped to 39 loci (35
novel), were identified. Mendelian randomisation (MR) revealed little evidence of a causal
effect of mJSW on HOA (ߚூௐ -0.01 [95% CI -0.19, 0.17]). However, MR-Clust analysis
suggested the null MR estimates reflected the net effect of two distinct causal mechanisms
cancelling each other out, one of which was protective, whereas the other increased HOA
susceptibility. For the latter mechanism, all loci were positively associated with height,
suggesting mechanisms leading to greater height and mJSW increase the risk of HOA in later
life.
Conclusions
GWAS and MR analyses suggested one group of mJSW loci reduces HOA risk via increased
mJSW, suggesting possible utility as targets for chondroprotective therapies. The second
group of mJSW loci increased HOA risk, despite increasing mJSW, but were also positively
2medRxiv preprint doi: https://doi.org/10.1101/2023.03.01.23286618; this version posted March 3, 2023. The copyright holder for this preprint
(which was not certified by peer review) is the author/funder, who has granted medRxiv a license to display the preprint in perpetuity.
It is made available under a CC-BY 4.0 International license .
Joint space and hip osteoarthritis risk
related to height, suggesting they contribute to mJSW and HOA risk via a growth-related
mechanism.
3medRxiv preprint doi: https://doi.org/10.1101/2023.03.01.23286618; this version posted March 3, 2023. The copyright holder for this preprint
(which was not certified by peer review) is the author/funder, who has granted medRxiv a license to display the preprint in perpetuity.
It is made available under a CC-BY 4.0 International license .
Joint space and hip osteoarthritis risk
Introduction
Hip osteoarthritis (HOA) is the commonest cause of pain and loss of function of the hip
worldwide (1). It is a disease of the whole joint with multiple biological pathways implicated
in its pathogenesis, involving cartilage, bone and synovium (2). The prevalence of HOA is
approximately 10% and is predicted to increase (1, 3). Currently there are no known means of
preventing disease and/or symptomatic progression, leaving total hip replacement (THR) as
the treatment of choice for those with end-stage disease. As a result, HOA costs European
countries over €400 billion/year in both direct and indirect healthcare costs illustrating its
substantial health and economic burden (4). A better understanding of the pathogenesis of
HOA may uncover new opportunities for treatment, prevention and early diagnosis.
The heritability of HOA is estimated at 50%, indicating a considerable genetic role in its
pathogenesis (5, 6). In an attempt to identify specific genetic associations, large-scale
genome-wide association studies (GWAS) have been used to identify genes and their
biological pathways which might offer potential treatment targets (7, 8). To date, 45
independent genetic loci have been associated with HOA, but the underlying genetic
pathways causing disease remain largely unclear (9). A more focused GWAS, which
investigates heritable components of HOA (endophenotypes), may shed light on these
mechanisms. One such endophenotype is minimum joint space width (mJSW), which is
defined as the narrowest distance across the joint and acts as proxy for cartilage thickness,
cartilage loss being a key feature of HOA (10). Therefore, genetic factors associated with
mJSW might help to identify pathways involved in cartilage homeostasis. As well as giving
more insight into biology, using a continuous endophenotype such as mJSW increases
statistical power for GWAS compared with a case-control definition of end-stage disease.
4medRxiv preprint doi: https://doi.org/10.1101/2023.03.01.23286618; this version posted March 3, 2023. The copyright holder for this preprint
(which was not certified by peer review) is the author/funder, who has granted medRxiv a license to display the preprint in perpetuity.
It is made available under a CC-BY 4.0 International license .
Joint space and hip osteoarthritis risk
An earlier GWAS found four independent loci associated with mJSW obtained from antero-
posterior (AP) radiographs, many of which showed nominal associations with HOA (11).
Larger sample sizes and updated genotype reference panels provide the opportunity for
comprehensive characterization of mJSW genetic architecture. These data can also provide
genetic instruments for Mendelian randomisation (MR) to test causal associations between
exposures and outcomes (12), such as mJSW and HOA risk. The UK Biobank study (UKB)
has recently conducted over 40,000 high-resolution dual-energy X-ray absorptiometry (DXA)
scans of the hip that have been automatically annotated for mJSW (3). The present study
aimed to conduct a GWAS meta-analysis of hip mJSW combining X-ray and DXA cohorts to
maximize the study power to identify novel loci, and then explore the genetic architecture of
mJSW and its relationship with HOA. Subsequently, we aimed to evaluate causal effects of
mJSW on HOA risk using MR and cluster analyses, to allow for the possibility that distinct
sets of SNPs associated with mJSW map to directionally opposite causal pathways (13).
5medRxiv preprint doi: https://doi.org/10.1101/2023.03.01.23286618; this version posted March 3, 2023. The copyright holder for this preprint
(which was not certified by peer review) is the author/funder, who has granted medRxiv a license to display the preprint in perpetuity.
It is made available under a CC-BY 4.0 International license .
Joint space and hip osteoarthritis risk
Methods
Cohort descriptions
GWAS cohorts comprised the UKB, The Rotterdam Study (RS) I&II, Osteoporotic Fractures
in Men (MrOS) Study and Study of Osteoporotic Fractures (SOF). mJSW was measured
automatically in UKB and manually in RS, MrOS and SOF (see Supplementary Methods).
UKB study (application number 17295) is overseen by the Ethics Advisory Committee and
received approval from the National Information Governance Board for Health and Social
Care and Northwest Multi-Centre Research Ethics Committee (11/NW/0382), all participants
provided informed consent for this study. The Rotterdam Study has been approved by the
Medical Ethics Committee of the Erasmus MC (registration number MEC 02.1015) and by
the Dutch Ministry of Health, Welfare and Sport (Population Screening Act WBO, license
number 1071272-159521-PG). The Rotterdam Study has been entered into the Netherlands
National Trial Register (NTR; www.trialregister.nl) and into the WHO International Clinical
Trials Registry Platform (ICTRP; www.who.int/ictrp/network/primary/en/) under shared
catalogue number NTR6831. All participants provided written informed consent to
participate in the study and to have their information obtained from treating physicians.
Genome-wide association study and meta-analysis
GWAS for mJSW were conducted separately in UKB, RS I&II, SOF and MrOS. In each
cohort, mJSW was stratified by sex and adjusted for age, ancestry principal components, and
in addition study site in the case of MrOS and SOF. Given potential relationships between
mJSW and height, a further GWAS was performed including height adjustment for each
cohort. Residuals resulting from female and male analysis were standardised to mean=0,
SD=1, and then combined into a single outcome for GWAS. UKB used a linear mixed model
for GWAS, implemented in BOLT-LMM (v2.3) (14), SOF, MrOS used an OLS linear
6medRxiv preprint doi: https://doi.org/10.1101/2023.03.01.23286618; this version posted March 3, 2023. The copyright holder for this preprint
(which was not certified by peer review) is the author/funder, who has granted medRxiv a license to display the preprint in perpetuity.
It is made available under a CC-BY 4.0 International license .
Joint space and hip osteoarthritis risk
regression model implemented in PLINK (15) and RS1 and RS2 used RVtests (5). RS I&II
were imputed to Haplotype Reference Consortium (HRC v.1.1), UK Biobank release V3 was
imputed to 3 reference panels (UK10K, 1000 Genomes and HRC) and SOF and MrOS were
imputed to 1000 Genomes. All cohorts used the hg19 build. A subsequent inverse variance
weighted fixed effects meta-analysis was performed with METAL (16) (see Supplementary
Methods).
Linkage disequilibrium score regression and genome-wide conditional and joint complex trait
analysis (GCTA-COJO)
Linkage disequilibrium (LD) score regression (LDSC) v1.0.1 was used to estimate SNP
heritability, and the genetic correlation between mJSW and several other traits, including
HOA, height, and body mass index (BMI) (see Supplementary Methods) (9, 17). In addition,
the genetic correlation between mJSWDXA and mJSWX-ray was examined. A European based
LD reference panel was used, and analysis was limited to HapMap3 SNPs (therefore
excluding major histocompatibility regions) (17). Conditional and joint analysis (GCTA-
COJO) was performed in conjunction with a UKB reference panel to identify statistically
independent mJSW associated signals (18).
Mendelian randomisation and MR Cluster Analysis
The conditionally independent mJSW lead SNPs were used as genetic instruments for MR
analyses to investigate the causal effect of mJSW on HOA, using the TwoSampleMR
package v0.5.6 in R (19). The HOA GWAS was a meta-analysis combining the latest
genetics of osteoarthritis consortium HOA GWAS without UKB (9) and an updated UKB
HOA GWAS removing those individuals with mJSW measures to avoid sample overlap (see
Supplementary Methods). Steiger filtering was applied to demonstrate the exposure
7medRxiv preprint doi: https://doi.org/10.1101/2023.03.01.23286618; this version posted March 3, 2023. The copyright holder for this preprint
(which was not certified by peer review) is the author/funder, who has granted medRxiv a license to display the preprint in perpetuity.
It is made available under a CC-BY 4.0 International license .
Joint space and hip osteoarthritis risk
instruments were upstream of the outcome. Inverse variance weighted (IVW) analysis was
used as the primary method, with MR Egger, weighted median, simple mode and weighted
mode approaches as sensitivity analyses (12). MR-Clust was applied in relation to HOA to
group variants into distinct groups with similar causal estimates (13). This method, which
may help to identify different causal mechanisms underlying HOA, is used when
heterogeneity in causal effect estimates for a complex trait is observed, and different
biological mechanisms are suspected. Two sample MR was then used to quantify cluster
specific effects on HOA and height.
Gene prioritisation and Downstream analyses
Initially, the independent mJSW lead SNPs were looked-up in a previous GWAS of height
and BMI in UKB available via the IEU open GWAS project (20) and HOA. SNPs were
prioritised based on MR-Clust results and a look-up in previous height and HOA summary
statistics. In these fine mapping analyses that used the coloc R package, we compared 100kb
regions on either side of the lead mJSW SNP in the mJSW and HOA GWAS to look for
shared signals (21). Then generalised gene-set analysis of GWAS data (MAGMA v1.08) (22)
was implemented in Functional Mapping and annotation of GWAS (FUMA) tool (23).
Briefly, SNPs were mapped to the protein coding genes using default settings (SNP-wise
(mean) model for gene test) and gene-set analysis was performed using 10894 gene sets
obtained from MsigDB v5.2. In addition, the list of mapped genes was annotated for
overlapping gene ontology biological processes genes using PANTHER (24). Subsequently,
the expression quantitative trait loci (eQTL) database GTEx was searched for each leading
SNP to identify cis-acting effects, with cultured fibroblasts considered the most relevant
tissue. LocusFocus was used to conduct Bayesian colocalisation with all expressed genes
over 100kb either side of the sentinel SNP (21, 25, 26). To further identify which cis-genes
8medRxiv preprint doi: https://doi.org/10.1101/2023.03.01.23286618; this version posted March 3, 2023. The copyright holder for this preprint
(which was not certified by peer review) is the author/funder, who has granted medRxiv a license to display the preprint in perpetuity.
It is made available under a CC-BY 4.0 International license .
Joint space and hip osteoarthritis risk
share the same causal variants, we used colocalisation to look at eQTL data assessed on
highly degraded (diseased) and less degraded (healthy) cartilage, and synovial tissue
retrieved following knee and hip joint replacements (27). We considered a SNP to colocalise
with an eQTL if the posterior probability (PP) was >80%. In addition, regulatory elements of
non-coding human genome were identified using RegulomeDB (28).
9medRxiv preprint doi: https://doi.org/10.1101/2023.03.01.23286618; this version posted March 3, 2023. The copyright holder for this preprint
(which was not certified by peer review) is the author/funder, who has granted medRxiv a license to display the preprint in perpetuity.
It is made available under a CC-BY 4.0 International license .
Joint space and hip osteoarthritis risk
Results
Genome wide association analysis
We conducted a GWAS meta-analysis of hip mJSW in 50,745 participants from 5 cohorts, of
whom 24,429 were males and 26,316 females with a mean age of 65.1 years (range 45-97
years), height of 169.7 cm (135-204 cm), weight of 75.5 kg (34-171 kg) and mJSW of 3.05
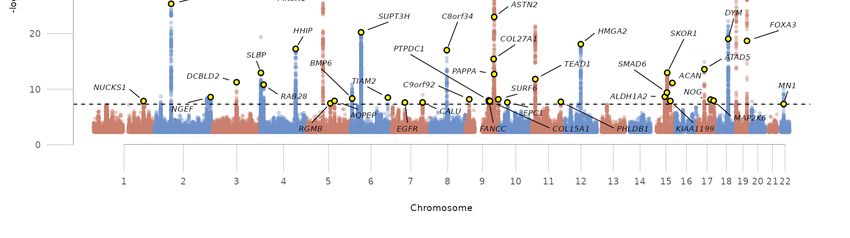
mm (0.0-7.4 mm), (Supplementary Table 1). Following conditional analyses, 42 independent
SNPs were identified at genome-wide significance (P ≤5·0×10−8), together accounting for
4.6% of mJSW variance (Table 1, Figure 1) (11). The identified SNPs mapped to 39 loci, of
which 35 were novel (defined as >1MB from previously reported variants (11)). mJSW SNP
heritability (h2) was 0.20 (95% CI 0.16, 0.25), and there was moderate genomic inflation
(λ=1.11; UKB λ= 1.10, MrOS 1.02, SOF 1.00, RS1 1.01, RS2 1.00). However, the intercept
from LDSC, and the ratio attenuation statistic (Intercept=1.01 [Standard error=0.01] /
RPS=0.28 [0.15]) suggested that most of the inflation reflected polygenicity rather than
confounding due to population stratification or relatedness (Supplementary Figure 2).
Equivalent results were obtained in a further GWAS following height adjustment
(Supplementary Figure 3).
Genetic correlation
LDSC provided estimates of genetic correlation. A strong genetic correlation was seen
between mJSWDXA (N=38,175) versus mJSWX-ray (N=12,570) (rg 0.87 [95% CI 0.59, 1.14]).
While the SNP heritability z-score for mJSWDXA was 10.8, the SNP heritability z-score for
mJSWX-ray was 3.3, which is below the threshold of 4 that is suggested for reliable LDSC
estimates (17). There was a moderate correlation between mJSWcombined (mJSWDXA and
mJSWX-ray combined) versus height (rg 0.28 [0.22, 0.33]) and between mJSWDXA versus
height (rg 0.34 [0.28, 0.39]). There was minimal evidence of a genetic correlation of
10medRxiv preprint doi: https://doi.org/10.1101/2023.03.01.23286618; this version posted March 3, 2023. The copyright holder for this preprint
(which was not certified by peer review) is the author/funder, who has granted medRxiv a license to display the preprint in perpetuity.
It is made available under a CC-BY 4.0 International license .
Joint space and hip osteoarthritis risk
mJSWcombined versus BMI (rg 0.06 [0.01, 0.12]) and versus HOA (rg 0.10 [-0.01, 0.21]).
However, when examined separately, there was some evidence of correlation between
mJSWDXA and BMI (rg 0.08 [0.03, 0.14]) and HOA (rg 0.14 [0.04, 0.25]) (Supplementary
Table 3).
Mendelian Randomisation and MR-Cluster
To examine the causal relationship between mJSW and osteoarthritis, we performed a two
sample MR. 41 of the 42 independent mJSW lead SNPs were used as genetic instruments
(mean F-statistic = 61). Rs34687269 was not included in the MR analyses because its alleles
are palindromic. Despite good instrument strength, two sample MR showed no causal effect
of mJSW on HOA (IVW: β -0.01 [95% CI -0.19, 0.17], MR Egger: β -0.37 [-0.91, 0.12] and
Weighted Median: β -0.02 [-0.13, 0.09]) (Supplementary Figure 4 A). Subsequent cluster
analysis of the mJSW genetic instruments displayed three distinct clusters, with two sample
MR used to quantify each cluster’s effects: (i) Cluster one SNPs (n=11) were associated with
a higher mJSW and a decreased risk of HOA (IVW: β -0.60 [95% CI -0.72, -0.48]); (ii)
Cluster two SNPs (n=10) were associated with both greater mJSW and an increased risk of
HOA (IVW: β 0.88 [0.72, 1.04]); and (iii) Cluster three SNPs (n=20) had no clear association
with HOA (IVW: β 0.03 [-0.05, 0.11]) (Table 2 and Figure 2). Heterogeneity of SNP effects
between mJSW and HOA identified by cluster analysis illustrated why no net causal effect
between these traits was detected. To further understand these SNP clusters, SNP
associations with other traits were investigated.
Trait look-ups and SNP prioritisation
The 42 independent mJSW-associated SNPs were examined in previous GWAS of HOA,
height, and BMI (Table 1). SNPs in Cluster one (n=11), which were associated with a
11medRxiv preprint doi: https://doi.org/10.1101/2023.03.01.23286618; this version posted March 3, 2023. The copyright holder for this preprint
(which was not certified by peer review) is the author/funder, who has granted medRxiv a license to display the preprint in perpetuity.
It is made available under a CC-BY 4.0 International license .
Joint space and hip osteoarthritis risk
decreased risk of HOA with increasing mJSW, showed mixed associations with height; MR
showed limited evidence of a small causal effect on height overall (IVW: β 0.06 [95% CI -
0.02, 0.14]) (Table 2). SNPs in Cluster two (n=10), which were associated with a higher
HOA risk with increasing mJSW, all (except one for which a proxy SNP was not found)
showed strong and consistent positive associations with height and some evidence of
association with BMI, and MR showed a strong causal effect of these SNPs on height (IVW:
β 0.25 [95% CI 0.14, 0.36]) (Table 2), Supplementary Figure 4E-F). Colocalisation analysis
revealed that two SNPs in Cluster two (near BMP6 and MAP2K6) shared common signals
with height (PP=99% and 97%, respectively) (Supplementary Table 4).
The palindromic SNP (rs34687269) showed strong positive associations with mJSW, HOA
and height, in keeping with rs76248879, a Cluster two SNP that was also situated close to the
ASTN2 locus (Table 1). There is a clear null cluster outlier (rs117564279) in Figure 2, which
shows a strong mJSW effect (β 0.15, P 1.35x10⁻⁸) and weaker HOA (β 0.06, P 0.07) effect.
Interestingly, it has no association with height (β 0.002, P 0.67). Rs117564279 is a rare allele
with a MAF 0.02 (Table 1).
Identification of candidate osteoarthritis pathogenesis genes
SNPs in Cluster one, which were thought to increase HOA risk through reduced mJSW and
hence are potential targets for chondro-protective therapies, were assessed further.
Colocalisation was used to compare GWAS signals between mJSW and HOA. Loci closest to
TGFA, COL27A1, C8orf34 and SLBP showed strong evidence of a shared signal (PP 1.00,
1.00, 0.99 & 0.97, respectively). No other loci showed such evidence (Table 3).
12medRxiv preprint doi: https://doi.org/10.1101/2023.03.01.23286618; this version posted March 3, 2023. The copyright holder for this preprint
(which was not certified by peer review) is the author/funder, who has granted medRxiv a license to display the preprint in perpetuity.
It is made available under a CC-BY 4.0 International license .
Joint space and hip osteoarthritis risk
Subsequently, attempts were made to identify the underlying causal gene responsible for the
SNP association. MAGMA assigned TGFA, SUPT3H-RUNX2, C8orf34, EPC1, COL27A1,
SLBP-TMEM129-TACC3, ALDH1A2 and DOT1L as candidate genes (Table 3). TGFA and
SUPT3H mJSW association signals colocalised with GTEx expression in amygdala and basal
ganglia respectively, but not in fibroblasts (Supplementary Table 5). The outlier SNP
(rs117564279) with the largest effect size near CEMIP was also examined in GTEx and
colocalised with eQTL SNPs in skeletal muscle (PP 0.98). RegulomeDB suggested the SNPs
nearest to TGFA, AP3D1, EGFR and TIAM2 were non-coding regulatory regions with
probability scores >0.5 (Supplementary Table 6). Colocalisation between mJSW SNPs and
human cartilage eQTL data provided no further gene-SNP evidence for our prioritised SNPs
(Supplementary Table 7). However, it did show evidence of colocalisation for two null
cluster SNPs; rs62479589 with OPN1SW in both highly and less degraded cartilage (PP 0.97
& 0.90 respectively) and rs823097 with RAB7L1 in highly degraded cartilage (PP 0.96)
(Supplementary Table 7).
Gene ontology biological process annotations
PANTHER and FUMA GeNE2FUNC analyses showed that three Cluster two SNPs (which
mapped to ACAN, NOG, BMP6) overlapped with skeletal system morphogenesis and
development (Supplementary Tables 8 and 9).
13medRxiv preprint doi: https://doi.org/10.1101/2023.03.01.23286618; this version posted March 3, 2023. The copyright holder for this preprint
(which was not certified by peer review) is the author/funder, who has granted medRxiv a license to display the preprint in perpetuity.
It is made available under a CC-BY 4.0 International license .
Joint space and hip osteoarthritis risk
Discussion
In the largest GWAS of hip mJSW to date, we identified 42 conditionally independent SNPs,
mapping to 39 loci of which 35 were novel. MR analysis revealed little evidence for a causal
effect of mJSW on HOA risk, however, cluster analysis identified three groups of SNPs with
distinct effects. One cluster comprised 11 SNPs which increase mJSW leading to a decrease
in HOA risk. In contrast, a second cluster comprised 10 SNPs which increased mJSW but led
to an increase in HOA risk. The latter set of SNPs was also related to height, a known risk
factor for HOA. A null cluster comprised 20 SNPs with no association with HOA risk. Taken
together, these findings suggest that SNPs associated with mJSW may exert distinct effects
on HOA risk according to whether this is instrumented by SNPs which are also related to
height.
Of the 11 loci identified by MR-Clust, which were protective for HOA with increasing
mJSW (Cluster one), TGFA, C8orf34, COL27A1 and SLBP-TMEM129-TACC3 colocalised
with the same causal signal for HOA in a large-scale HOA GWAS. The present findings
suggest that these previously identified loci cause HOA through reduced cartilage thickness,
suggesting potential utility as therapeutic targets for chondro-protective therapy. TGFA was
implicated in mJSW by a previous much smaller GWAS and is known to be involved in
endochondral bone formation (11, 33-35). Likewise, COL27A1 is established in cartilage
regulation and formation, and mutations are associated with osteochondrodysplasias in
humans such as Steel syndrome which feature early hip dislocations and OA (36, 37). There
is little known about C8orf34 regulation of joint tissues such as cartilage but it has been
implicated in vertebral disc disease (32). In addition, MAGMA suggested TMEM129, SLBP
and TACC3 might be the genes responsible for the association with mJSW at rs2236996locus
but this was not supported by eQTL findings. TMEM129 mutations can lead to facial
14medRxiv preprint doi: https://doi.org/10.1101/2023.03.01.23286618; this version posted March 3, 2023. The copyright holder for this preprint
(which was not certified by peer review) is the author/funder, who has granted medRxiv a license to display the preprint in perpetuity.
It is made available under a CC-BY 4.0 International license .
Joint space and hip osteoarthritis risk
dysmorphias such as Wolf-Hirschhorn syndrome and has been suggested to be a genetic risk
factor for OA through disrupted protein degradation in the endoplasmic reticulum (29-31).
The other loci identified in Cluster one, SUPT3H-RUNX2, AP3D1, EPC1, MN1, ALDH1A2,
TIAM2 and EGFR did not colocalise with corresponding HOA GWAS signals but
nonetheless showed at least a nominal HOA association. The SUPT3H-RUNX2 locus was
identified in the previous mJSW GWAS and has been implicated in chondrocyte and
osteoblast differentiation respectively (11, 35). MAGMA suggested EPC1 as a candidate for
rs76164690, however this signal did not colocalise with eQTL expression in fibroblasts.
Pigment epithelium derived factor (PEDF) is the product of the EPC1 gene and is known to
be anti-angiogenic. Previously PEDF has been shown to be preferentially expressed in OA
cartilage contributing to OA pathogenesis by upregulating matrix degrading factors (38, 39).
Whilst there was evidence of an association between rs34656141 with eQTL expression for
AP3D1, DOT1L and AMH in fibroblasts these signals did not colocalise. DOT1L was
previously implicated in mJSW in a smaller GWAS and is known to regulate cartilage
homeostasis and protect against OA (11, 40). Anti-Mullerian Hormone, the product of AMH,
is associated with knee OA in women (41). ALDH1A2, TIAM2 and EGFR showed less
evidence of an association with HOA, that said, ALDH1A2 and EGFR have previously been
identified as potential treatment targets for OA (42, 43). Less is known about AP3D1, TIAM2
and MN1 in the context of cartilage and HOA.
One locus showed a SNP effect of increased mJSW and HOA risk that was not associated
with height; rs117564279 (CEMIP) is a rare variant with a MAF 0.02 and large effect size for
both mJSW and HOA (β 0.15 & β 0.06 respectively). CEMIP is the closest gene and showed
colocalisation between eQTL expression (skeletal muscle) and the mJSW GWAS signal.
15medRxiv preprint doi: https://doi.org/10.1101/2023.03.01.23286618; this version posted March 3, 2023. The copyright holder for this preprint
(which was not certified by peer review) is the author/funder, who has granted medRxiv a license to display the preprint in perpetuity.
It is made available under a CC-BY 4.0 International license .
Joint space and hip osteoarthritis risk
CEMIP has recently been shown to be expressed in cartilage from osteoarthritic joints, and to
induce a fibrosis type response within chondrocytes (44). Therefore, CEMIP warrants further
investigation to understand if altered expression leads to thicker more fibrous cartilage which
in turn could lead to a wider joint space and a higher risk of HOA.
The opposing effects of SNPs in clusters one and two, as shown by the MR analyses of each
cluster, presumably lead to a net null effect of mJSW on HOA. This may help to explain why
mJSW, when examined observationally, displays little or no associations with HOA and
symptoms, yet a decreased mJSW is often seen clinically in severely symptomatic individuals
(45). Our observation that Cluster two SNPs are related to both height and HOA is consistent
with previous findings that height GWAS signals overlap with OA (46, 47). This also
corresponds with findings from observational studies that taller individuals are at an
increased risk of HOA (48, 49). Whereas Cluster two SNPs are related to height, mJSW
GWAS results showed little attenuation following height adjustment. Therefore, Cluster two
SNPs appear to increase HOA risk through co-association with greater height, although
height itself does not appear to be on the causal pathway for mJSW, suggesting the role of an
intermediary growth-related mechanism (Figure 3). Consistent with this suggestion, gene
ontology annotation suggested that three Cluster two SNPs (ACAN, NOG, BMP6) have a role
in skeletal development. Extra-skeletal endocrine actions that influence growth might also
play a role, given two loci, PAPPA and PIK3R1, are involved in the action of IGF-1 and
insulin (50, 51).
The strengths of this study include its large sample size which has afforded the power to
identify 35 novel loci. In addition, by combining a GWAS meta-analysis with other genetic
analyses such as LDSC, MR and MR-Clust we have been able to tease out different causal
16medRxiv preprint doi: https://doi.org/10.1101/2023.03.01.23286618; this version posted March 3, 2023. The copyright holder for this preprint
(which was not certified by peer review) is the author/funder, who has granted medRxiv a license to display the preprint in perpetuity.
It is made available under a CC-BY 4.0 International license .
Joint space and hip osteoarthritis risk
pathways related to mJSW. In terms of limitations, as this is a GWAS of individuals with
European ancestry this limits generalisability to other ancestries. In addition, we combined
DXA and X-ray based cohorts, despite certain differences in mJSW measurements using
these methods. For example, unlike DXA scans where only the superior joint space can be
evaluated, mJSW can also be measured on X-rays at other sites. That said, X-ray based
mJSW measurements were based solely on the superior joint space in SOF and MrOS. In
contrast, in RS, mJSW measurements were also obtained laterally, axially and medially, with
the smallest value used. That said, genetic correlation between mJSW obtained using these
two methods was relatively high, albeit the mJSWX-ray GWAS was underpowered for LDSC
analysis. Furthermore, there was limited evidence of colocalisation between GWAS and
eQTL data which hinders the identification of effector genes. However, it is increasingly
recognised that many true GWAS signals fail to colocalise with eQTL signals (52, 53).
In conclusion, we present findings from a GWAS meta-analysis of hip mJSW which
identified 35 novel loci and replicated 4 known loci. Subsequently, we showed that mJSW
SNPs act on HOA in two distinct clusters; those that decrease HOA risk with increasing
mJSW and those that increase HOA risk via increasing mJSW. We postulate the first group
of SNPs may act via cartilage mediated pathways, suggesting possible utility as targets for
chondroprotective therapies. In contrast, the latter group of SNPs are associated with greater
height and likely act through growth-related mechanisms which require further clarification.
17medRxiv preprint doi: https://doi.org/10.1101/2023.03.01.23286618; this version posted March 3, 2023. The copyright holder for this preprint
(which was not certified by peer review) is the author/funder, who has granted medRxiv a license to display the preprint in perpetuity.
It is made available under a CC-BY 4.0 International license .
Joint space and hip osteoarthritis risk
Acknowledgements
This work has been conducted using the UK Biobank resource (application number 17295).
The authors would like to thank the study participants, the staff from the Rotterdam Study
and the participating general practitioners and pharmacists. The generation and management
of GWAS genotype data for the Rotterdam Study (RSI & RSII) was executed by the Human
Genotyping Facility of the Genetic Laboratory of the Department of Internal Medicine,
Erasmus MC, Rotterdam, The Netherlands. The authors would like to thank Pascal Arp, Mila
Jhamai, Marijn Verkerk, Lizbeth Herrera and Marjolein Peters, MSc, and Carolina Medina-
Gomez, MSc, for their help in creating the GWAS database, and Linda Broer PhD, for the
creation of the imputed data.
Funding and grant award information:
MF, RE, FS are supported, and this work is funded by a Wellcome Trust collaborative award
(reference number 209233). BGF is supported by a Medical Research Council (MRC)
clinical research training fellowship (MR/S021280/1). ML is supported by a University of
Queensland Research Training Scholarship from The University of Queensland (UQ). ML
thanks the Commonwealth Scientific and Industrial Research Organisation for the support
through a Postgraduate Top-Up Scholarship. CL was funded by the MRC (MR/S00405X/1)
as well as a Sir Henry Dale Fellowship jointly funded by the Wellcome Trust and the Royal
Society (223267/Z/21/Z). This research was funded in whole, or in part, by the Wellcome
Trust [Grant numbers 080280/Z/06/Z, 20378/Z/16/Z, 223267/Z/21/Z]. For the purpose of
open access, the authors have applied a CC BY public copyright licence to any Author
Accepted Manuscript version arising from this submission. NCH acknowledges support from
the MRC (MC_PC_21003; MC_PC_21001) and NIHR Southampton Biomedical Research
Centre, University of Southampton and University Hospital Southampton. BGF, MF, AEH,
GDS, JHT work in the MRC Integrative Epidemiology Unit at the University of Bristol,
18medRxiv preprint doi: https://doi.org/10.1101/2023.03.01.23286618; this version posted March 3, 2023. The copyright holder for this preprint
(which was not certified by peer review) is the author/funder, who has granted medRxiv a license to display the preprint in perpetuity.
It is made available under a CC-BY 4.0 International license .
Joint space and hip osteoarthritis risk
which is supported by the MRC (MC_UU_00011/1). JPK is funded by a National Health and
Medical Research Council (Australia) Investigator grant (GNT1177938). DSE acknowledges
funding from NIH/NIA U24AG051129. The Osteoporotic Fractures in Men (MrOS) Study is
supported by National Institute of Health funding from the following institutes: the National
Institute on Aging (NIA), the National Institute of Arthritis and Musculoskeletal and Skin
Diseases (NIAMS), the National Center for Advancing Translational Sciences (NCATS), and
NIH Roadmap for Medical Research under the following grant numbers: R01 AR052000,
K24 AR048841, U01 AG027810, U01 AG042124, U01 AG042139, U01 AG042140, U01
AG042143, U01 AG042145, U01 AG042168, U01 AR066160, and UL1 TR000128. The
Study of Osteoporotic Fractures (SOF) is supported by National Institutes of Health funding.
The National Institute on Aging (NIA) provides support under the following grant numbers:
R01 AG005407, R01 AR35582, R01 AR35583, R01 AR35584, R01 AG005394, R01
AG027574, and R01 AG027576.
Competing interests:
TC & CL have a patent Image processing apparatus and method for fitting a deformable
shape model to an image using random forest regression voting. This is licensed with
royalties to Optasia Medical. NH reports consultancy fees and honoraria from UCB, Amgen,
Kyowa Kirin, Thornton Ross, Consilient.
Data availability statement:
The UK Biobank mJSW data from this study will be available in a forthcoming data release.
Users must be registered with UK Biobank to access their resources
(https://bbams.ndph.ox.ac.uk/ams/).
19medRxiv preprint doi: https://doi.org/10.1101/2023.03.01.23286618; this version posted March 3, 2023. The copyright holder for this preprint
(which was not certified by peer review) is the author/funder, who has granted medRxiv a license to display the preprint in perpetuity.
It is made available under a CC-BY 4.0 International license .
Joint space and hip osteoarthritis risk
Author contributions
Study design: MF, BGF; Data Analysis: MF, BF, RE, KAF, ML, AH, FRS.; Interpretation of
results: MF, BGF, JPK, JT; Replication data: CGB, DSE.; Manuscript drafting: MF, BGF,
JPK, JT.; Manuscript reviewing and editing: all authors.
20medRxiv preprint doi: https://doi.org/10.1101/2023.03.01.23286618; this version posted March 3, 2023. The copyright holder for this preprint
(which was not certified by peer review) is the author/funder, who has granted medRxiv a license to display the preprint in perpetuity.
It is made available under a CC-BY 4.0 International license .
Joint space and hip osteoarthritis risk
References
1. Aresti N, Kassam J, Nicholas N, Achan P. Hip osteoarthritis. BMJ. 2016;354:i3405.
2. Hunter DJ, Bierma-Zeinstra S. Osteoarthritis. Lancet. 2019;393(10182):1745-59.
3. Faber BG, Ebsim R, Saunders FR, Frysz M, Lindner C, Gregory JS, et al. A novel
semi-automated classifier of hip osteoarthritis on DXA images shows expected relationships
with clinical outcomes in UK Biobank. Rheumatology (Oxford). 2021.
4. Salmon JH, Rat AC, Sellam J, Michel M, Eschard JP, Guillemin F, et al. Economic
impact of lower-limb osteoarthritis worldwide: a systematic review of cost-of-illness studies.
Osteoarthritis Cartilage. 2016;24(9):1500-8.
5. MacGregor AJ, Antoniades L, Matson M, Andrew T, Spector TD. The genetic
contribution to radiographic hip osteoarthritis in women: results of a classic twin study.
Arthritis Rheum. 2000;43(11):2410-6.
6. Spector TD, MacGregor AJ. Risk factors for osteoarthritis: genetics. Osteoarthritis
Cartilage. 2004;12 Suppl A:S39-44.
7. Tachmazidou I, Hatzikotoulas K, Southam L, Esparza-Gordillo J, Haberland V,
Zheng J, et al. Identification of new therapeutic targets for osteoarthritis through genome-
wide analyses of UK Biobank data. Nat Genet. 2019;51(2):230-6.
8. Zengini E, Hatzikotoulas K, Tachmazidou I, Steinberg J, Hartwig FP, Southam L, et
al. Genome-wide analyses using UK Biobank data provide insights into the genetic
architecture of osteoarthritis. Nat Genet. 2018;50(4):549-58.
9. Boer CG, Hatzikotoulas K, Southam L, Stefansdottir L, Zhang Y, Coutinho de
Almeida R, et al. Deciphering osteoarthritis genetics across 826,690 individuals from 9
populations. Cell. 2021;184(18):4784-818 e17.
10. Kellgren JH, Lawrence JS. Radiological assessment of osteo-arthrosis. Ann Rheum
Dis. 1957;16(4):494-502.
11. Castano-Betancourt MC, Evans DS, Ramos YF, Boer CG, Metrustry S, Liu Y, et al.
Novel Genetic Variants for Cartilage Thickness and Hip Osteoarthritis. PLoS Genet.
2016;12(10):e1006260.
12. Sanderson E, Glymour MM, Holmes MV, Kang H, Morrison J, Munafò MR, et al.
Mendelian randomization. Nature Reviews Methods Primers. 2022;2(1):6.
13. Foley CN, Mason AM, Kirk PDW, Burgess S. MR-Clust: clustering of genetic
variants in Mendelian randomization with similar causal estimates. Bioinformatics.
2021;37(4):531-41.
14. Loh PR, Tucker G, Bulik-Sullivan BK, Vilhjalmsson BJ, Finucane HK, Salem RM, et
al. Efficient Bayesian mixed-model analysis increases association power in large cohorts. Nat
Genet. 2015;47(3):284-90.
15. Purcell S, Neale B, Todd-Brown K, Thomas L, Ferreira MA, Bender D, et al. PLINK:
a tool set for whole-genome association and population-based linkage analyses. Am J Hum
Genet. 2007;81(3):559-75.
16. Willer CJ, Li Y, Abecasis GR. METAL: fast and efficient meta-analysis of
genomewide association scans. Bioinformatics. 2010;26(17):2190-1.
17. Bulik-Sullivan B, Finucane HK, Anttila V, Gusev A, Day FR, Loh PR, et al. An atlas
of genetic correlations across human diseases and traits. Nat Genet. 2015;47(11):1236-41.
18. Yang J, Ferreira T, Morris AP, Medland SE, Genetic Investigation of ATC,
Replication DIG, et al. Conditional and joint multiple-SNP analysis of GWAS summary
statistics identifies additional variants influencing complex traits. Nat Genet. 2012;44(4):369-
75, S1-3.
21medRxiv preprint doi: https://doi.org/10.1101/2023.03.01.23286618; this version posted March 3, 2023. The copyright holder for this preprint
(which was not certified by peer review) is the author/funder, who has granted medRxiv a license to display the preprint in perpetuity.
It is made available under a CC-BY 4.0 International license .
Joint space and hip osteoarthritis risk
19. Hemani G, Tilling K, Davey Smith G. Orienting the causal relationship between
imprecisely measured traits using GWAS summary data. PLoS Genet.
2017;13(11):e1007081.
20. Lyon MS, Andrews SJ, Elsworth B, Gaunt TR, Hemani G, Marcora E. The variant
call format provides efficient and robust storage of GWAS summary statistics. Genome
Biology. 2021;22(1):32.
21. Giambartolomei C, Vukcevic D, Schadt EE, Franke L, Hingorani AD, Wallace C, et
al. Bayesian test for colocalisation between pairs of genetic association studies using
summary statistics. PLoS Genet. 2014;10(5):e1004383.
22. de Leeuw CA, Mooij JM, Heskes T, Posthuma D. MAGMA: generalized gene-set
analysis of GWAS data. PLoS Comput Biol. 2015;11(4):e1004219.
23. Watanabe K, Taskesen E, van Bochoven A, Posthuma D. Functional mapping and
annotation of genetic associations with FUMA. Nat Commun. 2017;8(1):1826.
24. Thomas PD, Ebert D, Muruganujan A, Mushayahama T, Albou LP, Mi H.
PANTHER: Making genome-scale phylogenetics accessible to all. Protein Sci. 2022;31(1):8-
22.
25. Consortium GT, Laboratory DA, Coordinating Center -Analysis Working G,
Statistical Methods groups-Analysis Working G, Enhancing Gg, Fund NIHC, et al. Genetic
effects on gene expression across human tissues. Nature. 2017;550(7675):204-13.
26. Panjwani N, Wang F, Mastromatteo S, Bao A, Wang C, He G, et al. LocusFocus:
Web-based colocalization for the annotation and functional follow-up of GWAS. PLoS
Comput Biol. 2020;16(10):e1008336.
27. Steinberg J, Southam L, Roumeliotis TI, Clark MJ, Jayasuriya RL, Swift D, et al. A
molecular quantitative trait locus map for osteoarthritis. Nat Commun. 2021;12(1):1309.
28. Boyle AP, Hong EL, Hariharan M, Cheng Y, Schaub MA, Kasowski M, et al.
Annotation of functional variation in personal genomes using RegulomeDB. Genome Res.
2012;22(9):1790-7.
29. Rice SJ, Cheung K, Reynard LN, Loughlin J. Discovery and analysis of methylation
quantitative trait loci (mQTLs) mapping to novel osteoarthritis genetic risk signals.
Osteoarthritis Cartilage. 2019;27(10):1545-56.
30. Engbers H, van der Smagt JJ, van 't Slot R, Vermeesch JR, Hochstenbach R, Poot M.
Wolf-Hirschhorn syndrome facial dysmorphic features in a patient with a terminal 4p16.3
deletion telomeric to the WHSCR and WHSCR 2 regions. Eur J Hum Genet. 2009;17(1):129-
32.
31. Brumwell A, Aubourg G, Hussain J, Parker E, Deehan DJ, Rice SJ, et al.
Identification of TMEM129, encoding a ubiquitin-protein ligase, as an effector gene of
osteoarthritis genetic risk. Arthritis Research & Therapy. 2022;24(1):189.
32. Bjornsdottir G, Stefansdottir L, Thorleifsson G, Sulem P, Norland K, Ferkingstad E,
et al. Rare SLC13A1 variants associate with intervertebral disc disorder highlighting role of
sulfate in disc pathology. Nat Commun. 2022;13(1):634.
33. Usmani SE, Ulici V, Pest MA, Hill TL, Welch ID, Beier F. Context-specific
protection of TGFalpha null mice from osteoarthritis. Sci Rep. 2016;6:30434.
34. Usmani SE, Pest MA, Kim G, Ohora SN, Qin L, Beier F. Transforming growth factor
alpha controls the transition from hypertrophic cartilage to bone during endochondral bone
growth. Bone. 2012;51(1):131-41.
35. van Meurs JB, Boer CG, Lopez-Delgado L, Riancho JA. Role of Epigenomics in
Bone and Cartilage Disease. J Bone Miner Res. 2019;34(2):215-30.
36. Swingler TE, Wheeler G, Carmont V, Elliott HR, Barter MJ, Abu-Elmagd M, et al.
The expression and function of microRNAs in chondrogenesis and osteoarthritis. Arthritis
Rheum. 2012;64(6):1909-19.
22medRxiv preprint doi: https://doi.org/10.1101/2023.03.01.23286618; this version posted March 3, 2023. The copyright holder for this preprint
(which was not certified by peer review) is the author/funder, who has granted medRxiv a license to display the preprint in perpetuity.
It is made available under a CC-BY 4.0 International license .
Joint space and hip osteoarthritis risk
37. Gonzaga-Jauregui C, Yesil G, Nistala H, Gezdirici A, Bayram Y, Nannuru KC, et al.
Functional biology of the Steel syndrome founder allele and evidence for clan genomics
derivation of COL27A1 pathogenic alleles worldwide. Eur J Hum Genet. 2020;28(9):1243-
64.
38. Pfander D, Grimmer C, Aigner T, Swoboda B, Schmidt R, Cramer T. Pigment
epithelium derived factor--the product of the EPC-1 gene--is expressed by articular
chondrocytes and up regulated in osteoarthritis. Ann Rheum Dis. 2006;65(7):965-7.
39. Klinger P, Lukassen S, Ferrazzi F, Ekici AB, Hotfiel T, Swoboda B, et al. PEDF Is
Associated with the Termination of Chondrocyte Phenotype and Catabolism of Cartilage
Tissue. Biomed Res Int. 2017;2017:7183516.
40. Monteagudo S, Cornelis FMF, Aznar-Lopez C, Yibmantasiri P, Guns LA, Carmeliet
P, et al. DOT1L safeguards cartilage homeostasis and protects against osteoarthritis. Nat
Commun. 2017;8:15889.
41. Sasaki E, Chiba D, Ota S, Kimura Y, Sasaki S, Yamamoto Y, et al. Reduced serum
levels of anti-Mullerian hormone is a putative biomarker of early knee osteoarthritis in
middle-aged females at menopausal transition. Sci Rep. 2021;11(1):4931.
42. Shepherd C, Zhu D, Skelton AJ, Combe J, Threadgold H, Zhu L, et al. Functional
Characterization of the Osteoarthritis Genetic Risk Residing at ALDH1A2 Identifies
rs12915901 as a Key Target Variant. Arthritis Rheumatol. 2018;70(10):1577-87.
43. Wei Y, Luo L, Gui T, Yu F, Yan L, Yao L, et al. Targeting cartilage EGFR pathway
for osteoarthritis treatment. Sci Transl Med. 2021;13(576).
44. Deroyer C, Charlier E, Neuville S, Malaise O, Gillet P, Kurth W, et al. CEMIP
(KIAA1199) induces a fibrosis-like process in osteoarthritic chondrocytes. Cell Death Dis.
2019;10(2):103.
45. Chu Miow Lin D, Reichmann WM, Gossec L, Losina E, Conaghan PG, Maillefert JF.
Validity and responsiveness of radiographic joint space width metric measurement in hip
osteoarthritis: a systematic review. Osteoarthritis Cartilage. 2011;19(5):543-9.
46. Elliott KS, Chapman K, Day-Williams A, Panoutsopoulou K, Southam L, Lindgren
CM, et al. Evaluation of the genetic overlap between osteoarthritis with body mass index and
height using genome-wide association scan data. Annals of the Rheumatic Diseases.
2013;72(6):935.
47. Lettre G. The osteoarthritis and height GDF5 locus yields its secrets. Nature Genetics.
2017;49(8):1165-6.
48. Croft P, Coggon D, Cruddas M, Cooper C. Osteoarthritis of the hip: an occupational
disease in farmers. BMJ. 1992;304(6837):1269-72.
49. Liu B, Balkwill A, Banks E, Cooper C, Green J, Beral V. Relationship of height,
weight and body mass index to the risk of hip and knee replacements in middle-aged women.
Rheumatology (Oxford). 2007;46(5):861-7.
50. Rojas-Rodriguez R, Ziegler R, DeSouza T, Majid S, Madore AS, Amir N, et al.
PAPPA-mediated adipose tissue remodeling mitigates insulin resistance and protects against
gestational diabetes in mice and humans. Sci Transl Med. 2020;12(571).
51. Fuentes EN, Bjornsson BT, Valdes JA, Einarsdottir IE, Lorca B, Alvarez M, et al.
IGF-I/PI3K/Akt and IGF-I/MAPK/ERK pathways in vivo in skeletal muscle are regulated by
nutrition and contribute to somatic growth in the fine flounder. Am J Physiol Regul Integr
Comp Physiol. 2011;300(6):R1532-42.
52. Nieuwenhuis TO, Yang SY, Verma RX, Pillalamarri V, Arking DE, Rosenberg AZ,
et al. Consistent RNA sequencing contamination in GTEx and other data sets. Nat Commun.
2020;11(1):1933.
53. Mostafavi H, Spence JP, Naqvi S, Pritchard JK. Limited overlap of eQTLs and
GWAS hits due to systematic differences in discovery. bioRxiv. 2022:2022.05.07.491045.
23medRxiv preprint doi: https://doi.org/10.1101/2023.03.01.23286618; this version posted March 3, 2023. The copyright holder for this preprint
(which was not certified by peer review) is the author/funder, who has granted medRxiv a license to display the preprint in perpetuity.
It is made available under a CC-BY 4.0 International license .
Joint space and hip osteoarthritis risk
Tables and figures
24medRxiv preprint doi: https://doi.org/10.1101/2023.03.01.23286618; this version posted March 3, 2023. The copyright holder for this preprint
Joint space and hip osteoarthritis risk
(which was not certified by peer review) is the author/funder, who has granted medRxiv a license to display the preprint in perpetuity.
Table 1. Conditionally independent minimum joint space width single nucleotide polymorphisms, and their associations with height, BMI, and
HOA risk.
RSID CHR BP C.GENE EA NEA EAF Cluster Cluster mJSW mJSW P HOA HOA P Height Height P BMI BMI P
prob beta Beta Beta Beta
rs7571789 2 70714793 TGFA C T 0.48 1 1 0.09 2.62x10-50 -0.06 5.32x10 -18 0.00 0.11 -0.01 3.00x10 -03
rs2236996 4 1703646 SLBP A G 0.48 1 0.99 0.05 1.15x10⁻¹³ -0.03 6.74x10 -04 -0.01 6.00x10 -07 0.00 0.11
-21 -11
rs10948155 6 44687957 SUPT3H T C 0.65 1 0.99 0.06 6.07x10 -0.05 9.17x10 0.00 0.78 0.01 1.70x10 -03
It is made available under a CC-BY 4.0 International license .
rs35199713 6 155415593 TIAM2 G A 0.03 1 0.82 0.11 3.25x10-09 -0.05 0.03 0.01 0.02 -0.02 6.50 10-03
rs17172430 7 55122650 EGFR A G 0.12 1 0.56 0.05 2.51x10-08 -0.02 0.1 0.00 0.93 0.00 0.67
rs7846438 8 69578824 C8orf34 A G 0.77 1 1 0.06 9.65x10⁻¹⁸ -0.04 1.48x10 -06 0.00 0.82 0.01 0.006
rs4979342 9 116905618 COL27A1 C T 0.27 1 1 0.06 3.88x10⁻¹⁶ -0.03 9.40x10 -05 0.00 0.24 0.00 0.52
rs76164690 10 32590362 EPC1 T G 0.86 1 0.93 0.05 2.37x10-08 -0.06 1.59x10 -07 -0.01 5.90x10 -06 0.01 9.10x10 -03
rs11857461 15 58319690 ALDH1A2 C T 0.49 1 0.92 0.04 2.26x10-09 -0.02 0.01 0.00 0.47 0.01 9.70x10 -03
rs34656141 19 2158228 AP3D1 T C 0.4 1 0.96 0.09 1.42x10-43 -0.03 2.34x10 -05 0.02 2.00x10 -76 0.00 0.11
-08 -03
rs2106973 22 28055460 MN1 G A 0.48 1 0.95 0.03 4.63x10 -0.02 6.95x10 0.01 1.70x10 -13 0.00 0.81
-11 -07 -30
rs981269 4 12897698 RAB28 T C 0.77 2 1 0.05 1.55x10 0.05 2.71x10 0.02 5.10x10 0.00 0.46
-28 12 -04
rs7711053 5 67822620 PIK3R1 G A 0.38 2 1 0.07 3.74x10 0.05 1.57x10- 0.01 1.90x10 -0.01 4.70x10 -03
-09 -87
rs270417 6 7729614 BMP6 T C 0.72 2 0.7 0.04 4.69x10 0.02 0.01 0.03 7.10x10 -0.01 4.40x10 -04
rs7869550 9 119134796 PAPPA+ A G 0.8 2 1 0.06 2.01x10⁻¹³ 0.06 2.15x10 -09 0.03 1.40x10 -74 0.00 0.27
-23 -11
rs76248879 9 119325659 ASTN2+ A T 0.87 2 1 0.1 1.07x10 0.10 2.18x10 Proxy NA
rs597974* 9 136144297 SURF6 A G 0.68 2 0.92 0.04 6.82x10-09 0.03 5.44x10 -03 0.00 4.1x10-03 0.00 0.15
-12 -07 -14
rs34651525 11 12846729 TEAD1 T A 0.69 2 1 0.05 1.53x10 0.04 1.28x10 0.01 5.40x10 0.00 0.73
-12 -03 -37
rs34949187 15 89386652 ACAN G A 0.18 2 0.87 0.06 7.65x10 0.03 2.69x10 0.02 1.40x10 0.00 0.42
rs2716212 17 67503653 MAP2K6 G A 0.61 2 0.67 0.04 1.18x10-08 0.06 2.89x10 -13 0.01 3.40x10 -14 0.00 0.27
-09 -09 -37
rs227734 17 54767470 NOG T C 0.3 2 0.98 0.04 7.44x10 0.05 2.66x10 0.02 2.80x10 0.00 0.09
rs823097 1 205681370 NUCKS1 G A 0.43 3 0.99 0.04 1.35x10-08 0.01 0.34 0.01 8.20x10 -23 0.01 5.2 x10-03
rs10933424 2 233872408 NGEF T C 0.89 3 0.91 0.06 2.65x10-09 -0.01 0.36 0.02 1.20x10 -14 0.00 0.77
-12 -10
rs7633464 3 98715823 DCBLD2 A G 0.48 3 1 0.04 5.71x10 0.00 0.85 0.01 4.90x10 0.00 0.29
25medRxiv preprint doi: https://doi.org/10.1101/2023.03.01.23286618; this version posted March 3, 2023. The copyright holder for this preprint
Joint space and hip osteoarthritis risk
(which was not certified by peer review) is the author/funder, who has granted medRxiv a license to display the preprint in perpetuity.
rs12511230 4 145471245 HHIP A T 0.6 3 1 0.05 5.66x10⁻¹⁸ 0.00 0.96 -0.01 2.70x10 -18 0.00 0.14
-08
rs2545730 5 98109985 RGMB G A 0.52 3 0.98 0.03 3.52x10 0.01 0.26 0.00 0.11 0.00 0.34
rs17138646 5 115346245 AQPEP T G 0.88 3 0.84 0.05 1.28x10-08 -0.01 0.32 0.00 0.097 0.00 0.99
-08 -04
rs62479589** 7 128406506 CALU G A 0.38 3 0.95 0.04 2.42x10 0.01 0.17 0.00 7.4 x10 0.00 0.69
-08
rs4744313 9 96846061 PTPDC1 T C 0.63 3 0.79 0.04 1.01x10 -0.01 0.25 0.00 0.22 0.01 0.01
rs10962293 9 16136648 C9orf92 C T 0.29 3 0.99 0.04 6.58x10-09 0.00 0.95 0.00 0.82 0.00 0.93
rs1413299 9 101761241 COL15A1 T G 0.37 3 0.56 0.04 1.39x10-08 -0.01 0.13 -0.01 5.30x10 -17 0.01 0.004
-08 -04
It is made available under a CC-BY 4.0 International license .
rs10739993*** 9 97982669 FANCC C T 0.59 3 0.98 0.04 1.79x10 0.00 0.94 0.00 7.4x10 0.00 0.15
rs45540840 11 118486110 PHLDB1 G A 0.22 3 0.99 0.04 1.87x10-08 0.00 0.96 0.01 3.60x10 -04 0.00 0.07
-19 -04
rs2260671 12 66174909 HMGA2 A G 0.08 3 1 0.1 8.19x10 0.00 0.98 0.01 3.30x10 0.00 0.58
-13
rs1809360 15 68189737 SKOR1 C T 0.57 3 1 0.05 1.12x10 0.00 0.65 0.00 0.84 -0.02 2.90x10 -14
-08
rs117564279 15 81224038 CEMIP A G 0.02 3 0.85 0.15 1.35x10 0.06 0.07 0.00 0.67 -0.01 0.14
-10 -11
rs7179372 15 67036441 SMAD6 G A 0.2 3 1 0.05 4.12x10 0.01 0.44 0.01 2.70x10 -0.01 0.02
rs62070652 17 29221277 ATAD5 C T 0.27 3 0.98 0.05 2.62x10⁻¹⁴ 0.02 0.05 0.04 1.60x10-166 0.00 0.4
-20 -51
rs8097746 18 46640782 DYM T C 0.59 3 1 0.06 9.12x10 0.01 0.14 0.02 4.80x10 0.00 0.02
-27
rs34717890 19 46400443 MYPOP+ T C 0.12 3 1 0.1 1.24x10 -0.01 0.25 0.00 0.18 0.00 0.39
rs61648765 19 46381864 FOXA3+ C G 0.78 3 1 0.07 2.11x10⁻¹⁹ 0.00 0.9 0.01 4.40x10 -04 0.00 0.17
rs34687269 9 119484132 ASTN2+ A T 0.52 Pal Pal 0.07 3.96x10⁻³² 0.07 2.32x10⁻¹⁹ 0.01 6.20x10 -23 0.00 0.71
Each conditionally independent mJSW SNP is assigned to a cluster according to HOA effect by MR-Clust. The probability for it being a
member of that cluster is given. Each SNP effect and p-value is given for a GWAS of mJSW, HOA, standing height and BMI.
Abbreviations: C.Gene – closest gene, mJSW – minimum joint space width, Pal – Palindromic SNP, SNP – single nucleotide polymorphism,
HOA – hip osteoarthritis, P – p-value
*proxy SNP rs687621 (r2= 0.98), ** rs6954748 (r2= 0.97), ***rs7854570 (r2= 0.99)
+rs7869550, rs76248879, rs34687269 mapped to PAPPA-ASTN2 locus, and rs61648765 and rs34717890 mapped to FOXA3-MYPOP locus
based on a 1mb sliding window approach.
26medRxiv preprint doi: https://doi.org/10.1101/2023.03.01.23286618; this version posted March 3, 2023. The copyright holder for this preprint
Joint space and hip osteoarthritis risk
(which was not certified by peer review) is the author/funder, who has granted medRxiv a license to display the preprint in perpetuity.
Table 2. Two sample Mendelian randomisation results.
IVW MR Egger Weighted median Simple Mode Weighted mode
Exposure Outcome SNPs Beta (95% CI) P Beta (95% CI) P Beta (95% CI) P Beta (95% CI) P Beta (95% CI) P
mJSW HOA 41 -0.01 (-0.19-0.17) 0.87 -0.37 (-0.91-0.17) 0.18 -0.02 (-0.13-0.09) 0.72 -0.03 (-0.23-0.18) 0.80 -0.07 (-0.29-0.14) 0.49
-25 -16 -03
Cluster 1 HOA 11 -0.60 (-0.71- -0.49) 2.47x10 -0.52 (-0.88- -0.16) 0.02 -0.58 (-0.72- -0.44) 1.61x10 -0.55 (-0.81- -0.29) 1.94x10 -0.66 (-0.90- -0.41) 3.64x10-04
Cluster 2 HOA 10 0.88 (0.71-1.04) 2.98x10⁻²⁶ 0.68 (0.07-1.29) 0.06 0.86 (0.68-1.04) 8.62x10⁻²¹ 0.88 (0.59-1.16) 1.99x10-04 0.84 (0.62-1.07) 3.71x10-05
Cluster 3 HOA 20 0.03 (-0.05-0.11) 0.47 0.01 (-0.23-0.26) 0.91 0.01 (-0.10-0.12) 0.86 0.00 (-0.22-0.21) 0.98 -0.01 (-0.20-0.18) 0.90
It is made available under a CC-BY 4.0 International license .
Cluster 1 Height 11 0.06 (-0.02-0.14) 0.16 0.20 (-0.05-0.45) 0.16 0.01 (-0.01-0.03) 0.17 0.01 (-0.01-0.03) 0.45 0.01 (0.00-0.03) 0.16
-05 -11
Cluster 2 Height 10 0.25 (0.14-0.36) 1.36x10 -0.07 (-0.40-0.26) 0.69 0.10 (0.07-0.13) 2.75x10 0.30 (0.11-0.50) 0.01 0.11 (0.08-0.13) 1.01x10-05
Cluster 3 Height 20 0.09 (-0.01-0.19) 0.07 0.09 (-0.22-0.40) 0.58 0.02 (-0.01-0.04) 0.22 0.02 (-0.01-0.06) 0.25 0.01 (-0.01-0.03) 0.22
Abbreviations: IVW – inverse variance weighted, MR – Mendelian randomisation, mJSW – minimum joint space width, SNP – single
nucleotide polymorphism, CI – confidence interval, P – p-value, HOA – hip osteoarthritis
27You can also read