A comparison of two deep-learning-based urban perception models: which one is better?
←
→
Page content transcription
If your browser does not render page correctly, please read the page content below
Wang et al. Computational Urban Science             (2021) 1:3                                                                        Computational Urban
https://doi.org/10.1007/s43762-021-00003-0
                                                                                                                                      Science

 ORIGINAL PAPER                                                                                                                                    Open Access

A comparison of two deep-learning-based
urban perception models: which one is
better?
Ruifan Wang1†, Shuliang Ren1†, Jiaqi Zhang1†, Yao Yao1,2* , Yu Wang1 and Qingfeng Guan1

  Abstract
  Urban perception is a hot topic in current urban study and plays a positive role in urban planning and design. At
  present, there are two methods to calculate urban perception. 1) Using a model to learn image features directly
  automatically; 2) Coupling machine learning and feature extraction based on expert knowledge (e.g. object
  proportion) method. With two typical streets in Wuhan as the study area, video data were recorded and used as
  the model input. In this study, two representative methods are selected: 1) End to end convolution neural network
  (CNN-based model); 2) Based on full convolution neural network and random forest (FCN + RF-based model). By
  comparing the accuracy of two models, we analyze the adaptability of the model in different urban scenes. We also
  analyze the relationship between CNN-based model and urban function based on POI data and OSM data, and
  verify its interpretability. The results show that the CNN-based model is more accurate than FCN + RF-based model.
  Because the CNN-based model considers the topological characteristics of the ground objects, its perception results
  have a stronger nonlinear correlation with urban functions. In addition, we also find that the CNN-based model is
  more suitable for scenes with weak spatial heterogeneity (such as small and medium-sized urban environments),
  while the FCN + RF-based model is applicable to scenes with strong spatial heterogeneity (such as the downtown
  areas of China’s megacities). The results of this study can be used as a reference to provide decision support for
  urban perception model selection in urban planning.
  Keywords: Urban perception, Deep learning, Urban functions, Street views, Random forest

1 Introduction                                                                         oriented urban planning (Blaxland, Shang, & Fisher,
Urban perception refers to people’s feelings about the                                 2014). People’s perceptions of the city are of great value
urban visual environment, that is, their esthetic judg-                                in future urban planning and design (Been et al., 2016;
ment of the urban scene (Weber, Schnier, & Jacobsen,                                   Cheng et al., 2017; Ozkan, 2014). Therefore, it is very
2008). In recent years, urban perception studies have de-                              important to study the method of urban perception for
veloped rapidly. The results have been applied to many                                 decision support in urban management, urban planning
aspects of urban construction, such as urban space es-                                 and policymaking.
thetics, urban safety, and urban public health (Harvey                                   Traditional perception data are collected by social sci-
et al., 2015; Helbich et al., 2019; Weber et al., 2008). The                           entists through field investigation (Liu et al., 2015;
Chinese government puts forward the idea of people-                                    Sampson, 2012). This method is time-consuming, ex-
                                                                                       pensive and has a small study scope. Street view object-
* Correspondence: yaoy@cug.edu.cn                                                      ively depicts the real urban landscape, which has been
†
 Ruifan Wang, Shuliang Ren and Jiaqi Zhang contributed equally to this                 proven to be effective and reliable data to measure the
work.
1                                                                                      urban environment (Long & Liu, 2017; Zhang et al.,
 School of Geography and Information Engineering, China University of
Geoscience, Wuhan 430078, Hubei, China                                                 2018a, b, c). In recent years, perception prediction based
2
 Alibaba Group, Hangzhou 311121, Zhejiang, China

                                      © The Author(s). 2021 Open Access This article is licensed under a Creative Commons Attribution 4.0 International License,
                                      which permits use, sharing, adaptation, distribution and reproduction in any medium or format, as long as you give
                                      appropriate credit to the original author(s) and the source, provide a link to the Creative Commons licence, and indicate if
                                      changes were made. The images or other third party material in this article are included in the article's Creative Commons
                                      licence, unless indicated otherwise in a credit line to the material. If material is not included in the article's Creative Commons
                                      licence and your intended use is not permitted by statutory regulation or exceeds the permitted use, you will need to obtain
                                      permission directly from the copyright holder. To view a copy of this licence, visit http://creativecommons.org/licenses/by/4.0/.
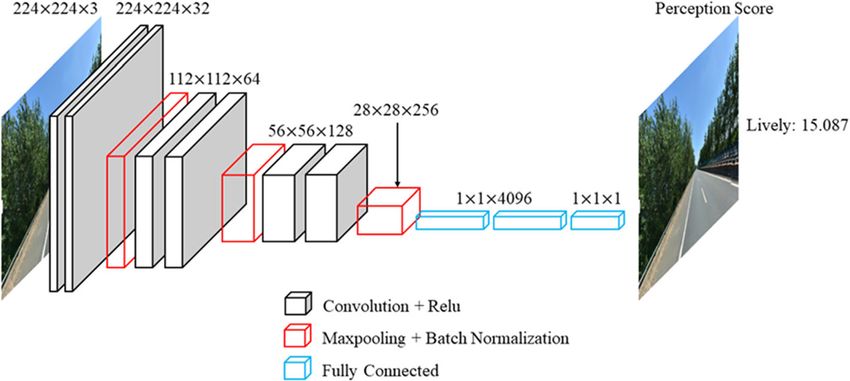
Wang et al. Computational Urban Science   (2021) 1:3                                                          Page 2 of 13

on street view images has received increasing attention.      This method has been used in the field of public health
Salesses, Schechtner, and Hidalgo (2013) found that           (Wang et al., 2019a, b), and the results are reasonable
street view images can be used to assess the social and       and interpretable. Compared with the black box mech-
economic impact of the urban environment. Naik et al.         anism of the CNN perception model, the perception
(2014) proposed a method of scene perception predic-          model of FCN + RF-based model proposed by Yao et al.
tion based on support vector regression. However, this        (2019) obtains artificial features from expert knowledge
method has the problem of relying on predefined feature       and has better interpretability.
mapping. With the popularity of deep learning, most             The two deep learning methods have different princi-
scholars have begun to introduce it into the study of         ples in obtaining features and fitting urban perception
urban perception (Dubey et al., 2016; Liu et al., 2017a,      scores. This leads to a discussion of the differences be-
b). Porzi et al. (2015) proved that deep learning is super-   tween the two models. Therefore, this study proposes
ior to traditional feature description in predicting human    two issues for further discussion: 1) What are the advan-
perception. Naik, Raskar, and Hidalgo (2016) and Zhang        tages and disadvantages of the two methods in the urban
et al. (2018a, b, c) used computer vision to simulate indi-   perception prediction task? 2) Is the result of automatic
viduals to quantify urban perception scores.                  feature extraction based on the deep learning model rea-
  At present, the dataset used in urban perception is         sonable explanation? At present, there is no relevant
mainly the place pulse dataset provided by MIT (Ordo-         study on this issue.
nez & Berg, 2014; Porzi et al., 2015). This urban percep-       To solve the above problems, this study constructs a
tion dataset has collected street view images from many       typical model (CNN-based model) which can automatic-
cities around the world but lacks training samples for        ally learn deep features and compares its score results
the cities of mainland China. There are obvious differ-       with FCN + RF-based model (Yao et al., 2019). We train
ences in architectural styles and town planning between       the CNN-based model based on the China urban per-
the East and the West (Ashihara, 1983). The urban per-        ception dataset (Yao et al., 2019). Then, we use the
ception model derived from this global dataset may not        street view images that we collected by video to explore
be applicable to the cities in mainland China. Therefore,     the differences in perception scores between the two
Yao et al. (2019) proposed building a unique urban per-       methods and analyze models’ scene suitability. To verify
ception dataset in China. They constructed a human-           the interpretability of the CNN-based model, we use
machine adversarial scoring framework based on deep           point of interests (POI) and OpenStreetMap (OSM) data
learning to support the perception study of cities and re-    to explore the drivers that affect different perceptions.
gions in mainland China and finally obtained interpret-
able results.                                                 2 Methodology
  The above work shows that urban perception based on         Figure 1 displays the flow chart of this study. First, we
street view images and deep learning technology is the        develop a mobile app that can capture driving scenes
main study direction, which can deepen people’s under-        and obtain real-time longitude and latitude data at the
standing of large-scale urban environment scenes in a         same time. According to app’s time-series data, we
more automatic and effective way. There are two ways          process the mobile video files to get the image dataset of
to obtain urban perception score through deep learning.       the study area. Second, we use the China urban percep-
The first is to learn the deep features automatically via     tion dataset (Yao et al., 2019) as the training dataset to
the deep learning model and fit the urban perception          train six perception models (beautiful, wealthy, depress-
score. For example, Dubey et al. (2016) used an end-to-       ing, lively, safety, boring) and quantify the street view
end model to directly extract the high-dimensional fea-       images of the study area. Third, based on the street view
tures of street view images to predict the urban percep-      images collected while driving we evaluate the accuracy
tion scores. Zhang et al. (2018a, b, c) used the street       of the model results and analyze the scene suitability of
view images as the input, acquired the scores as the out-     the CNN-based model and FCN + RF-based model.
put and predicted the perception scores of the images in      Then, POI and OSM road network data are used to
six dimensions.                                               analyze the driving factors of different urban percep-
  Another method is to obtain the features (object pro-       tions, and the interpretability of CNN-based model is
portion) constructed by expert knowledge based on             verified.
scene semantic deep learning model and then fit them
by machine learning. For example, the FCN + RF based          2.1 Mobile video access to street view images
model proposed by Yao et al. (2019) firstly uses the full     According to the time series data collected by GPS, the
convolution neural network to identify the ground ob-         adjacent points’ timestamps are calculated. The study
jects and then obtains urban perception score based on        area’s street view images are extracted from the video
the proportion of ground objects and random forest.           file by using the time stamp information. The code is

Wang et al. Computational Urban Science          (2021) 1:3                                                        Page 3 of 13

 Fig. 1 Workflow of assessing street-level local urban perception

freely available at https://github.com/Leitast/                     Tootoonian, & Cao, 2018). Considering the small num-
LocationListener. In this study, a mobile phone is placed           ber of training samples in this study, the network depth
in a vehicle for video recording. The bottom of the                 is reduced to avoid degradation. By repeatedly stacking a
scene, which includes the vehicle, is cut to ensure the             3 × 3 convolution kernel and a 2 × 2 maximum pooling
experiment’s reliability.                                           layer, a model for urban perception is constructed. In
                                                                    this study, batch normalization is used to speed up the
2.2 CNN-based urban perception model                                convergence of the model and avoid gradient dispersion.
The depth of the network is critical to the performance             Batch normalization is better than dropout (Ioffe & Sze-
of the model. When the number of network layers is in-              gedy, 2015).
creased, the network can extract more complex features                 Traditional CNN models perform well in image classi-
(Simonyan & Zisserman, 2014). To extract enough                     fication (He et al., 2016; Krizhevsky, Sutskever, & Hin-
image features, we construct an end-to-end CNN model                ton, 2012; Simonyan & Zisserman, 2014). In the field of
to represent urban perception. The end-to-end percep-               urban study, CNNs have been used for the semantic seg-
tion model proposed in this study refers to the structure           mentation of urban traffic scenes and land-use change
of VGGNet (Simonyan & Zisserman, 2014). The model’s                 analysis (Deng et al., 2017; Zhai et al., 2020). As shown
parameters and structure have been proved to be reliable            in Fig. 2, to preserve the image feature structure, we re-
in many aspects of image feature extraction (Ha et al.,             place the softmax, which is responsible for multiclassifi-
2018; Liu et al., 2018; Lu et al., 2017). Increasing net-           cation tasks, with a one-dimensional full connection
work’s depth may lead to degradation, and may cause                 layer to realize the end-to-end function. By inputting a
decrease of testing and training accuracy results (Monti,           street view image, the model can extract the topological
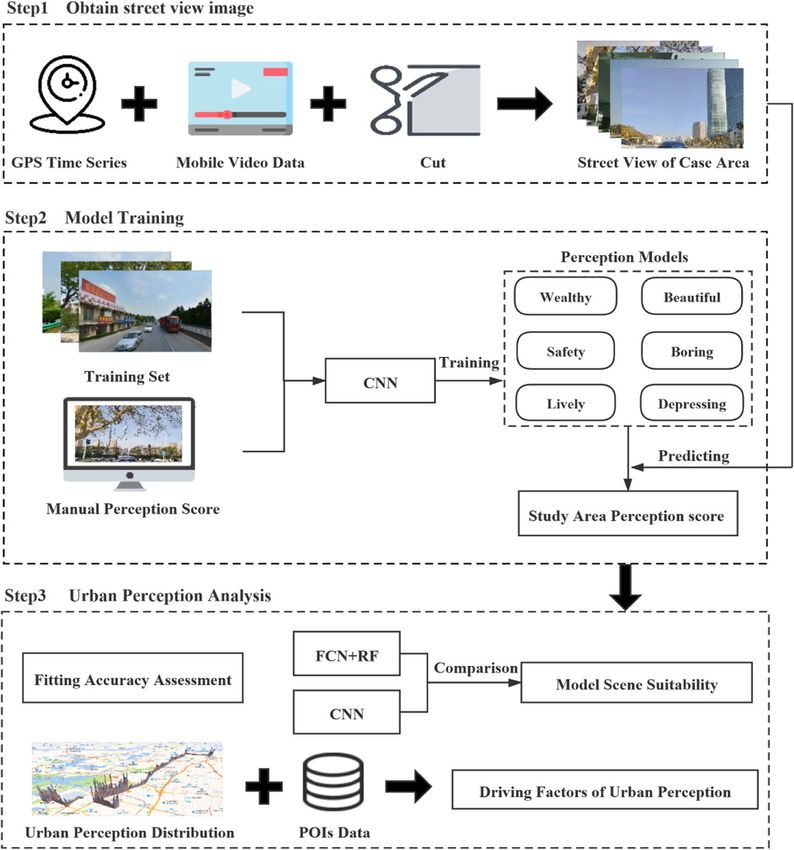
Wang et al. Computational Urban Science     (2021) 1:3                                                                            Page 4 of 13

 Fig. 2 The computational framework of the CNN model

features of the image and obtain the urban perception        through the feature importance function of random
score.                                                       forest.

2.3 FCN + RF-based urban perception model                    2.5 Accuracy assessment
The FCN + RF-based model (Yao et al., 2019) is used in       During the process of comparing the advantages and
this study for comparative analysis. FCN can predict the     disadvantages of the different models and using POI and
semantic features of each pixel in the image to generate     OSM to analyze the correlation between urban function
natural target level segmentation results and obtain the     and urban perception, this study uses the mean absolute
classification of each image (such as sky, road, car, and    error (MAE), root mean squared error (RMSE) and
building) (Badrinarayanan, Kendall, & Cipolla, 2017;         Pearson correlation coefficient (Pearson R) to quantify
Cordts et al., 2016; Long, Shelhamer, & Darrell, 2015).      the accuracy between the predictions and the ground-
Yao et al. (2019) selected the annotated images in the       truth values. The MAE, RMSE and Pearson R are math-
ADE-20 k scene analysis and segmentation database            ematically represented by Eq. (1) to Eq. (3), respectively.
(Zhou et al., 2017; Zhou et al., 2019). Taking the street
view images as the input of the FCN, the ratio of 151                       1X n
                                                                MAE ¼            jy − yb j                                                   ð1Þ
categories in each image is obtained. Finally, the ratios                   n i¼1 i i
of the 151 categories are used as the input of RF to ob-               sffiffiffiffiffiffiffiffiffiffiffiffiffiffiffiffiffiffiffiffiffiffiffiffiffiffiffiffiffi
tain the scores of each urban perception. The model has                 1X    n
been applied in public health (Wang et al., 2019a, b) and       RMSE ¼             ðy − yb Þ2                                                ð2Þ
                                                                        n i¼1 i i
proved to be reliable and effective. The detailed struc-
ture of the model can refer to the paper of Yao et al.                                       Pn
(2019). The software can be found at http://www.                                                     − yi Þ ybi − ybi
                                                                                                 i¼1 ðyi
                                                                Pearson R ¼ qffiffiffiffiffiffiffiffiffiffiffiffiffiffiffiffiffiffiffiffiffiffiffiffiffiffiffiffirffiffiffiffiffiffiffiffiffiffiffiffiffiffiffiffiffiffiffiffiffiffiffiffiffiffiffiffiffi
                                                                                                                                  2ffi       ð3Þ
urbancomp.net/2020/08/03/semantic-segmentation-                              Pn                        2 Pn
software-for-visual-images-based-on-fcn.                                          i¼1 ðyi − yi Þ               i¼1 y    bi − ybi
                                                                                                                                        Pn
2.4 Interpretability analysis of urban perception based on   where yi is the ground-truth value, y is equal to                      1
                                                                                                                                    n     i¼1 yi ,
POI and OSM data                                             and ybi is the predicted result.
POI data have been applied to urban functional area
identification (Yuan, Zheng, & Xie, 2012). Palczewska        3 Study area and data
et al. (2014) demonstrated the correlation between urban     As the largest political, economic and cultural center in
function and urban perception using random forest. Yao       Central China (Sun, Chen, & Niu, 2016), Wuhan has be-
et al. (2019) also verified the interpretability of the      come one of the most rapidly developing cities in China.
FCN + RF-based model from the perspective of urban           As shown in Fig. 3, this study selects two streets, LuMo
function based on POI or OSM and Random Forest.              Road and Gaoxin Avenue, which run through the sub-
Therefore, we get the urban perception distribution          urbs and urban center of Wuhan. Figure 3(c) shows that
using the CNN-based model, analyze the correlation be-       the red line represents LuMo Road, connecting the
tween the urban functional areas and the simulation re-      school and the business center. The yellow line repre-
sults, and explore the model results’ interpretability       sents Gaoxin Avenue, which connects the satellite city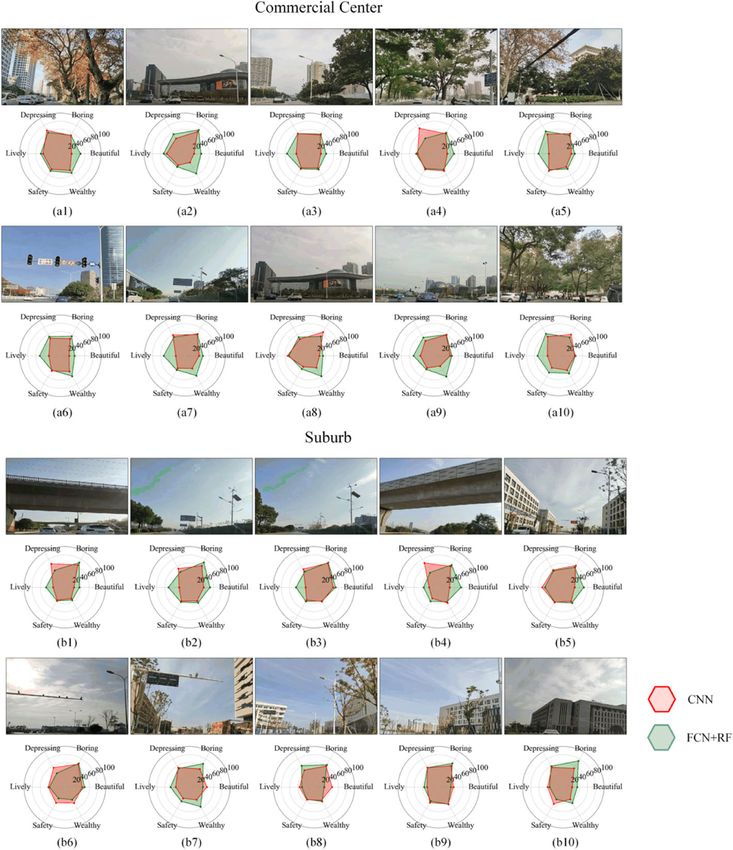
Wang et al. Computational Urban Science         (2021) 1:3                                                                             Page 5 of 13

 Fig. 3 The study area and its location in Hubei Province in China: a the geographic location of Wuhan City in Hubei; b the study area; c the red
 lines are LuMo Road and the yellow lines are Gaoxin Avenue. The white lines are the main roads in the study area obtained
 from openstreetmap.org

(Zuoling community) and the central city. From east to                      analysis in the study area. (E) and (F) are street view im-
west, Gaoxin Avenue passes through undeveloped sub-                         ages in the study area collected through mobile video.
urbs, satellite cities, science and technology industrial                     POI and OSM data are also used in our study. Gaode,
parks newly planned by the government, mature com-                          the largest online map service provider in China, has
mercial district, and residential area. Therefore, the                      complete POI resources (http://amap.com). We obtain
street view images collected from these two streets can                     24 categories of POI data in the study area (https://lbs.
cover various of urban functional areas in Wuhan. They                      amap.com/api/webservice/download). To facilitate the
have an excellent verification effect in the comparative                    follow-up study, we combine similar classes and calcu-
analysis of the models.                                                     late the kernel density (Fig. 5). The processed 12 kinds
  We obtain the street view images of 3592 sample                           of POI and OSM road network data can describe and
points for perception analysis. Among them, 1154 sam-                       analyze the social economy and infrastructure (Liu et al.,
ple points are collected from LuMo Road, and 2798                           2017a, b; Yao et al., 2018).
sample points are collected from Gaoxin Avenue.
  Figure 4 shows the street view images used in this                        4 Results
study. (A), (B), (C) and (D) are the sample images of the                   4.1 Comparison of model accuracy based on street view
China urban perception dataset (Yao et al., 2019) used                      dataset
for model training. Each image in the dataset is scored                     In this study, the China urban perception dataset (Yao
on six perceptions (wealthy, safety, lively, beautiful, bor-                et al., 2019) is divided into a training set and a test set,
ing and depressing, with a score range of 0–100 by vol-                     where 80% of the data are used for training and 20% of
unteers who have a good understanding of the local                          the data are used for testing. We use the training set to
socio-economic background). The geographic location of                      build the fitting model and use the test set to evaluate
the images in the dataset is close to the study area.                       the prediction results of the model. It should be noted
Therefore, this dataset is of great help for the perception                 that the parameters of the FCN module in FCN + RF-
Wang et al. Computational Urban Science          (2021) 1:3                                                                               Page 6 of 13

 Fig. 4 Street view images involved in this study: (A) (B) (C) (D) are samples of street view images provided from the training data set. (E1- E4) and
 (F1- F4) are street view images obtained by a mobile phone. (E1)- (E4) are images of the Wuhan Optical Valley (CBD area), (F1)- (F4) are images of
 the campus of the China University of Geosciences

based model are set by referring to Long et al. (2015),                      CNN-based model can also learn highly representative
while the RF part is formed by grid optimization. These                      and hierarchical image features from sufficient training
models and parameters have been widely used in image                         data (Shin et al., 2016)
semantic segmentation (Zhou et al., 2016), segmentation
of street view images (Middel et al., 2019), remote sens-                    4.2 Comparison of model results based on real
ing image classification (Han et al., 2020; Piramanaya-                      application environment
gam et al., 2016), public health (Zamani Joharestani                         According to Tables 1 and 2, the accuracy of CNN-
et al., 2019), and proved to be effective. To better com-                    based model is higher than that of FCN + RF-based
pare the CNN-based model, we refer to (Bulat & Tzimir-                       model. However, the two models have different charac-
opoulos, 2016; Simonyan & Zisserman, 2014) and other                         teristics of simulated urban perception scores, so it is ne-
models      to set      parameters for the CNN’s                             cessary to analyze the difference and similarity between
hyperparameters.                                                             model scores and the specific application environment.
  Table 1 shows the training accuracy results of the six                     Based on the app’s street view data, we simulate the real
perception models. The Pearson R of all perceptions is                       environment and compare the two models. Figure 6
greater than 0.9, which shows that the CNN-based                             shows the distribution of six perceptions in the study
model proposed in this study has a good perception ef-                       area obtained from the two models.
fect. The results of the FCN + RF-based model is shown                         From Fig. 6, we find that there is a strong similarity
in Table 2. We find that the fitting results based on                        distribution between the two methods in the study area
CNN model (the average error of RMSE of each percep-                         (except for beautiful scores). On the left side of the study
tion is around 6.5) are more accurate than those based                       area, the scores of wealthy, lively and safety are signifi-
on FCN + RF-based model (the average error of RMSE                           cantly higher than those of the right. The boring scores
of each perception is approximately 9.1). The CNN can                        show a high level in the whole study area. When under
automatically extract the features from images (Sun, Li,                     the overpass of the city (the brown line area on the left
& Huang, 2017). These features represent the color, con-                     in Fig. 6 e(1) and e(2)), the depressing scores increase
tour, texture, and spatial structure of the objects in im-                   significantly.
ages (Hu et al., 2015; Jiao et al., 2017; Kim & Pavlovic,                      Urban streetscape can reflect spatial distribution of
2016; Sahiner et al., 1996). Compared with the method                        landscape elements in a certain area. The spatial distri-
of calculating the proportion of ground objects, the                         bution of the landscape is potentially related to regional
Wang et al. Computational Urban Science            (2021) 1:3                                                                                 Page 7 of 13

  Fig. 5 Distribution of Gaode POIs and OSM in the study area using kernel density. POI categories: traffic facilities (TRA), tourist attractions (TOU),
  life service (LF), shopping (SHP), residential communities (RES), public facilities (PUB), medical service (MHS), education facilities (EDU), financial
  services (FIN), government (GOV), entertainment facilities (ENT), commercial and business (COM). ROAD indicates the density of the road network

land use and functional heterogeneity (Zhang et al.,                            functions, and the area has a high heterogeneity pattern
2018a, b, c). Therefore, urban perception simulated by                          (Deng et al., 2020; Irwin & Bockstael, 2007). While
the street view is also affected by the land use and urban                      urban suburb areas usually have a low scene complexity,
heterogeneity pattern to a certain extent. In order to fur-                     where the objects are relatively homogeneous and the
ther analyze the perception differences in real scenes, we                      urban functions are simple (Zhou, Pickett, & Cadenasso,
selected several scenes with different land use and het-                        2017). The suburb area has a low heterogeneity pattern
erogeneity patterns (Fig. 7).                                                   (Irwin & Bockstael, 2007). The two models have evident
  Urban central areas usually have a high scene com-                            differences in perception score between commercial cen-
plexity, which have diverse object types and mixed urban                        ter and suburb.
Table 1 Testing accuracy of the urban perception estimation                     Table 2 Testing accuracy of the urban perception estimation
via CNN                                                                         via FCN + RF
Perceptions               Pearson R               RMSE                MAE       Perceptions               Pearson R               RMSE                MAE
Safety                    0.921                   5.207               2.941     Safety                    0.787                   8.273               3.954
Lively                    0.930                   7.656               4.942     Lively                    0.797                   11.163              5.883
Wealthy                   0.928                   5.968               3.536     Wealthy                   0.798                   9.537               4.810
Beautiful                 0.939                   6.441               3.462     Beautiful                 0.839                   9.950               6.302
Boring                    0.900                   5.590               2.814     Boring                    0.820                   7.270               4.528
Depression                0.926                   5.194               2.647     Depression                0.793                   8.411               4.543
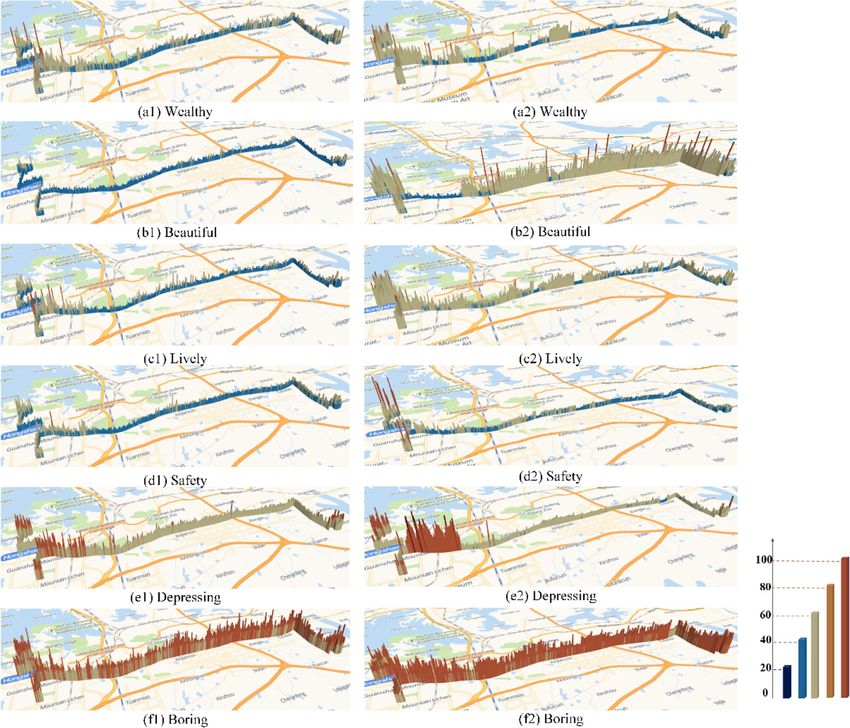
Wang et al. Computational Urban Science           (2021) 1:3                                                                               Page 8 of 13

 Fig. 6 The distribution of urban perception results in the study area. (a1) - (f1) is the perception result of CNN based model, and (a2) - (f2) is the
 perception result of FCN + RF based model. According to the different scores (the range of scores is 0–100), the results are divided into five equal
 parts. The cube height represents the perception score. [0,20] is dark blue, (20.40] is sky blue, (40,60] is yellow, (60.80] is orange, and (80,100]
 is brown

  In the commercial center, the FCN + RF-based model                          model in Fig. 7 (a4) gives a significantly abnormal score
is more consistent with the real scene in the perception                      for depressing perception. Contrary to (a3), (a4) and (a5)
of beautiful, lively and wealthy. However, the CNN-                           in Fig. 7, (b1) and (b4) in Fig. 7 are under an overpass
based model achieves more reasonable results in the                           on suburban roads, which blocks the sky and other ele-
suburb. The green plants and sky in the street scene are                      ments, indicating that large-scale human-made features
positive visual elements, which will have a positive im-                      can have a negative impact (Zhang et al., 2018a, b, c). By
pact on the feeling of beautiful, quiet and happy (Kauf-                      extracting the image’s spatial structure and color fea-
man & Lohr, 2002; Quercia, O'Hare, & Cramer, 2014),                           tures, the CNN-based model gives a high depressing
but have a negative correlation with depressing (Helbich                      score, which is significantly higher than that of the
et al., 2019; Zhang et al., 2018a, b, c). (a1), (a3), (a4) and                FCN + RF-based model.
(a5) in Fig. 7 are mixed scene of complex landscape and                          There is a close relationship between the traffic/crowd
natural landscape. Due to trees and other natural land-                       flow and the environment liveness (Yao et al., 2019).
scapes, people will have higher beautiful perception and                      Downtown areas tend to have higher traffic and crowd
lower depressing perception. In these scenes, FCN + RF-                       flow (Zhang et al., 2018a, b, c; Zhang et al., 2019). For
based model gets higher beautiful score. CNN-based                            example, (a3), (a6), (a7) and (a9) in Fig. 7 are located on
Wang et al. Computational Urban Science       (2021) 1:3                                                                         Page 9 of 13

 Fig. 7 The comparison of the perception scores by the CNN-based model and FCN + RF-based model for the samples in case study areas: (a1)
 -(a10) are scenes with strong spatial heterogeneity; (b1)- (b10) are scenes with weak spatial heterogeneity

the urban trunk road with dense traffic flow; (a5) and                  4.3 Interpretability analysis of the model
(a10) in Fig. 7 are located in the campus with dense ped-               There is a specific correlation between urban function
estrian flow. The lively scores of the FCN + RF-based                   and urban perception, and POI data can reflect urban
model in these scenes are higher than those of CNN-                     functional areas (Hu & Han, 2019; Zhang, Du, & Wang,
based model. However, in suburb, the objects are single,                2017). Therefore, based on POI and OSM, we analyze
and the people and vehicles flow are rare, such as (b2)                 the model’s interpretability fitting results from the per-
and (b3) in Fig. 7, which are scenes driving on a subur-                spective of urban function. Tables 3 and 4 are the urban
ban highway, the FCN + RF-based model gives a high                      perception results of the CNN-based model and FCN +
lively score, which is inconsistent with the real scene ex-             RF-based model fitted by POI and OSM. The two
perience. The buildings density has a positive impact on                models show good adaptability to each perception (R2 >
the wealthy perception (Yao et al., 2019). The FCN + RF-                0.89, Pearson R > 0.94). Our results show that there is a
based model gets higher wealthy scores in (a2) and (a8)                 strong nonlinear relationship between urban perception
which are complete landscape scenes in Fig. 7. This is                  and urban function. POI and OSM can accurately esti-
because they are located in the city center’s commercial                mate the distribution of urban perception and is an ef-
area, and the prosperity of buildings is higher than that               fective method to evaluate urban perception. By
of other areas. The wealthy score of the FCN + RF-based                 comparing the results of Tables 3 and 4, we find that the
model is more reasonable and effective.                                 fitting accuracy of the CNN-based model is better than
Wang et al. Computational Urban Science           (2021) 1:3                                                           Page 10 of 13

Table 3 Testing accuracy of the urban perceptions (CNN) based          difference in urban perception results between the two
on the POI and OSM densities via RF                                    models in the study area. By combining POI data and
Perceptions            R2                 Pearson R            RMSE    OSM data, we calculate the weight of the driving factors
Wealthy                0.944              0.975                0.016   that affect the urban perception, and analyze the inter-
Beautiful              0.937              0.972                0.018   pretability of the results based on the CNN-based
                                                                       model.
Lively                 0.940              0.973                0.020
                                                                         Both models achieved ideal prediction accuracy (Pear-
Safety                 0.927              0.969                0.015
                                                                       son R > 0.78). However, the CNN-based model has bet-
Depressing             0.940              0.973                0.014   ter accuracy than the FCN + RF based model. The RMSE
Boring                 0.928              0.969                0.015   index of the CNN-based model is 2.6 lower than that of
                                                                       the FCN + RF-based model. Therefore, the result of the
that of the FCN + RF-based model (RMSE of CNN is                       CNN-based model is slightly better than that of the
0.016, RMSE of FCN + RF is 0.021).                                     FCN + RF-based model. In addition, compared with the
   Yao et al. (2019) proves that FCN + RF-based model                  method of using semantic segmentation first and then
has good interpretability by using POI and feature                     using random forest to determine the perception scores,
weight ranking of random forest. This study will also                  the CNN-based model directly obtains the perception
refer to Yao et al. (2019) study to verify the interpretabil-          scores by inputting the images, which is faster and
ity of CNN-based model. The weight relationship be-                    easier.
tween urban perception and POI or OSM categories is                      By extracting the high-dimensional features, the CNN-
shown in Table 5.                                                      based model can obtain a high degree of nonlinear cor-
   Through the analysis of the results, we find that resi-             relation between urban perception and urban functions.
dential communities and roads are the most critical fac-               Through the study of the correlation and the weight be-
tors affecting urban perception in the case study area. In             tween urban function and urban perception, we find that
Yao et al. (2019), the six emotions are greatly affected by            there is spatial similarity between the distribution of
Edu and Gov. This study finds that the urban functions                 urban perception and the distribution of urban func-
that affect urban perception are different from each                   tional areas. POI data and OSM data can accurately esti-
other. ENT has a considerable weight of the wealthy per-               mate the distribution of urban perception (the average
ception, consistent with the general recognition that en-              error of RMSE for six perceptions is 0.016). The case
tertainment consumption places are in developed areas.                 study quantificationally determines the impact of the
Because depression is closely related to academic pres-                urban functions on urban perception and proves that
sure, education areas have a great impact on depression                the CNN-based model proposed in this study has better
perception (Ang & Huan, 2006). The perception of                       rationality in promoting the evaluation of local urban
safety and lively have very strong relationships with the              perception. The FCN + RF-based model ignores the
residential communities. This is because the community                 spatial topological features of the ground objects, which
has the characteristics of frequent people flow and has                leads to its lower correlation with urban function than
reasonable security measures, which will bring great                   the CNN-based model (the average error of RMSE of six
comfort to people (Holmberg, 2005).                                    perceptions is 0.021).
                                                                         The CNN-based model is more suitable for scenes
5 Discussion                                                           with weak spatial heterogeneity, such as small cities or
In this study, an end-to-end urban perception evaluation               suburbs in central China. The FCN + RF-based model
model based on street view images is proposed by build-                has more advantages for urban areas with strong spatial
ing a multilayer CNN. We choose the FCN + RF-based                     heterogeneity, such as the developed metropolises in
model as the comparison method and analyze the                         central China. The CNN-based model can extract the
                                                                       features of the ground objects, such as color, texture and
Table 4 Testing accuracy of the urban perceptions (FCN + RF)           density (Hu et al., 2015; Jiao et al., 2017; Kim & Pavlovic,
based on the POI and OSM densities via RF
                                                                       2016; Sahiner et al., 1996). These detailed features are
Perceptions            R2                 Pearson R            RMSE
                                                                       more reasonable in representing scenes with weak
Wealthy                0.942              0.971                0.020   spatial heterogeneity. The FCN + RF-based model is suit-
Beautiful              0.946              0.973                0.020   able for scenes with strong spatial heterogeneity. When
Lively                 0.899              0.948                0.026   scenes contain strong spatial heterogeneity, the features
Safety                 0.945              0.972                0.026   of the ground objects become fuzzy, and the impact on
Depressing             0.973              0.986                0.016
                                                                       urban perception will decrease. By directly calculating
                                                                       the ratio of the ground objects, a more accurate score
Boring                 0.893              0.945                0.022
                                                                       can be obtained. Therefore, the two models have their
Wang et al. Computational Urban Science (2021) 1:3 Page 11 of 13 Table 5 Fitting weights perceptions and POI or OSM categories: government (GOV), life service (LF), medical service (ME), public facilities (PUB), residential communities (RES), traffic facilities (TRA), financial services (FIN), entertainment facilities (ENT), tourist attractions (TOU), road (RO), commercial and business (COM), shopping (SHP), and education facilities (EDU). A gradient background color from blue to yellow to red indicates a gradual increase in value own advantages. The method needs to be chosen ac- we can only compare and analyze the existing small- cording to the actual spatial heterogeneity of the urban scale urban data. In the future, we will collect street view environment to obtain a more accurate urban perception images of other regions (urban, suburban, rural) based score. on the collection method proposed in this study and There are still some deficiencies and many opportun- construct Chinese perception data set to increase the ities for future study. First, the mobile video is shot persuasiveness. along the city streets. Considering that the front view plays a leading role in commuting, this study only selects 6 Conclusion the front view of the car and does not take a left or right In view of the consistency and interpretability of the pre- view into account. However, the areas beside the road, diction results of the two different urban perception such as parks and communities, also have a certain im- models, this study extracts the street view images in the pact on people’s cognition (Abkar et al., 2010; Oetzel study area through mobile video, constructs a CNN- et al., 2011). The purpose of this study is to analyze the based model and FCN + RF-based model by using the applicability of the two models. Forward-looking images China urban perception dataset, and compares the re- can effectively explain the rationality of the results of sults of the different models on two urban road net- urban perception. Therefore, in future studies, we will works in Wuhan, China. In this study, the prediction consider adding two side views and more street views on accuracy is ideal (the Pearson R of the CNN-based different blocks; expanding our study to actual applica- model is 12% higher than that of the FCN + RF-based tion scenarios will also be considered. model, and the RMSE of the CNN-based model is 2.6% Second, urban perception is related not only to street- lower than that of the FCN + RF-based model). This view but also to other factors in the city, such as season, shows that the proposed CNN-based model is effective temperature, humidity and noise (Gunnarsson et al., for urban perception assessment. The two models both 2017; Hong & Jeon, 2015). Therefore, in future work, have reached the ideal accuracy. By using POI data and more evaluation objectives will be considered in the OSM data for auxiliary analysis, we find that there is a study of urban perception, and an end-to-end perception strong nonlinear correlation between urban function model will be adopted to obtain higher accuracy and and urban perception. The CNN-based model has more stronger interpretability. advantages in predicting the urban perception by The third is what we need to do in the future. At extracting the high-dimensional features and has a present, there is no Chinese urban perception data set higher degree of correlation with the urban function. (official). Therefore, when comparing different methods, The scene suitability of the two models is different. The
Wang et al. Computational Urban Science                   (2021) 1:3                                                                                           Page 12 of 13

CNN-based model is suitable for scenes with weak                                        Ha, I., et al. (2018). Image retrieval using BIM and features from pretrained VGG
spatial heterogeneity, and the FCN + RF-based model is                                       network for indoor localization. Building and Environment, 140(2018), 23–31.
                                                                                        Han, Z., et al. (2020). Comparing fully deep convolutional neural networks for
suitable for scenes with strong spatial heterogeneity.                                       land cover classification with high-spatial-resolution Gaofen-2 images. ISPRS
This study can accurately and quickly identify the ex-                                       International Journal of Geo-Information, 9(8), 478.
posed perception of residents and will promote urban                                    Harvey, C., et al. (2015). Effects of skeletal streetscape design on perceived safety.
                                                                                             Landscape and Urban Planning, 142, 18–28.
planners to integrate the concept of urban perception                                   He, K., et al. (2016). Deep residual learning for image recognition. In The IEEE
into the planning practice. The results will provide deci-                                   Conference on Computer Vision and Pattern Recognition (CVPR) (pp. 770–778).
sion support for government managers in urban plan-                                     Helbich, M., et al. (2019). Using deep learning to examine street view green and
                                                                                             blue spaces and their associations with geriatric depression in Beijing, China.
ning to achieve a more sustainable and human-oriented                                        Environment International, 126, 107–117.
urban development.                                                                      Holmberg, L. (2005). Policing and the feeling of safety: The rise (and fall?) of
                                                                                             community policing in the Nordic countries. Journal of Scandinavian Studies
Authors’ contributions                                                                       in Criminology and Crime Prevention, 5(2), 205–219.
Ruifan Wang and Shuliang Ren completed the experiment and wrote the                     Hong, J. Y., & Jeon, J. Y. (2015). Influence of urban contexts on soundscape
paper. Jiaqi Zhang revised the paper. Yao Yao provided the idea and                          perceptions: A structural equation modeling approach. Landscape and Urban
funding, and revised the paper. Yu Wang completed the comparison                             Planning, 141, 78–87.
experiment and model. Qingfeng Guan revised the paper. The authors read                 Hu, C., et al. (2015). Vehicle color recognition with spatial pyramid deep learning.
and approved the final manuscript.                                                           IEEE Transactions on Intelligent Transportation Systems, 16(5), 2925–2934.
                                                                                        Hu, Y., & Han, Y. (2019). Identification of urban functional areas based on POI
                                                                                             data: A case study of the Guangzhou economic and technological
Funding
                                                                                             development zone. Sustainability, 11(5), 1385.
This work was supported by the National Key R&D Program of China (Grant
                                                                                        Ioffe, S. and Szegedy, C., 2015. Batch normalization: Accelerating deep network
No. 2019YFB2102903), the National Natural Science Foundation of China
                                                                                             training by reducing internal covariate shift. arXiv preprint arXiv:1502.03167.
(Grant No. 41801306 and 41671408) and the Natural Science Foundation of
Hubei Province (Grant No. 2017CFA041).                                                  Irwin, E. G., & Bockstael, N. E. (2007). The evolution of urban sprawl: Evidence of
                                                                                             spatial heterogeneity and increasing land fragmentation. Proceedings of the
                                                                                             National Academy of Sciences, 104(52), 20672–20677.
Availability of data and materials                                                      Jiao, L., et al. (2017). Deep fully convolutional network-based spatial distribution
All of the data and code involved in this study can be downloaded at                         prediction for hyperspectral image classification. IEEE Transactions on
https://doi.org/10.6084/m9.figshare.12552233.                                                Geoscience and Remote Sensing, 55(10), 5585–5599.
                                                                                        Kaufman, A. J., & Lohr, V. I. (2002). Does plant color affect emotional and
Competing interests                                                                          physiological responses to landscapes? In XXVI International Horticultural
No conflict of interest exists.                                                              Congress: Expanding Roles for Horticulture in Improving Human Well-Being and
                                                                                             Life Quality (pp. 229–233).
Received: 27 November 2020 Accepted: 1 February 2021                                    Kim, J., & Pavlovic, V. (2016). A shape-based approach for salient object detection using
                                                                                             deep learning. In European Conference on Computer Vision (pp. 455–470). Springer,
                                                                                             Cham.
References                                                                              Krizhevsky, A., Sutskever, I., & Hinton, G. E. (2012). Imagenet classification with
Abkar, M., et al. (2010). The role of urban green spaces in mood change.                     deep convolutional neural networks. Advances in Neural Information
     Australian Journal of Basic and Applied Sciences, 4(10), 5352–5361.                     Processing Systems, 25, 1097–1105.
Ang, R. P., & Huan, V. S. (2006). Relationship between academic stress and suicidal     Liu, X., et al. (2017a). Place-centric visual urban perception with deep multi-
     ideation: Testing for depression as a mediator using multiple regression.               instance regression. In Proceedings of the 25th ACM international conference
     Child Psychiatry and Human Development, 37(2), 133.                                     on multimedia (pp. 19–27).
Ashihara, Y. (1983). The aesthetic townscape. Cambridge: MIT Press.                     Liu, X., et al. (2017b). Classifying urban land use by integrating remote sensing
Badrinarayanan, V., Kendall, A., & Cipolla, R. (2017). Segnet: A deep convolutional          and social media data. International Journal of Geographical Information
     encoder-decoder architecture for image segmentation. IEEE Transactions on               Science, 31(8), 1675–1696.
     Pattern Analysis and Machine Intelligence, 39(12), 2481–2495.                      Liu, X., et al. (2018). Classifying high resolution remote sensing images by fine-
Been, V., et al. (2016). Preserving history or restricting development? The                  tuned VGG deep networks. In IEEE International Geoscience and Remote
     heterogeneous effects of historic districts on local housing markets in New             Sensing Symposium (IGARSS) (pp. 7137–7140).
     York City. Journal of Urban Economics, 92, 16–30.                                  Liu, Y., et al. (2015). Social sensing: A new approach to understanding our
Blaxland, M., Shang, X., & Fisher, K. R. (2014). Introduction: People oriented: A new        socioeconomic environments. Annals of the Association of American
     stage of social welfare development in China. Journal of Social Service                 Geographers, 105(3), 512–530.
     Research, 40(4), 508–519.                                                          Long, J., Shelhamer, E., & Darrell, T. (2015). Fully convolutional networks for
Bulat, A., & Tzimiropoulos, G. (2016). Human pose estimation via convolutional               semantic segmentation. In Proceedings of the IEEE conference on computer
     part heatmap regression. In European Conference on Computer Vision (pp.                 vision and pattern recognition (pp. 3431–343‘).
     717–732). Springer, Cham.                                                          Long, Y., & Liu, L. (2017). How green are the streets? An analysis for central areas
Cheng, L., et al. (2017). Use of tencent street view imagery for visual perception           of Chinese cities using Tencent street view. PLoS One, 12(2), e0171110.
     of streets. ISPRS International Journal of Geo-Information, 6(9), 265.             Lu, X., et al. (2017). Feature extraction and fusion using deep convolutional neural
Cordts, M., et al. (2016). The cityscapes dataset for semantic urban scene                   networks for face detection. Mathematical Problems in Engineering, 2017, 2017.
     understanding. In The IEEE Conference on Computer Vision and Pattern               Middel, A., et al. (2019). Urban form and composition of street canyons: A human-centric
     Recognition (CVPR) (pp. 3213–3223).                                                     big data and deep learning approach. Landscape and Urban Planning, 183, 122–132.
Deng, L., et al. (2017). CNN based semantic segmentation for urban traffic scenes       Monti, R. P., Tootoonian, S., & Cao, R. (2018). Avoiding degradation in deep feed-
     using fisheye camera. In IEEE Intelligent Vehicles Symposium (IV) (pp. 231–236).        forward networks by phasing out skip-connections. In International
Deng, Y., et al. (2020). Geographical transformations of urban sprawl: Exploring             Conference on Artificial Neural Networks (pp. 447–456). Springer, Cham.
     the spatial heterogeneity across cities in China 1992–2015. Cities, 105, 102415.   Naik, N., Raskar, R., & Hidalgo, C. E. S. A. (2016). Cities are physical too: Using
Dubey, A., et al. (2016). Deep learning the city: Quantifying urban perception at a          computer vision to measure the quality and impact of urban appearance.
     global scale. In European Conference on Computer Vision (pp. 196–212).                  American Economic Review, 106(5), 128–132.
     Springer, Cham.                                                                    Naik, N., et al. (2014). Streetscore-predicting the perceived safety of one million
Gunnarsson, B., et al. (2017). Effects of biodiversity and environment-related               streetscapes. In Proceedings of the IEEE conference on computer vision and
     attitude on perception of urban green space. Urban Ecosystem, 20(1), 37–49.             pattern recognition workshops (pp. 779–785).
Wang et al. Computational Urban Science (2021) 1:3 Page 13 of 13
Oetzel, J., et al. (2011). Creating an instrument to measure people's perception of Zhang, F., et al. (2019). Social sensing from street-level imagery: A case study in
community capacity in American Indian communities. Health Education & learning spatio-temporal urban mobility patterns. ISPRS Journal of
Behavior, 38(3), 301–310. Photogrammetry and Remote Sensing, 153, 48–58.
Ordonez, V., & Berg, T. L. (2014). Learning high-level judgments of urban Zhang, X., Du, S., & Wang, Q. (2017). Hierarchical semantic cognition for urban
perception. In European Conference on Computer Vision (pp. 494–510). functional zones with VHR satellite images and POI data. ISPRS Journal of
Springer, Cham. Photogrammetry and Remote Sensing, 132, 170–184.
Ozkan, U. Y. (2014). Assessment of visual landscape quality using IKONOS Zhou, B., et al. (2017). Scene parsing through ade20k dataset. In Proceedings of
imagery. Environmental Monitoring and Assessment, 186(7), 4067–4080. the IEEE conference on computer vision and pattern recognition (pp. 633–641).
Palczewska, A., et al. (2014). Interpreting random forest classification models Zhou, B., et al. (2019). Semantic understanding of scenes through the ade20k
using a feature contribution method. In Integration of Reusable Systems (pp. dataset. International Journal of Computer Vision, 127(3), 302–321.
193–218). Springer, Cham. Zhou, H., et al. (2016). Image semantic segmentation based on FCN-CRF model.
Piramanayagam, S., et al. (2016). Classification of remote sensed images using In 2016 International Conference on Image, Vision and Computing (ICIVC) (pp.
random forests and deep learning framework. International Society for Optics 9–14). IEEE, Portsmouth.
and Photonics, 10004, 100040L. Zhou, W., Pickett, S. T. A., & Cadenasso, M. L. (2017). Shifting concepts of urban
Porzi, L., et al. (2015). Predicting and understanding urban perception with spatial heterogeneity and their implications for sustainability. Landscape
convolutional neural networks. In Proceedings of the 23rd ACM international Ecology, 32(1), 15–30.
conference on multimedia (pp. 139–148).
Quercia, D., O'Hare, N. K., & Cramer, H. (2014). Aesthetic capital: What makes
London look beautiful, quiet, and happy? In Proceedings of the 17th ACM
Publisher’s Note
Springer Nature remains neutral with regard to jurisdictional claims in
conference on computer supported cooperative work & social computing (pp.
published maps and institutional affiliations.
945–955).
Sahiner, B., et al. (1996). Classification of mass and normal breast tissue: A
convolution neural network classifier with spatial domain and texture
images. IEEE Transactions on Medical Imaging, 15(5), 598–610.
Salesses, P., Schechtner, K., & Hidalgo, C. E. S. A. (2013). The collaborative image of
the city: Mapping the inequality of urban perception. PLoS One, 8(7), e68400.
Sampson, R. J. (2012). Great American city: Chicago and the enduring neighborhood
effect. University of Chicago Press.
Shin, H., et al. (2016). Deep convolutional neural networks for computer-aided
detection: CNN architectures, dataset characteristics and transfer learning.
IEEE Transactions on Medical Imaging, 35(5), 1285–1298.
Simonyan, K. and Zisserman, A., 2014. Very deep convolutional networks for
large-scale image recognition. arXiv preprint arXiv:1409.1556.
Sun, A., Chen, T., & Niu, R. (2016). Urbanization analysis in Wuhan area from 1991
to 2013 based on MESMA. In IEEE International Geoscience and Remote
Sensing Symposium (pp. 5473–5476).
Sun, Z., Li, F., & Huang, H. (2017). Large scale image classification based on CNN
and parallel SVM. In International conference on neural information processing
(pp. 545–555). Springer, Cham.
Wang, R., et al. (2019a). Using street view data and machine learning to assess
how perception of neighborhood safety influences urban residents’ mental
health. Health & Place, 59, 102186.
Wang, R., et al. (2019b). Perceptions of built environment and health outcomes
for older Chinese in Beijing: A big data approach with street view images
and deep learning technique. Computers, Environment and Urban Systems, 78,
101386.
Weber, R., Schnier, J. O. R., & Jacobsen, T. (2008). Aesthetics of streetscapes:
Influence of fundamental properties on aesthetic judgments of urban space.
Perceptual and Motor Skills, 106(1), 128–146.
Yao, Y., et al. (2018). Mapping fine-scale urban housing prices by fusing remotely
sensed imagery and social media data. Transactions in GIS, 22(2), 561–581.
Yao, Y., et al. (2019). A human-machine adversarial scoring framework for urban
perception assessment using street-view images. International Journal of
Geographical Information Science, 33(12), 2363–2384.
Yuan, J., Zheng, Y., & Xie, X. (2012). Discovering regions of different functions in a
city using human mobility and POIs. In Proceedings of the 18th ACM SIGKDD
international conference on knowledge discovery and data mining (pp. 186–
194).
Zamani Joharestani, M., et al. (2019). PM2. 5 prediction based on random forest,
XGBoost, and deep learning using multisource remote sensing data.
Atmosphere, 10(7), 373.
Zhai, Y., et al. (2020). Simulating urban land use change by integrating a
convolutional neural network with vector-based cellular automata.
International Journal of Geographical Information Science, 34(7), 1475–1499.
Zhang, F., et al. (2018a). Representing place locales using scene elements.
Computers, Environment and Urban Systems, 71, 153–164.
Zhang, F., et al. (2018b). Framework for virtual cognitive experiment in virtual
geographic environments. ISPRS International Journal of Geo-Information, 7(1),
36.
Zhang, F., et al. (2018c). Measuring human perceptions of a large-scale urban
region using machine learning. Landscape and Urban Planning, 180, 148–160.You can also read