Yttrium-90 quantitative phantom study using digital photon counting PET
←
→
Page content transcription
If your browser does not render page correctly, please read the page content below
Labour et al. EJNMMI Physics     (2021) 8:56
https://doi.org/10.1186/s40658-021-00402-6
                                                                                                                                     EJNMMI Physics

 ORIGINAL RESEA RCH                                                                                                                            Open Access

Yttrium-90 quantitative phantom study
using digital photon counting PET
Joey Labour1,2*† , Philippe Boissard2† , Thomas Baudier1,2 , Fouzi Khayi2 , David Kryza2,3 , Pascale Veyrat
Durebex2 , Sandrine Parisse-Di Martino2 , Thomas Mognetti2 , David Sarrut1,2† and Jean-Noël Badel1,2†

*Correspondence:
labour@creatis.insa-lyon.fr             Abstract
† Joey Labour, Philippe Boissard,
                                        Background: PET imaging of 90 Y-microsphere distribution following
David Sarrut and Jean-Noël Badel
contributed equally to this work.       radioembolisation is challenging due to the count-starved statistics from the low
1
  CREATIS; CNRS UMR 5220; INSERM        branching ratio of e+ /e− pair production during 90 Y decay. PET systems using silicon
U 1044; Université de Lyon;
INSA-Lyon; Université Lyon 1, Lyon,
                                        photo-multipliers have shown better 90 Y image quality compared to conventional
France                                  photo-multiplier tubes. The main goal of the present study was to evaluate
2
  Centre de lutte contre le cancer      reconstruction parameters for different phantom configurations and varying listmode
Léon Bérard, Lyon, France
Full list of author information is      acquisition lengths to improve quantitative accuracy in 90 Y dosimetry, using digital
available at the end of the article     photon counting PET/CT.
                                        Methods: Quantitative PET and dosimetry accuracy were evaluated using two
                                        uniform cylindrical phantoms specific for PET calibration validation. A third body
                                        phantom with a 9:1 hot sphere-to-background ratio was scanned at different activity
                                        concentrations of 90 Y. Reconstructions were performed using OSEM algorithm with
                                        varying parameters. Time-of-flight and point-spread function modellings were
                                        included in all reconstructions. Absorbed dose calculations were carried out using
                                        voxel S-values convolution and were compared to reference Monte Carlo simulations.
                                        Dose-volume histograms and root-mean-square deviations were used to evaluate
                                        reconstruction parameter sets. Using listmode data, phantom and patient datasets
                                        were rebinned into various lengths of time to assess the influence of count statistics on
                                        the calculation of absorbed dose. Comparisons between the local energy deposition
                                        method and the absorbed dose calculations were performed.
                                        Results: Using a 2-mm full width at half maximum post-reconstruction Gaussian filter,
                                        the dosimetric accuracy was found to be similar to that found with no filter applied but
                                        also reduced noise. Larger filter sizes should not be used. An acquisition length of more
                                        than 10 min/bed reduces image noise but has no significant impact in the
                                        quantification of phantom or patient data for the digital photon counting PET.
                                        3 iterations with 10 subsets were found suitable for large spheres whereas 1 iteration
                                        with 30 subsets could improve dosimetry for smaller spheres.
                                        Conclusion: The best choice of the combination of iterations and subsets depends on
                                        the size of the spheres. However, one should be careful on this choice, depending on
                                        (Continued on next page)

                                      © The Author(s). 2021 Open Access This article is licensed under a Creative Commons Attribution 4.0 International License,
                                      which permits use, sharing, adaptation, distribution and reproduction in any medium or format, as long as you give appropriate
                                      credit to the original author(s) and the source, provide a link to the Creative Commons licence, and indicate if changes were
                                      made. The images or other third party material in this article are included in the article’s Creative Commons licence, unless
                                      indicated otherwise in a credit line to the material. If material is not included in the article’s Creative Commons licence and your
                                      intended use is not permitted by statutory regulation or exceeds the permitted use, you will need to obtain permission directly
                                      from the copyright holder. To view a copy of this licence, visit http://creativecommons.org/licenses/by/4.0/.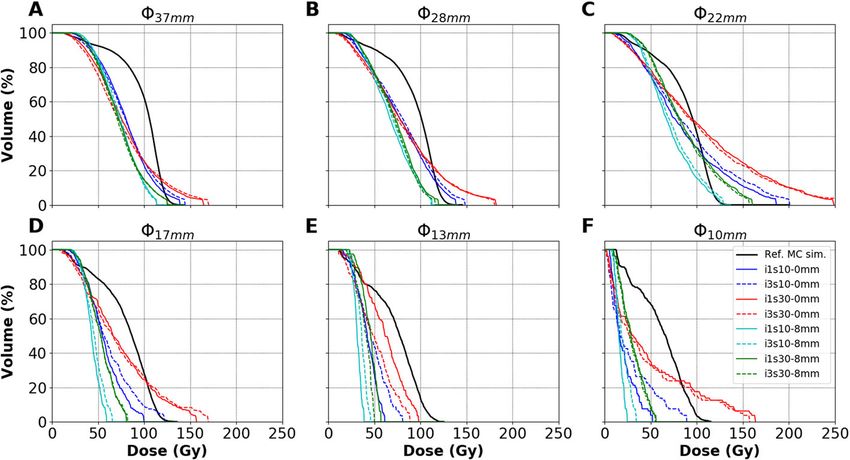
Labour et al. EJNMMI Physics     (2021) 8:56                                                                    Page 2 of 24

                    (Continued from previous page)
                    the imaging conditions and setup. This study can be useful in this choice for future
                    studies for more accurate 90 Y post-dosimetry using a digital photon counting PET/CT.
                    Keywords: Radioembolisation, Digital photon counting, PET, Listmode reconstruction,
                    Dosimetry, Monte Carlo simulation

                  Background
                  Liver radioembolisation or selective internal radiation therapy (SIRT) is an intra-arterial
                  method used in clinical practice to treat unresectable hepatic malignancies [1, 2]. Cur-
                  rently, SIRT can be performed either with 90 Y or 166 Ho microspheres. During 90 Y-SIRT,
                  the high energy β − emitter 90 Y particles which are encapsulated-in glass or labelled
                  to resin microspheres are administered through selected branches of the hepatic artery
                  which feed the tumours. This method ensures a regional biodistribution of the 90 Y-
                  microspheres delivering a highly localised absorbed dose to the perfused regions, sparing
                  nearby organs at risk and healthy tissues with the advantage of a negligible radiation bur-
                  den to both non-embolized portions and extra-hepatic tissues. The 90 Y-SIRT method is
                  widely used owing to its clinical efficacy and relative safety [1–5].
                     At present, the prediction of the biodistribution of 90 Y-microspheres is generally per-
                  formed using 99m Tc-labelled macro-aggregated albumin (MAA), prior to treatment.
                  However, 99m Tc-MAA biodistribution does not always match with post-therapy 90 Y-
                  microspheres distribution [6–10] and an assessment of the radionuclide biodistribution
                  must be performed following treatment either by single-photon emission computed
                  tomography (SPECT) or positron emission tomography (PET). This assessment is mainly
                  done to detect any possible extrahepatic deposition of microspheres and determine the
                  intrahepatic microsphere distribution over the perfused tumorous and non-tumorous
                  liver tissue.
                     90 Y SPECT imaging exploits bremsstrahlung photons, with various published energy

                  windows [11], and has been used for post-SIRT treatment evaluation [12]. However,
                  SPECT suffers from scatter, low spatial resolution and challenging quantitative analysis.
                  Alternatively, 90 Y PET imaging exploits a minor positron decay [13–18]. In 2004, Nickles
                  et al. [19] first exploited this property to show the distribution of the regional absorbed
                  dose delivered by 90 Y therapies using PET, although difficult and time-consuming due
                  to the count-starved statistics for annihilation photons. Activity distribution assessment
                  after 90 Y-SIRT was proved feasible in 2010 by Lhommel et al. [20, 21] with the help of
                  time-of-flight (ToF) information added on PET/CT systems. Other studies followed and
                  showed that ToF PET compared to non-ToF PET provided improved recovery in recon-
                  structed quantitative data [20–26], outperforming at the same time 90 Y bremsstrahlung
                  SPECT [12, 22]. In 2007, Selwyn et al. [17] verified the branching ratio related to e+ /e−
                  pair production during 90 Y decay to be (31.86±0.47)×10−6 , following de-excitation from
                  the 0+ excited state of 90 Zr. The latest published value was from Dryák and Šolc [18] in
                  2020, who measured the branching ratio to be (32.6±0.4)×10−6 .
                     The recent digital PET systems are equipped with silicon photo-multiplier (SiPM) tech-
                  nology that replaces conventional photo-multiplier tubes (PMT). They allow enhanced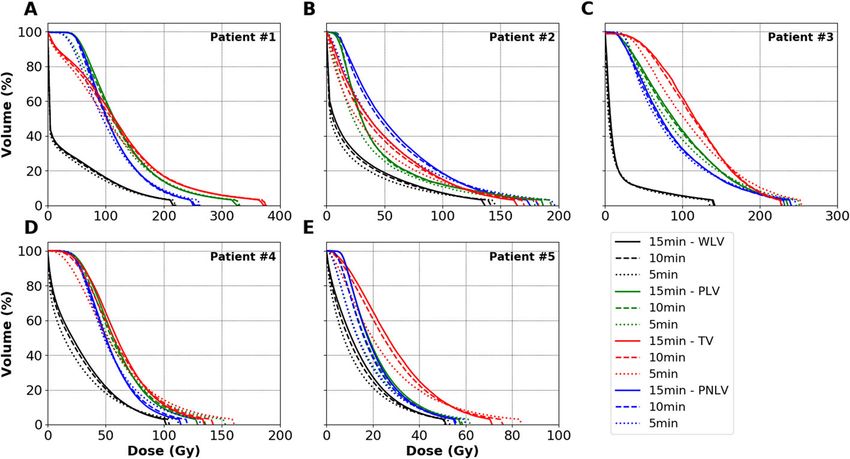
Labour et al. EJNMMI Physics   (2021) 8:56                                                                      Page 3 of 24

                  ToF capability and coincidence timing resolution owing to faster and more compact elec-
                  tronics [27, 28]. They demonstrate better performances for sensitivity, spatial resolution,
                  count rates, and overall image quality [29–34].
                     Reviewing previous studies, assessments for 90 Y imaging were performed largely using
                  criteria based on NEMA guidelines [35] and by evaluating detectability for diagnos-
                  tic purposes rather than dosimetry calculations. In 2013, Willowson et al. [36] and
                  Carlier et al. [23] showed that with the help of ToF information, higher detectability was
                  reached with a small number of Ordered Subsets Expectation Maximisation (OSEM) iter-
                  ations on Siemens Biograph mCT systems. Few studies evaluated OSEM reconstruction
                  parameters using absorbed dose calculation tools. In 2014, Pasciak et al. [37] based on
                  previous findings [23, 36] found that an additional 4.5-mm full width at half maximum
                  (FWHM) point-spread function (PSF) modelling improved accuracy in absorbed dose
                  distributions using dose-volume histograms (DVHs). In 2018, Siman et al. [38] studied a
                  GE D690 PET/CT and found that 3 iterations with 12 subsets with additional PSF mod-
                  elling and a 5.2 mm FWHM post-reconstruction Gaussian filter size provided the least
                  root-mean-square deviation (RMSD) between their experimental and reference DVH.
                     This study focuses on the use of a digital photon counting (DPC)-PET for 90 Y quan-
                  tification for dosimetry purposes following SIRT. We considered the fully digital Philips
                  VEREOS PET SiPM system, with a 1:1 coupling between the lutetium–yttrium oxy-
                  orthosilicate (LYSO) scintillator crystals and the SiPMs [29], showing improved timing
                  resolution and signal-to-noise ratio (SNR) compared to conventional PMT-PET [39].
                  Wright et al. showed that DPC-PET detection of annihilation photons following 90 Y-SIRT
                  is feasible, demonstrating concordant visualisation with improved 90 Y-to-background
                  contrast of microsphere distribution with the DPC-PET compared to SPECT and PMT-
                  PET systems [40–42].
                     Previous studies [23, 36–38] evaluated OSEM reconstruction parameters for PMT-PET
                  systems with ToF resolutions around 550 ps. Therefore, suggested parameters in literature
                  might not be suitable for the DPC-PET with a ToF resolution around 300 ps [29, 30,
                  32], due to the dependence of the convergence of OSEM-based algorithms on the ToF
                  information [39]. Moreover, implementations of OSEM-based algorithms differ within
                  systems and the OSEM algorithm implemented in the DPC-PET is based on listmode
                  data, instead of sinograms, and use spherically symmetric volume elements to model the
                  image, instead of voxels [43].
                     In this study, we investigated the accuracy of 90 Y DPC-PET by evaluating the effect of
                  OSEM reconstruction parameters and acquisition duration on estimating the absorbed
                  dose distribution based on DVHs [44], as proposed by Siman et al. [38].

                  Materials and methods
                  In order to evaluate the accuracy of image-based absorbed dose estimations from 90 Y
                  DPC-PET/CT, 3 phantoms were selected and imaged using a range of parameters.
                  Acquired PET images were used as input activity maps to compute the absorbed dose dis-
                  tributions and DVHs. Obtained image-based distributions were compared to reference
                  absorbed dose distributions computed with Monte Carlo simulations and the impact of
                  several parameters, including volumes of interest (VOIs), activity levels, reconstruction
                  parameters and acquisition lengths, were evaluated. The following subsections describe
                  (1) the phantoms, (2) the acquisition and reconstruction parameters, (3) the algorithms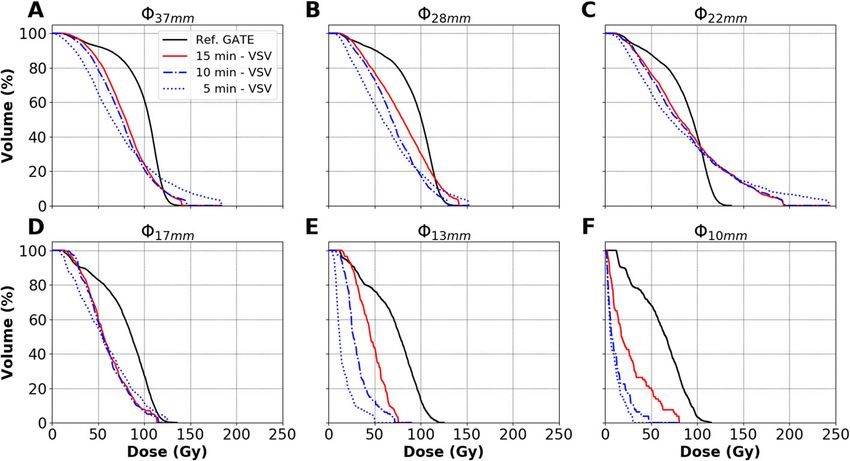
Labour et al. EJNMMI Physics      (2021) 8:56                                                                                  Page 4 of 24

                  used to compute the absorbed dose, (4) the figures of merit and (5) the clinical applica-
                  tion using several patient image datasets acquired on the same DPC-PET/CT following
                  90 Y-SIRT treatment.

                  Phantoms and activities
                  A 6800-mL uniform cylindrical phantom (Ph1) (diameter  21.6 cm; height h 18.6 cm)
                  and a 5950-mL cylindrical phantom ( 19.6 cm; h 19.7 cm) with a 300-mL cylindrical fil-
                  lable insert ( 4.5 cm; h 18.7 cm) (Ph2) were used for validation of quantitative recovered
                  data following PET calibration for 90 Y. All materials of Ph1 and Ph2 are made of PMMA.
                  PET/CT fusion images of Ph1 and Ph2 are depicted in Fig. 1A and B, respectively.
                    A NEMA IEC body phantom (Ph3) in Fig. 1C was then used for quantitative measure-
                  ments for dosimetry evaluations, consisting of a background compartment of approxi-
                  mately 9700 mL, a lung insert and an insert with six fillable spheres of diameters, 10, 13,
                  17, 22, 28 and 37 mm. The corresponding nominal volumes of the spheres ranged between
                  0.52 and 26.52 mL. The phantoms used in this study allow for quantitative activity recov-
                  ery (or activity concentration recovery) and dosimetry evaluation in objects of different
                  sizes.
                    Prior to phantom preparations, 100 μL of diethylenetriaminepentaacetic acid (DTPA)
                  with a concentration of 5 mg.mL−1 was added to two vials, each containing 2850 MBq
                  of 90 YCl3 in 1.03 mL. This was done to prevent the known effect of adsorption of 90 YCl3

                    Fig. 1 Axial slices of PET/CT images of A Ph1, B Ph2 and C Ph3. D Geometry of Ph3 modelled in GATE. E, F
                    Examples of segmentation of liver VOIs for patients #2 and #3, respectively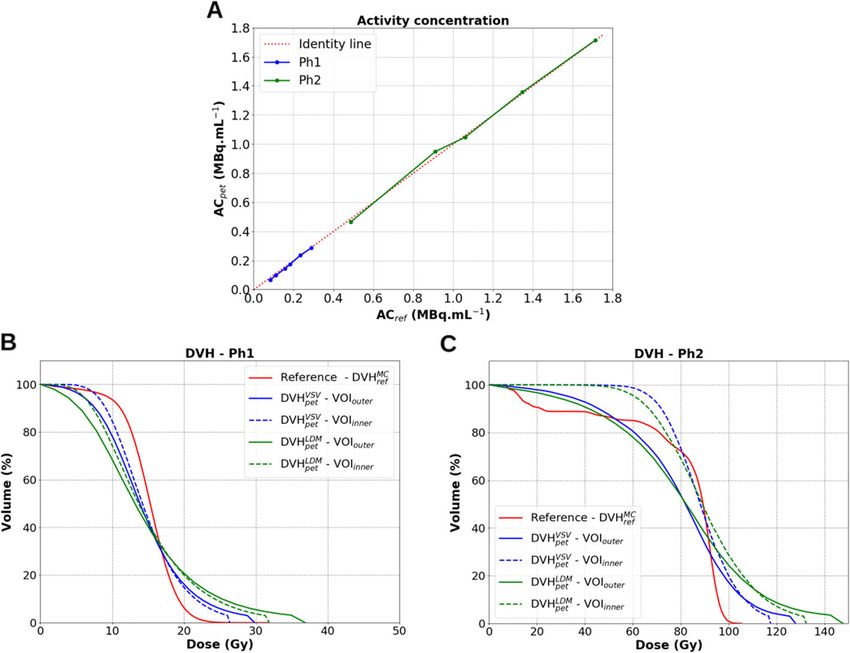
Labour et al. EJNMMI Physics   (2021) 8:56                                                                       Page 5 of 24

                  on the inner PMMA walls of plastic phantoms which may negatively affect PET quantita-
                  tive imaging studies [45]. Activities were measured using an Easypharma HE Lemer Pax
                  activimeter calibrated for 90 Y under national standards. Prepared syringes used for filling
                  Ph1, Ph2 and Ph3 were flushed several times to transfer the maximum amount of activity
                  into the phantom volumes. All syringes were also measured for residual activity to allow
                  for the calculation of the net transferred activity.

                  Cylindrical phantoms, Ph1 and Ph2. Ph1 was filled with 2130 MBq of 90 YCl3 in water.
                  The 300-mL water insert in Ph2 was filled with 540 MBq of 90 YCl3 and placed in a cold
                  water background. The reference initial activity concentrations at injection (ACref ,init )
                  were 0.31 MBq mL−1 and 1.83 MBq mL−1 , which are the total net injected activity
                  (Aref ,init ) in each region divided by the volume of the considered region, for Ph1 and the
                  insert in Ph2, respectively.

                  NEMA IEC body phantom, Ph3. A stock solution was prepared for filling the spheres
                  by combining 225 MBq of 90 YCl3 with 100 mL of water. An activity of 2355 MBq of 90 YCl3
                  was added to the 9700 mL water background. The ACref ,init in the spheres and back-
                  ground compartment were 2.25 MBq mL−1 and 0.24 MBq mL−1 at injection, respectively.
                  A sphere-to-background ratio (SBR) of 9:1 was obtained, similar to that in the QUEST
                  study [45].

                  Image acquisition
                  Image acquisitions for all phantoms were performed over six consecutive days (two half
                  lives of 90 Y) to analyse the response of the PET with decreasing activity concentrations.
                  Markers were placed to allow for reproducible placement of the phantoms between daily
                  scans. Data acquisitions were performed in listmode format. The acquisition lengths were
                  30 min per bed (min/bed) for both Ph1 and Ph2 and 15 min/bed for Ph3.

                  Image reconstruction
                  All image reconstructions were performed with ToF information and using relaxed
                  List Mode Ordered Subset Expectation Maximisation (LMOSEM) algorithm [43] imple-
                  mented on Philips PET systems, with isotropic voxels of 2 ×2 ×2 mm3 . They were
                  post-treated with a regularised version of the Richardson-Lucy algorithm for resolution
                  recovery [46, 47] with the default recommended parameters of the PSF modelling (1
                  iteration with a 6-mm regularisation kernel) which provide reasonable contrast recovery
                  without noticeable Gibbs artefacts [48].
                    The listmode data for Ph1 and Ph2 were reconstructed with Recon1, the default clin-
                  ical setup recommended by Philips; see Table 1. Several parameters were compared
                  for Ph3, also listed in Table 1. The number of iterations were fixed to 1, 2 or 3 to
                  limit image noise amplification. The number of subsets were varied with 10, 20 or 30
                  subsets to cover the range of suggested number of subsets used in previous studies
                  [23, 36–38, 45, 49–62]. Post-reconstruction Gaussian filters of varying sizes were applied,
                  between 0 (no filter) and 8 mm FWHM with increments of 2 mm. In total, 45 com-
                  binations for reconstructions were compared for Ph3. Reconstruction parameter sets
                  suggested in the literature were also tested, Recon2 [38] and Recon3 [23, 36, 37]. Recon-
                  struction parameters are denoted i3s5-2mm for example for 3 iterations with 5 subsets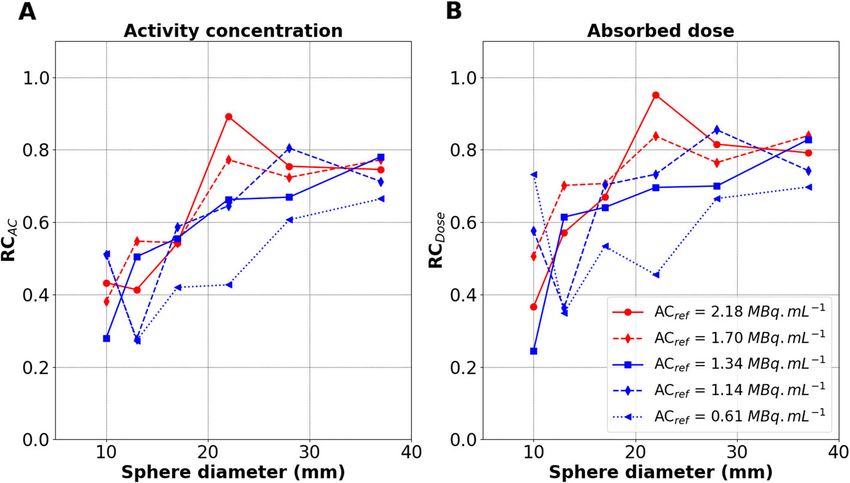
Labour et al. EJNMMI Physics            (2021) 8:56                                                                    Page 6 of 24

                  Table 1 Parameter sets used for listmode data reconstructions
                  Reconstruction                   Iterations             Subsets        Gaussian filter   PSF   ToF
                  parameter set                                                          (mm @ FWHM)
                  Various*                         1, 2 or 3              10, 20 or 30   0, 2, 4, 6 or 8   Yes   Yes
                  Recon1                           3                      5              2                 Yes   Yes
                  Recon2                           3                      12             5.2               Yes   Yes
                  Recon3                           1                      21             5                 Yes   Yes
                  *
                      45 possible combinations of parameters for evaluation.

                  and a 2-mm FWHM post-reconstruction Gaussian filter, with implemented PSF and ToF
                  modellings.
                    Finally, thanks to listmode data, datasets for Ph3 were rebinned into various acquisition
                  lengths, from 5 to 15 min/bed, in order to evaluate the impact of the counts statistics on
                  dosimetry and investigate if shorter acquisitions might be used.

                  Absorbed dose computation
                  Monte Carlo simulations were used to estimate the reference absorbed dose distributions
                  in the 3 phantoms and inserts therein, according to the known ACref ,init in each region
                  at injection. These reference absorbed dose distributions were compared to the ones that
                  can be estimated from the 90 Y PET reconstructed images. The image-based absorbed
                  dose computations were performed first with the voxel S-values (VSV) kernel-based con-
                  volution method for the various reconstruction parameters applied (see Table 1). The
                  local deposition method (LDM) was also used for comparison purposes.

                  Reference absorbed dose. Monte Carlo simulations were performed with the Geant4
                  Application for Tomographic Emission (GATE) platform 9.0 [63, 64] using GEANT4
                  10.5 [65]. The geometry, dimensions and material composition of each phantom were
                  modelled. The modelled geometry for Ph3 is shown in Fig. 1D. The physics list named
                  emstandard_opt4 was used1 . It contains the GEANT4 most accurate standard and
                  low-energy models for electromagnetic processes recommended for medical applications
                  [66]. Range production cuts were set to 1 mm for electrons and photons in the whole
                  geometry. In GEANT4, it means that secondary particles are only created and tracked
                  when their expected range in the current material is larger than this distance. No vari-
                  ance reduction technique was used. The β − radioactive sources of 90 Y were simulated by
                  homogeneous generic ion sources in each sphere and the background compartment. The
                  absorbed doses were scored with 2 × 2 × 2 mm3 voxels sizes. The number of primary par-
                  ticles was adapted for each phantom region in a single simulation for an entire phantom
                  according to the relative experimental ACref ,init in each region, such as to reach a statis-
                  tical Type-A uncertainty of lower than 1% on the estimated mean absorbed dose values.
                  This corresponds for example to about 6 × 10⁵ primary generated particles for the small-
                  est 10 mm sphere in Ph3. Final absorbed dose values were scaled according to the known
                  accumulated activities in all injected regions.

                  Image-based absorbed dose. Absorbed dose distributions were first computed from
                  the PET images with DOSIsoft® (Cachan, France) with the VSV dose kernel convolution

                  1 See   https://geant4.web.cern.ch/node/1731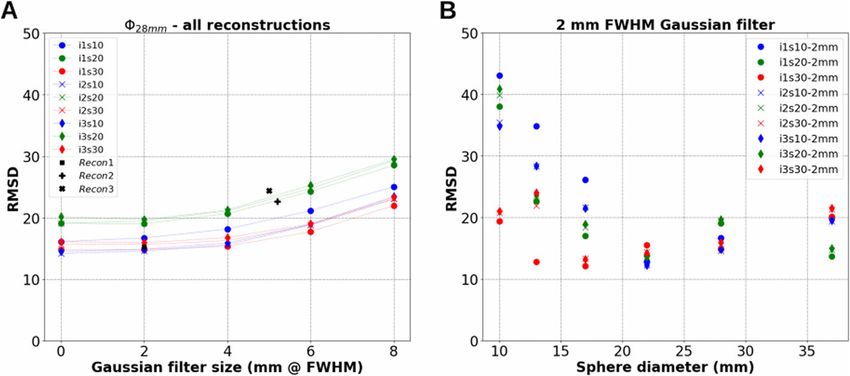
Labour et al. EJNMMI Physics   (2021) 8:56                                                                          Page 7 of 24

                  algorithm following the MIRD formalism [67–69]. It is considered as a compromise
                  between more simplified calculation models (such as the LDM multiplicative approach)
                  and Monte Carlo calculations, allowing to achieve accurate absorbed dose distribu-
                  tion information in clinic [68–72]. Calculations were also performed using LDM for
                  comparison purposes.

                  Partition model. Mean absorbed dose estimations were also carried out with the sim-
                  plified MIRD formalism (DMIRD ) for 90 Y, using the partition model [73], according to:

                                  Aref ,init (GBq)
                        DMIRD =                    × 49.67                                                    (1)
                                      M(kg)
                  where M is the mass of each phantom region injected with Aref ,init , respectively.

                  Dosimetry-based figures of merit
                  For Ph1 and the filled insert in Ph2, VOIs were defined using the co-registered CT to PET
                  images, using at first the exact complete internal dimensions of intended VOIs, denoted
                  VOIouter , and secondly using reduced dimensions to avoid edge partial volume effects
                  (PVE), denoted VOIinner . For Ph3, spherical VOIs were defined for the 6 spheres using
                  the exact internal diameter of each sphere on the CT images. The DVH of each VOI was
                  computed as suggested in [38].

                  DVH and RMSD
                  The reference Monte Carlo, image-based VSV convolution and image-based LDM DVHs
                                   MC , DVH VSV and DVH LDM , respectively. For each parameter set, r, used
                  are denoted DVHref        pet          pet
                  for image reconstruction and sphere size, , in Ph3, differences between the absorbed
                  dose distributions using VSV convolution were evaluated by the RMSD between their
                                  MC and DVH VSV , see Eq. 2.
                  respective DVHref ,          pet,

                                             N−1
                                             i=0 (DVHref ,,i   − DVHpet, ,r,i )
                                                     MC              VSV          2
                        RMSD,r =                                                                             (2)
                                                           N
                  where N is the total number of points in which the absorbed dose-axes of the DVHs are
                  sampled.
                    Comparisons using RMSD as in Eq. 2 were also performed between different DVHs
                  obtained by varying acquisition lengths, e.g. between a 15- and a 10-min/bed acquisitions
                  for Ph3.

                  Dmean and D50%
                                                           MC , DVH LDM and DVH VSV were performed
                  For all phantoms, comparisons between DVHref     pet         pet
                                                                                                MC      VSV
                  using differences in the mean absorbed doses, Dmean . Dmean is denoted as Dref , Dpet and
                    LDM
                  Dpet for the reference Monte Carlo simulations, VSV convolution and LDM, respec-
                  tively. Similar comparisons were made using the absorbed doses at 50% volume, D50% ,
                  denoted DMC            VSV          LDM
                             ref ,50% , Dpet,50% and Dpet,50% for each corresponding calculation method.

                  RCAC and RCDose
                  In addition, instead of the NEMA contrast recovery coefficient (CRC) definition [35] that
                  aims at lesion detection rather than absorbed dose estimation, we used the mean activity
Labour et al. EJNMMI Physics (2021) 8:56 Page 8 of 24
concentration recovery coefficient (RCAC ) and the mean absorbed dose recovery coeffi-
cient (RCDose ) using VSV convolution for quantitative analysis with decreasing activity
concentrations, see Eqs. 3 and 4.
ACpet,
RCAC, = (3)
ACref ,
VSV
Dpet,
RCDose, = MC
(4)
Dref ,
where for each , ACpet, is the mean activity concentration measured from recon-
structed PET images and ACref , is the reference activity concentration at the start of
each acquisition.
Clinical application
The dosimetric impact of reducing PET acquisition duration was investigated on five
patients treated by 90 Y-SIRT in the local hospital; see Table 2. The initial acquisition
length was 15 min/bed position. Listmode datasets were used to artificially decrease the
acquisition length down to 10 and 5 min/bed position during the reconstruction step.
Each patient’s listmode data was reconstructed using the reconstruction parameters cho-
sen following the evaluation using DVH and RMSD on Ph3 (see results in “Comparison
using RMSD” section, paragraph Choice of reconstruction parameter set).
For all considered patients, different VOIs were delineated by an experienced clinician
following the local hospital protocol, including (1) whole liver volume (WLV), (2) per-
fused liver volume (PLV), (3) tumour volume (TV) and (4) perfused normal liver volume
(PNLV). 3D segmentations were performed using the DOSIsoft® software and the regis-
tered CT and PET images. The WLV and TV were manually segmented using the CT
images. Only the largest visible lesion on the CT was selected per patient as the TV for
illustration in this study. The PLV was delineated using a threshold of 5% of the maximum
activity in the liver on the PET images. The PNLV was considered as the subtraction of
the TV from the PLV.
Figure 1E and F depict axial slices of liver VOI segmentations for patients #2 and #3,
respectively. DVH analysis was performed on the different VOIs, using the VSV convolu-
tion and LDM algorithms implemented in DOSIsoft®. The metrics used for comparison
are the Dmean and D50% as in phantoms, as well as the absorbed doses at 2% volume, D2% ,
denoted DVSV LDM
pet,2% and Dpet,2% for VSV convolution and LDM, respectively.
Table 2 Patient characteristics
Patient Sex, Tumour Microsphere Injected 90 Y Treatment WLV-PLV-TV
Age type material activity (GBq) approach (cm3 -cm3 -cm3 )
#1 M, 65 HCC Glass 2.463 Lobar 2470-635-365
#2 F, 92 mCRC Resin 0.716 Segmental 870-330-380
#3 M, 67 mCRC Resin 0.800 Lobar 1010-127-50
#4 F, 16 FLC Resin 1.752 Whole liver 2900-1020-70
#5 F, 67 mCRC Resin 1.479 Whole liver 4240-2610-230
HCC hepatocellular carcinoma, FLC fibrolamellar carcinoma, mCRC hepatic metastases from colorectal cancerLabour et al. EJNMMI Physics (2021) 8:56 Page 9 of 24
Results
Cylindrical phantoms Ph1 and Ph2
The first test was a sanity check to evaluate the PET response. Figure 2A depicts the
measured mean activity concentrations from reconstructed PET images, ACpet , versus
ACref , for both Ph1 and Ph2 using VOIouter (the exact internal dimensions of the VOI).
ACref ranged from 0.08 to 0.29 MBq mL−1 for Ph1, and from 0.49 to 1.71 MBq mL−1 for
Ph2.
On the first imaging day (highest ACref ), relative percentage differences between ACpet
and ACref were −1.1% and +0.1% for Ph1 at 0.29 MBq mL−1 and Ph2 at 1.71 MBq mL−1 ,
respectively. The maximum relative percentage differences obtained over the range of
activity concentrations studied were −19.6% and −4.5% for Ph1 at 0.08 MBq mL−1 and
Ph2 at 0.49 MBq mL−1 , corresponding to an absolute difference of −0.02 MBq mL−1 for
both Ph1 and Ph2 at the reported ACref , respectively.
Figure 2B and C depict the calculated DVHs for Ph1 and Ph2, respectively, accord-
ing to the computation methods used: DVHref MC (reference absorbed dose), DVH VSV and
pet
DVHpetLDM (PET image-based absorbed doses). The obtained DVHs illustrate the loss of
accuracy brought by the use of images in the calculation of absorbed dose distributions.
DVHs calculated with VOIouter regions suffer from edge PVE effects compared to the
ones based on VOIinner regions for the known geometries. LDM compared to VSV con-
volution seems to favour the amplification of the maximum absorbed dose (Dmax ) to the
detriment of intermediate ones. Table 3 provides the Dmean and D50% for both phantoms
Fig. 2 Quantitative accuracy of 90 Y acquisitions for image reconstructions with Recon1. A ACpet against ACref
for both Ph1 and Ph2. B, C Comparisons of DVHpet VSV (blue lines) and DVHLDM (green lines) to DVHMC (red lines)
pet ref
for Ph1 at ACref = 0.29 MBq mL−1 and Ph2 at ACref = 1.71 MBq mL−1 , respectivelyLabour et al. EJNMMI Physics (2021) 8:56 Page 10 of 24
Table 3 Comparison of absorbed dose calculation methods through the Dmean and D50% for Ph1 at
0.29 MBq mL−1 and Ph2 at 1.71 MBq mL−1 , for both VOIouter and VOIinner . Reconstructions were
performed using Recon1
Calculation Ph1VOI,inner Ph1VOI,outer Ph2VOI,inner Ph1VOI,outer
method Dmean D50% Dmean D50% Dmean D50% Dmean D50%
Ref. MC (Gy) 15.1 15.2 15.1 15.2 83.7 89.2 83.7 89.2
VSV conv. (Gy) 14.9 14.2 14.7 13.9 88.8 88.1 79.9 81.9
LDM (Gy) 15.0 13.7 14.8 13.1 90.5 89.0 82.7 82.2
Percent diff. (%) −1.3 −6.6 −2.6 −8.6 +6.1 −1.3 −4.5 −8.2
MC vs VSV
Percent diff. (%) −0.7 −9.9 −2.6 −13.8 +8.1 −0.2 −1.1 −7.8
MC vs LDM
computed with each absorbed dose calculation method. Their percentage differences to
the reference Monte Carlo simulations are also provided.
NEMA IEC body phantom Ph3
In this section, we proceed in the comparison of different reconstruction parameters for
Ph3 using DVHpet VSV and DVH MC and their RMSD at the imaging point where AC
ref ref was
equal to 2.18 MBq mL−1 (ACref ,init was 2.25 MBq mL−1 ). We also evaluate the effect
of acquisition length on absorbed dose distributions. The response of the PET is then
evaluated using the RCAC and RCDose for different ACref over two 90 Y radioactive periods
following phantom preparation. Comparisons using DVHpet LDM are also reported.
VSV
Evaluation using DVHpet
In total, 270 image-based DVHpetVSV (45 reconstruction parameter sets described in “Image
reconstruction” section for the 6 spheres) have been computed, and 6 reference DVHref MC ,
corresponding to each sphere, have been simulated. For each sphere and each reconstruc-
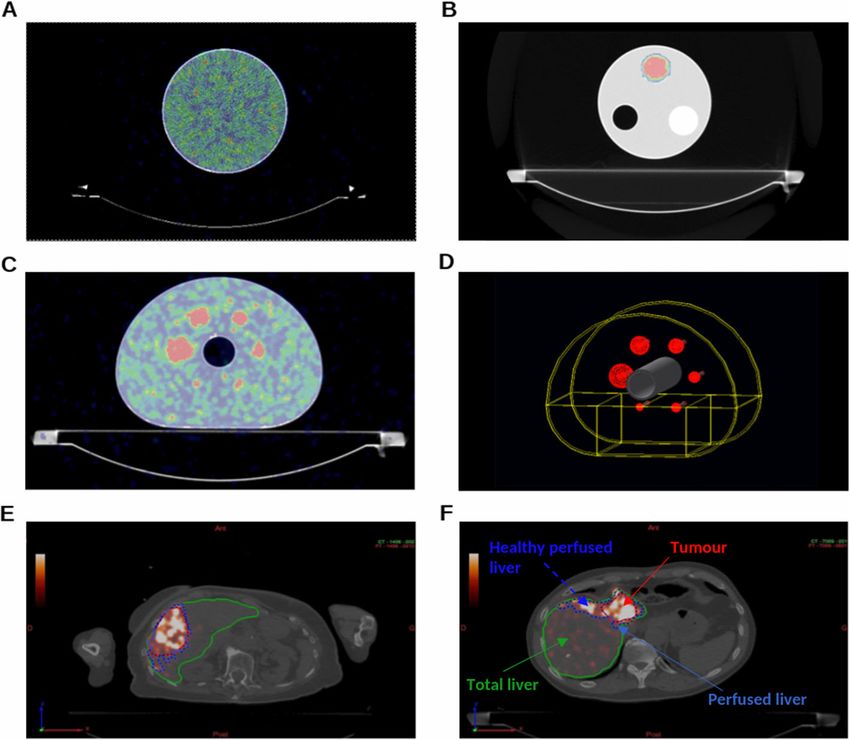
tion, the DVHpetVSV has been compared to the DVH MC . Figure 3 depicts the simulated
ref
DVHref MC (black curves) for each sphere and the DVH VSV for 8 reconstructions per sphere
pet
(only extremes are depicted: 1 and 3 iterations, 10 and 30 subsets, 0 and 8 mm FWHM
filter sizes).
Varying post-reconstruction Gaussian filter. As expected for all spheres, increasing
VSV , e.g. between i1s30-0mm and i1s30-8mm,
the filter size reduced the Dmax of the DVHpet
as seen in Fig. 3. It could be observed that too large a filter could not be suitable for
dosimetry, specially with decreasing sphere sizes where the area under the curve can be
significantly reduced (comparing cyan and green DVHpet VSV in Fig. 3D–F).
Varying subsets. As expected, increasing the number of subsets led to an increase in the
Dmax of the DVHpet VSV for all spheres, e.g. between i3s10-0mm and i3s30-0mm, as seen
in Fig. 3. For the largest 28 and 37 mm spheres, 30 iterations compared to 10 iterations
favoured noise amplification to the detriment of intermediate absorbed doses (comparing
red and blue DVHpet VSV ).
Varying iterations. The relationship in varying the number of iterations was less clear
and intuitive than with the number of post-reconstruction filter or subsets. For spheresLabour et al. EJNMMI Physics (2021) 8:56 Page 11 of 24
VSV for 8 different reconstructions are compared to the DVHMC (black curves) for each sphere
Fig. 3 The DVHpet ref
of Ph3. Sphere sizes are represented in A 37 mm, B 28 mm, C 22 mm, D 17 mm, E 13 mm and F 10 mm. The
dose-axis and volume-axis in each figure have the same corresponding limits
>20 mm (22, 28 and 37 mm), increasing the number of iterations did not incur signif-
VSV or resulted in a slight increase in the D
icant change in the shape of the DVHpet max ,
e.g. between i1s10-0mm and i3s10-0mm, as shown on Fig. 3. Increasing iterations from
1 to 3 did not seem to favour noise amplification for the largest spheres. On the other
hand, more variations were observed for spheresLabour et al. EJNMMI Physics (2021) 8:56 Page 12 of 24
Fig. 4 RMSD between DVHpet VSV and DVHMC . A RMSD for all reconstructions for the 28-mm sphere against filter
ref
size. B RMSD against sphere sizes for reconstructions using a 2-mm FWHM post-reconstruction Gaussian filter
only
the smallest RMSD were obtained using two combinations: i3s10-2mm for both the 22-
and 28-mm spheres, and i1s20-2mm for the 37-mm sphere.
Choice of reconstruction parameter set. The reconstruction parameter set i3s10-
2mm, as depicted by Fig. 3, provides a good compromise in reducing Dmax and provides
more accurate intermediate absorbed doses (D20% -D80% ) for the larger spheres (22-37
mm). It also shows relatively low RMSDs in Fig. 4 for these spheres. This parameter set is
therefore selected for image reconstructions in the following sections.
Effect of acquisition duration
Figure 5 depicts the effect of the acquisition duration on the DVHpetVSV , for the 6 spheres of
Ph3. The RMSDs when comparing a 15 to a 10 min/bed acquisitions DVHpet VSV were 3.2,
8.0, 1.6, 1.8, 23.2 and 19.4 for the 37- to 10-mm spheres, respectively. These corresponding
RMSDs increased to 10.1, 12.7, 5.6, 6.8, 43.6 and 24.2, when comparing a 15 to a 5 min/bed
DVHpetVSV , respectively.
RCAC and RCDose
Figure 6A and B depict the RCAC and RCDose using VSV convolution (see Eqs. 3 and 4)
for all the spheres with decreasing ACref , respectively. ACref ranged between 0.61 and
2.18 MBq mL−1 . The activity concentration recovery performance is influenced by the
count statistics related to the total activity present in the PET’s FOV. RCAC and RCDose
both decrease with decreasing ACref in the spheres. Overall, RCAC and RCDose were com-
parable for all spheres and ACref . RCDose was slightly greater than RCAC for most of the
considered object sizes as visible by comparison of Fig. 6A to B.
Comparison to LDM
Table 4 provides a comparison for Ph3 between the Dmean obtained with different cal-
MC VSV LDM
culation methods (DMIRD , Dref , Dpet and Dpet , see the “Absorbed dose computation”
and “Dosimetry-based figures of merit” sections) and their corresponding D50% , for the
MC
image acquisition where ACref was largest (2.18 MBq mL−1 ). As expected, Dref decreased
with decreasing sphere sizes since the sphere surface-to-volume ratio increases, leadingLabour et al. EJNMMI Physics (2021) 8:56 Page 13 of 24
VSV for all spheres. A 37 mm, B 28 mm, C 22 mm, D 17 mm, E 13
Fig. 5 Effect of acquisition duration on DVHpet
mm and F 10 mm. Reconstructions were performed using i3s10-2mm. The x-axis and y-axis in each figure
have the same corresponding limits
to more absorbed dose delocalisation due to electrons exiting the spherical VOI. More-
VSV MC
over, Dpet dropped when estimated from the PET image compared to Dref , e.g. from
89.5 to 59.8 Gy for the 17-mm sphere. Dmean and D50% were comparable for each calcula-
tion method. Overall, Dmean values estimated by LDM were closer than VSV convolution
to Monte Carlo simulated values.
Clinical application
Reducing acquisition duration
Figure 7 shows the influence of acquisition duration on the absorbed dose distributions
for post 90 Y-SIRT patient acquisitions, using i3s10-2mm reconstruction parameters, as
Fig. 6 Recovery coefficients against sphere diameter for varying ACref over 6 days. A RCAC . B RCDose .
Reconstructions were performed using i3s10-2mmLabour et al. EJNMMI Physics (2021) 8:56 Page 14 of 24
Table 4 Comparison between absorbed dose estimations for all spheres (imm ). Reconstructions
were performed using i3s10-2mm. All values in the table are in Gy
Ref. Monte Carlo VSV convolution LDM
VOI DMIRD MC VSV LDM
Dref DMC
ref ,50%
Dpet DVSV
pet,50% Dpet DLDM
pet,50%
10mm 112 73.3 66.1 26.8 17.3 31.3 12.6
13mm 112 81.1 77.4 46.3 45.3 51.2 48.7
17mm 112 89.5 86.8 59.8 55.9 66.3 58.0
22mm 112 93.8 95.2 89.2 81.0 96.4 84.8
28mm 112 97.8 101.1 79.7 80.5 84.7 81.1
37mm 112 101.8 105.8 80.5 80.0 83.7 78.5
previously recommended. Only minor differences were observed between DVHpet VSV cal-
culated for 10 and 15 min/bed acquisitions, for each of the liver VOIs delineated for all
patients. The RMSDs between 10 and 15 min/bed acquisitions for patient #1 were 0.3,
1.2, 1.5 and 0.9 for the WLV, PLV, TV and PNLV, respectively. The RMSDs for each VOI
between 5 and 15 min/bed acquisitions for patient #1 increased to 2.8, 18.3, 12.4 and 24.1
for the WLV, PLV, TV and PNLV, respectively.
Due to the size of the liver, the local protocol for the post 90 Y-SIRT patients gener-
ally includes a two-bed, 15 min/bed acquisition. The reduction of acquisition duration on
the specific patients studied here appeared to have no significant impact on dosimetry
via DVHpetVSV . Also, the visual interpretation made by physicians were similar when com-
paring 10 to a 15 min/bed patient acquisitions. Therefore, we suggest a reduction of the
acquisition duration from 15 to 10 min/bed, resulting in a total of 20 minutes instead of
30 minutes for 2 bed positions, helping to improve patient comfort.
Comparison to LDM
Table 5 provides subsequent results for patients #1 and #2 for comparisons between VSV
convolution and LDM. Dmean , D50% and D2% values are reported. LDM resulted in a sys-
tematically higher D2% than VSV convolution for all VOIs, e.g. 247.9 Gy for LDM to 214.1
VSV for 5 patients. Reconstructions were performed using
Fig. 7 Effect of acquisition duration on DVHpet
i3s10-2mm. Volume-axes in all figures have the same corresponding limitsLabour et al. EJNMMI Physics (2021) 8:56 Page 15 of 24
Table 5 Comparison of LDM to VSV convolution absorbed dose calculation methods through Dmean ,
D50% and D2% for patients #1 and #2 and different VOIs. Reconstructions were performed using
i3s10-2mm
VSV convolution LDM
Patient, VOI VSV LDM
Dpet DVSV
pet,50% DVSV
pet,2% Dpet DLDM
pet,50% DLDM
pet,2%
#1, WLV 38.1 1.3 242.7 38.5 0.9 263.4
#1, PLV 131.0 112.2 365.7 133.8 111.2 401.4
#1, TV 126.4 109.8 417.1 127.8 104.5 459.5
#1, PNLV 113.9 101.2 270.7 116.9 101.3 305.7
#2, WLV 25.1 5.4 157.8 25.5 3.6 178.1
#2, PLV 61.0 45.4 197.7 62.6 43.7 231.9
#2, TV 49.5 33.4 183.8 50.4 30.0 215.8
#2, PNLV 48.5 30.0 214.1 51.8 30.6 247.9
Gy for VSV convolution. Dmean and D50% between the two calculation methods were
comparable for all VOIs for all patients.
Discussion
Context. The main goal of this work was to evaluate the influence of the acquired
count statistics (acquisition length), phantom configuration and reconstruction parame-
ters using a DPC-PET to improve quantitative accuracy in 90 Y dosimetry for PET imaging.
An initial check was performed using two cylindrical uniform phantoms. A third NEMA
IEC body phantom was used to evaluate the relaxed LMOSEM algorithm parameters
implemented in Philips reconstruction platforms for PET imaging. OSEM parameters
were varied to find combinations of iterations, subsets and post-reconstruction Gaussian
filter sizes which would provide the least difference between the DVHref MC using GATE
and DVHpet VSV using DOSIsoft® (Cachan, France). ToF and PSF modellings were consid-
ered in all reconstructions. The acquisition duration was varied by rebinning listmode
phantom and patient datasets to determine the shortest acquisition duration that main-
tains an acceptable accuracy. Using the method suggested by Siman et al., the RMSD
between DVHref MC and DVH VSV was used to compare absorbed doses obtained with differ-
pet
ent datasets and dosimetry methodologies. Analysis using DVHpet LDM was also performed,
using specific reconstruction parameters following evaluation. No special intent was
made toward improving image quality using NEMA standards [35] since the goal was to
improve dosimetry accuracy.
Ph1 and Ph2. Considering mean activity concentrations and mean absorbed doses for
Ph1 (at ACref equal to 0.29 MBq mL−1 ) and Ph2 (at ACref equal to 1.71 MBq mL−1 ),
the DPC-PET was shown to produce accurate results (Labour et al. EJNMMI Physics (2021) 8:56 Page 16 of 24
shown in Fig. 2B and C for the two phantoms, illustrating the loss of accuracy brought by
the use of the PET images compared to the ideal reference Monte Carlo simulations. The
two figures also illustrate the PVEs on distributions of intermediate absorbed doses when
using VOIouter (the exact CT dimensions of the considered phantom VOIs) and VOIinner
(the reduced dimensions). Adding to PVE, there are also the low statistics and noise con-
ditions in which imaging was performed, which could cause heterogeneity in the activity
distribution and therefore in the absorbed dose distribution.
Ph3 and evaluation through DVH. The differences in DVHref MC and DVH VSV are also
pet
depicted in Figs. 3, 4 and 5. The limitation due to the intrinsic poor statistics and the
PVE compromise the accurate quantification of small objects, showing DVHpet VSV and
RMSDs which have large variations depending on the reconstruction parameters used.
Siman et al. also showed relative large RMSDs between their reference and PET image-
based DVHs, illustrating the loss of accuracy brought by the use of the images. Figure 5E
and F depict the limit of reducing acquisition duration for small lesions. RMSDs between a
10 to a 15 min/bed acquisitions were significant for the 10- and 13-mm spheres compared
to the other 4 larger spheres. On the other hand, acquisition duration can be reduced
to 10 min/bed using a DPC-PET if the size of the lesion is at least 17 mm in diameter
based on the obtained absorbed dose distributions in this study. The results found that in
both the phantom and patient data, the difference in DVHpet VSV between 10- and 15-min
acquisitions was small, as depicted in Fig. 7.
Variation of OSEM parameters. The evaluation of the reconstruction parameters for
dosimetry is necessary for each system, first owing to different PET performances in
terms of sensitivity, spatial resolution, counts rates, energy and timing resolutions [30, 32,
35, 74, 75]; second, for different reconstruction algorithms, e.g. the OSEM or Bayesian
Penalised Likelihood (BPL), where the implementations of OSEM-based algorithms vary
from one manufacturer to another; and third, due to the very specific configurations of
imaging protocols from one hospital to another.
The combination of parameters for OSEM reconstructions is not a simple choice and
is specific for one configuration of SBR, ACref , image voxel size and lesion size. In this
study, the variation of iterations, limited from 1 to 3, did not have a significant impact on
the calculated absorbed dose distributions; see Fig. 3. On the other hand, varying subsets
and the FWHM of the post-reconstruction Gaussian filter had an impact. The use of 30
subsets could help in improving accuracy in dosimetry for the small spheres, but could
favour noise amplification in the image compared to 10 subsets. The number of updates,
which is the product of the number of iterations and subsets was not used as objective
criteria for evaluation since different combinations for the same number of updates could
provide different results, e.g. 30 updates for both i1s30-0mm and i3s10-0mm in Fig. 3.
DVH comparisons using RMSD. We evaluated the reconstruction parameters using
RMSD comparisons between DVHs as suggested by Siman et al., but this could not be
a relevant criteria for assessing absorbed dose distributions. Variations in RMSD will be
observed depending on the range chosen for calculation, e.g. D0% -D100% , D10% -D90% andLabour et al. EJNMMI Physics (2021) 8:56 Page 17 of 24
D20% -D80% , as explained by Siman et al. themselves. In this study, whole range (D0% -
D100% ) was chosen for evaluation, even if larger RMSD would be obtained to include all
factors which could affect the dosimetry.
It was found that the use of DVH is necessary and sufficient to make a choice on
the reconstruction parameters. However, it depends on the information required (Dmean ,
Dmax , D20% , D50% , D80% , etc.), and the size of the VOI. For example, for the 22–37-mm
spheres in Fig. 3, a compromise can be made between intermediate absorbed doses, e.g.
between D20% and D80% , and the Dmax , where i3s10-0mm (or i3s10-2mm) can be suitable
for reconstruction.
RCAC and RCDose . Owing to the few statistical production of positrons during 90 Y decay,
PVE and other confounding factors, the RCAC does not reach 100% for any of the spheres
in Ph3, as it can be the case for 18 F imaging. This is true for all 69 PET systems evaluated
in the QUEST multicentric study [45] in 2014, for any kind of reconstruction. No SiPM
systems were included in the QUEST evaluation, due to SiPM PET systems only being
commercialised from 2013 for Philips, 2016 for GE (Discovery™ MI) and 2018 (Biograph
Vision™) and 2020 (Biograph Vision Quadra™) for Siemens. Since activity recovery has
not reached at 100% for spheres up to 37 mm, absorbed doses for such lesion sizes are
expected to suffer from poor quantitative accuracy and corrections in the absorbed dose
estimations still need to be investigated and accounted for post 90 Y-SIRT dosimetry. For
VSV
the largest 28- and 37-mm spheres, the RCDose were around 0.8, and the Dpet seems to
MC
be underestimated by about roughly 20% if we compare to Dref . The two smallest 10- and
13-mm spheres have underestimations on the mean absorbed dose which can be greater
than 50%. The latter still suffer from greater PVE due to the spatial resolution, which
is around 4-mm FWHM [29, 30, 32]. In an attempt to compare to 18 F imaging but for
qualitative studies and diagnostic purposes, Salvadori et al. [39] obtained CRCs which
were less than 50% using 1 to 3 OSEM iterations for the 10-mm sphere on the DPC-PET,
showing the limits of small spheres even for high β + production statistics.
Absorbed dose calculations. VSV convolution for absorbed dose calculation is based
on pre-calculated kernels by Monte Carlo methods and has been validated and proved to
be clinically suitable for 90 Y post-SIRT dosimetry [69]. LDM is a fast voxel-based method
and easy to apply in clinic, which requires no post-processing and where a multiplicative
factor similar to Eq. 1 is applied in a voxel-wise manner, as opposed to a pre-calculated
convolution kernel for VSV. LDM is an alternative providing good accuracy as suggested
by Pasciak et al. [37]. Monte Carlo simulations were used in this study but did not aim
at replacing clinical dosimetry using VSV convolution or LDM. It was used as a tool
to obtain a reference in absorbed dose distributions and was easier to use than indus-
trial software for batch processing. It has not been detailed here, but absorbed dose
distributions using VSV convolution were compared to PET image-based Monte Carlo
simulations where excellent agreements were obtained between them, again illustrating
the major image degradation coming from the non-ideal PET performance impacting on
the absorbed dose distributions.
Comparison of VSV convolution to LDM. LDM would probably be a good method
for absorbed dose computation, as shown by Pasciak et al. [37], since the PET derivedLabour et al. EJNMMI Physics (2021) 8:56 Page 18 of 24
90 Y absorbed dose distribution is already blurred by PVE and organ movement due to
respiration, and indeed, there might be no need to blur even more the PET signal with a
VSV LDM
kernel. Results in this study show comparable Dpet and Dpet for phantoms and patients;
see Tables 3, 4 and 5. However, LDM has the tendency to favour amplification of the Dmax
as seen on Fig. 2B and C (green DVHs), which adds a bias on the Dmean by increasing its
LDM VSV MC
value. In fact, considering Table 4, the Dpet is closer than Dpet to Dref for all spheres.
If we consider Table 5, D2% for LDM is 20 to 40 Gy higher than VSV convolution for
different VOIs in patients. The same observations can be made using reference phantom
data.
LDM seems to favour amplification of high absorbed doses compared to VSV convolu-
tion if compared to Monte Carlo simulations, to the detriment of intermediate absorbed
doses. Therefore, this study suggests that considering the Dmean would not be the best
criteria to assess absorbed doses using LDM. Finally, LDM and VSV convolution meth-
ods are both available for clinical practice. Even though more difficult to implement than
LDM, VSV convolution is also fast (approx. 30 s for calculation per reconstructed image)
and clinically feasible for each patient and both can be used if DVH comparisons are
performed.
Comparison to previous studies. Following the improvements in photon detection
in PET systems, PET/CT is an established and recommended method for 90 Y treat-
ment verification after SIRT as it provides improved accuracy for dosimetry [76]. A
number of phantom studies have been performed with 90 Y on different PET systems
[23, 36–38, 45, 49–62]. They are summarised in Table 6. Some studies focused on qualita-
tive and detection performances through image quality reports [36, 53, 55, 56, 58, 60–62],
such as the CRC and the background variation (BV) following the NEMA NU-2 stan-
dards and guidelines [35]. Some other studies focused on a more quantitative evaluation
on activity concentrations using RCAC [23, 36, 38, 45, 49–52, 54, 57, 59, 60, 62]. Fewer
phantom studies focused on improving dosimetric quantification using RCDose or other
dosimetric clinical routine metrics [37, 38, 53, 57, 62]. Elschot et al. [53] in 2013 showed
through DVH that 90 Y dosimetry is more accurate for PET than SPECT imaging. Stryd-
horst et al. [56] in 2016 showed in their study that the bremsstrahlung radiation had negli-
gible effects on PET-image image quality using Monte Carlo simulations. D’Arienzo et al.
[57] in 2017 concluded that the post-SIRT dosimetry is possible even in conditions of low
statistics and high random fraction, provided that accurate PET calibration is performed
and acquisition durations are sufficiently long. Pasciak et al. [37] in 2014, Siman et al. [38]
in 2018 and the latest study in 2020 from Hou et al. [62] were the only studies which sug-
gested optimised reconstruction algorithm parameters using either, or both, RCDose and
DVH estimations on phantoms. However, the suggested OSEM parameters from Pas-
ciak et al. [37] (i1s21-0mm + 4.5 mm FWHM PSF + ToF) were different from Siman et
al. [38] (i3s12-5.2mm + PSF + ToF) and were for different PET systems. Hou et al. [62]
evaluated reconstructions on GE systems using a Penalised Likelihood (PL) algorithm.
Limitations. In the present study, we evaluated several DVHpet VSV for the acquisition
in specific conditions (SBR of 9:1, isotropic image voxel size of 2 mm, ACref of 2.18
MBq mL−1 ). For further investigation, evaluations of DVHpet VSV should be made for the
different ACref present in the spheres at different imaging times and also by varying theLabour et al. EJNMMI Physics
Table 6 Summary of phantom studies with hot spheres for 90 Y, for several PET/CT and PET/MR systems, SBR and ACref
Spheres phantom set
Ref. Scanner
SBR ACref Contrast Activity Dose Optim.
(MBq mL−1 ) (Variable parameters)
(2021) 8:56
Werner et al. [49] Biograph Hi-Rez 16 N/A 3.6 - x - -
Van Elmbt et al. [50] Gemini TF
Gemini Power 16 3:1 1.3 - x - -
Ecat Exact HR+
Bagni et al. [51] Discovery ST 10:1 1.92 - x - -
D’Arienzo et al. [52]
Willowson et al. [36] Biograph mCT-S(64) 8:1 3.9 x x - OSEM
(i1, i2, i3,
s14, s21, s24)
Elschot et al. [53] Biograph mCT 1:0 2.4 x - x -
9:1
Carlier et al. [23] Biograph mCT 40 40:1 8.1 - x - OSEM
(i1, i3)
Attarwala et al. [54] Biograph mCT 40 8:1 2.38 - x - OSEM
(i1 to i12)
Martí-Climent et al. [55] Biograph mCT-TrueV 5:1 1 x - - OSEM
(i1, i2, i3,
2mm, 4mm, 6mm)
Pasciak et al. [37] Biograph mCT Flow 3:1 2.2 - - x PSF at FWHM (mm)
(2 to 12)
Page 19 of 24Table 6 Summary of phantom studies with hot spheres for 90 Y, for several PET/CT and PET/MR systems, SBR and ACref (Continued)
Labour et al. EJNMMI Physics
Spheres phantom set
Ref. Scanner
SBR ACref Contrast Activity Dose Optim.
(MBq mL−1 ) (Variable parameters)
Willowson et al. [45] Various∗ 8:1 N/A - x - -
(2021) 8:56
(The QUEST study)
Strydhorst et al. [56] Biograph mCT 8:1 N/A x - - -
D’Arienzo et al. [57] Discovery ST 8:1 2.28 - x x -
Siman et al. [38] Discovery 690 4:1 1.6 - x x OSEM
13:1 4.8 (i1 to i12,
0mm, 2.6mm, 5.2mm, 7.8mm, 10.4mm)
Maughan et al. [59] Biograph mMR∗∗ 8:1 N/A - x - -
(The MR-QUEST study)
Scott and McGowan [60] Discovery 710 8:1 N/A x x - PL
Rowley et al. [58] Discovery 710 8:1 3.3 x - - PL
Seo et al. [61] SIGNA (PET/MR) 4:1 N/A x - - -
Hou et al. [62] Discovery 690 7.5:1 2.45 x x x PL
The present study Vereos DPC 9:1 2.25 - x x OSEM
(i1, i2, i3,
s10, s20, s30,
0mm, 2mm, 4mm, 6mm, 8mm
5, 10, 15 min/bed)
The four last columns to the right summarise the type of evaluation done in the different studies. Contrast: Qualitative evaluation using definitions such as in the NEMA NU-2 standards for image quality. Activity: Quantitative
evaluation either based on activity or RCAC estimates. Dose: Quantitative evaluation based on RCDose or DVH estimates. Optim: Studies which aimed at varying reconstruction parameters to find optimised reconstruction parameters.
Only variable parameters for OSEM reconstructions with ToF are reported
∗ The QUEST phantom study including 69 PET/CT systems (GE, Siemens, Philips)
∗∗ The MR-QUEST phantom study including 8 PET/MR systems (Siemens)
Page 20 of 24Labour et al. EJNMMI Physics (2021) 8:56 Page 21 of 24
image resolution, for example for voxels of 4 mm instead of 2 mm. Evaluations varying
SBR would require more experimental data, with a different experimental setup for each
SBR. Evaluations by varying and tuning the parameters chosen for the regularised version
of the Richardson-Lucy algorithm for resolution recovery (fixed to 1 iteration with a 6 mm
regularisation kernel in this study according to recommendations) and their influence on
the accuracy of quantitative recovered information in the reconstructed images can be the
topic for future studies. Selected reconstruction parameters were based on evaluations
using VSV convolution, but similar evaluations can be performed using LDM. The results
presented here can be useful in the choice of OSEM reconstruction parameters for exam-
ple in studies such as published by Wei et al. [77], Levillain et al. [78], Morán et al. [79]
and Hess et al. [80] for better accuracy in absorbed dose calculation following 90 Y-SIRT
using the DPC-PET.
Conclusion
This study aimed to evaluate various parameters for 90 Y-PET imaging with a DPC-PET
Philips system for post-SIRT image-based dosimetry. To our knowledge, no previous
study concerning the evaluation of acquisition and reconstruction parameters through
DVHs have been published previously for SiPM PET systems. Overall, for dosimetry pur-
poses, we recommend to apply a 2-mm FWHM post-reconstruction Gaussian filter size,
which could reduce noise in the reconstructed image while keeping the same accuracy as
when no filter is applied. The selected reconstruction parameter set could be i3s10-2mm
for large spheres, but this choice depends on the absorbed dose information required.
This study can be useful in the choice of reconstruction parameters using the DPC-PET,
depending on imaging conditions for 90 Y. The acquisition length can also be reduced
from 15 to 10 min/bed for 90 Y-SIRT with acceptable accuracy degradation in the absorbed
dose distribution, improving patient comfort.
Acknowledgements
The authors would like to thank Belinda Stiles (St. George’s University Hospitals, London, UK), Tony Younes
(IUCT-Oncopole, Toulouse, France) and Julien Salvadori (IADI Laboratory, Nancy, France) for helpful review of the article.
Authors’ contributions
JL, DS and JNB initiated the project and defined the method. JL, JNB, PB, PVD, FK and DK performed most of the
experimental acquisitions. JL performed all Monte Carlo simulations. JL and TB implemented all Python tools for data
analysis. JL and DS wrote most of the text. SPDM helped in data interpretation. All authors read, corrected and approved
the final manuscript.
Funding
This work was supported in part by Philips Healthcare. This work was performed within the framework of the SIRIC
LYriCAN Grant INCa-INSERM-DGOS-12563, and the LABEX PRIMES (ANR-11-LABX-0063) of Université de Lyon, within the
programme “Investissements d’Avenir” (ANR- 11-IDEX-0007) operated by the ANR.
Availability of data and materials
GATE scripts for simulation during the current study are available from the corresponding author on request.
Declarations
Ethics approval and consent to participate
Not applicable.
Consent for publication
Informed written consent was obtained from all individual participants included in the study.
Competing interests
The authors declare that they have no competing interests.Labour et al. EJNMMI Physics (2021) 8:56 Page 22 of 24
Author details
1 CREATIS; CNRS UMR 5220; INSERM U 1044; Université de Lyon; INSA-Lyon; Université Lyon 1, Lyon, France. 2 Centre de
lutte contre le cancer Léon Bérard, Lyon, France. 3 Hospices Civils de Lyon; Université de Lyon; Université Claude Bernard
Lyon 1; LAGEPP UMR 5007 CNRS, Lyon, France.
Received: 4 January 2021 Accepted: 23 June 2021
References
1. Salem R, Lewandowski RJ, Mulcahy MF, Riaz A, Ryu RK, Ibrahim S, Atassi B, Baker T, Gates V, Miller FH, et al.
Radioembolization for hepatocellular carcinoma using Yttrium-90 microspheres: a comprehensive report of
long-term outcomes. Gastroenterology. 2010;138(1):52–64.
2. Sangro B, Carpanese L, Cianni R, Golfieri R, Gasparini D, Ezziddin S, Paprottka PM, Fiore F, Van Buskirk M,
Ignacio Bilbao J, et al. Survival after yttrium-90 resin microsphere radioembolization of hepatocellular carcinoma
across Barcelona clinic liver cancer stages: a European evaluation. Hepatology. 2011;54(3):868–78.
3. Lau W, Leung W, Ho S, Leung N, Chan M, Lin J, Metreweli C, Johnson P, Li A. Treatment of inoperable
hepatocellular carcinoma with intrahepatic arterial yttrium-90 microspheres: a phase I and II study. Br J Cancer.
1994;70(5):994–9.
4. Sato KT, Lewandowski RJ, Mulcahy MF, Atassi B, Ryu RK, Gates VL, Nemcek Jr AA, Barakat O, Benson III A, Mandal
R, et al. Unresectable chemorefractory liver metastases: radioembolization with 90 Y microspheres–safety, efficacy,
and survival. Radiology. 2008;247(2):507–15.
5. Kennedy AS, McNeillie P, Dezarn WA, Nutting C, Sangro B, Wertman D, Garafalo M, Liu D, Coldwell D, Savin M, et
al. Treatment parameters and outcome in 680 treatments of internal radiation with resin 90Y-microspheres for
unresectable hepatic tumors. Int J Radiat Oncol Biol Phys. 2009;74(5):1494–500.
6. Cremonesi M, Chiesa C, Strigari L, Ferrari M, Botta F, Guerriero F, De Cicco C, Bonomo G, Orsi F, Bodei L, et al.
Radioembolization of hepatic lesions from a radiobiology and dosimetric perspective. Front Oncol. 2014;4:210.
7. Garin E, Rolland Y, Laffont S, Edeline J. Clinical impact of (99m)Tc-MAA SPECT/CT-based dosimetry in the
radioembolization of liver malignancies with 90 Y-loaded microspheres. Eur J Nucl Med Mol Imaging. 2016;43(3):
559–75.
8. Gnesin S, Canetti L, Adib S, Cherbuin N, Monteiro MS, Bize P, Denys A, Prior JO, Baechler S, Boubaker A. Partition
model–based 99mTc-MAA SPECT/CT predictive dosimetry compared with 90Y TOF PET/CT posttreatment
dosimetry in radioembolization of hepatocellular carcinoma: a quantitative agreement comparison. J Nucl Med.
2016;57(11):1672–8.
9. Haste P, Tann M, Persohn S, LaRoche T, Aaron V, Mauxion T, Chauhan N, Dreher MR, Johnson MS. Correlation of
technetium-99m macroaggregated albumin and yttrium-90 glass microsphere biodistribution in hepatocellular
carcinoma: a retrospective review of pretreatment single photon emission CT and posttreatment positron emission
tomography/CT. J Vasc Interv Radiol. 2017;28(5):722–30.
10. Richetta E, Pasquino M, Poli M, Cutaia C, Valero C, Tabone M, Paradisi BP, Pacilio M, Pellerito RE, Stasi M. PET-CT
post therapy dosimetry in radioembolization with resin 90Y microspheres: Comparison with pre-treatment
SPECT-CT 99mTc-MAA results. Phys Med. 2019;64:16–23.
11. Dezarn W, Cessna J, DeWerd L, Feng W, Gates V, Halama J, Kennedy A, Nag S, Sarfaraz M, Sehgal V, Selwyn R,
Stabin M, Thomadsen B, Williams L, Salem R. Recommendations of the American Association of Physicists in
Medicine on dosimetry, imaging, and quality assurance procedures for 90Y microsphere brachytherapy in the
treatment of hepatic malignancies. Med Phys. 2011;38(8):4824.
12. Walrand S, Hesse M, Demonceau G, Pauwels S, Jamar F. Yttrium-90-labeled microsphere tracking during liver
selective internal radiotherapy by bremsstrahlung pinhole SPECT: feasibility study and evaluation in an abdominal
phantom. EJNMMI Res. 2011;1(1):32.
13. Johnson O, Johnson R, Langer L. Evidence for a 0+ first excited state in Zr90 . Phys Rev. 1955;98(5):1517.
14. Ford KW. Predicted 0+ Level in Zr90 40 . Phys Rev. 1955;98(5):1516.
15. Greenberg JS, Deutsch M. Positrons from the decay of P32 and Y90 . Phys Rev. 1956;102(2):415.
16. Moore CF, Zaidi S, Kent J. Single-particle states built on the second 0+ state in Zr90 . Phys Rev Lett. 1967;18(10):345.
17. Selwyn R, Nickles R, Thomadsen B, DeWerd L, Micka J. A new internal pair production branching ratio of 90 Y: The
development of a non-destructive assay for 90 Y and 90 Sr. Appl Radiat Isot. 2007;65(3):318–27.
18. Dryák P, Šolc J. Measurement of the branching ratio related to the internal pair production of Y-90. Appl Radiat Isot.
2020;156:108942.
19. Nickles RJ, Roberts AD, Nye JA, Converse AK, Barnhart TE, Avila-Rodriguez MA, Sundaresan R, Dick DW, Hammas
RJ, Thomadsen BR. Assaying and PET imaging of ytrrium-90: 1/spl Gt/34ppm gt;0. In: IEEE Symposium Conference
Record Nuclear Science 2004, vol 6; 2004. p. 3412–4. https://doi.org/10.1109/NSSMIC.2004.1466619.
20. Lhommel R, Goffette P, Van den Eynde M, Jamar F, Pauwels S, Bilbao JI, Walrand S. Yttrium-90 TOF PET scan
demonstrates high-resolution biodistribution after liver SIRT. Eur J Nucl Med Mol Imaging. 2009;36(10):1696.
21. Lhommel R, Van Elmbt L, Goffette P, Van den Eynde M, Jamar F, Pauwels S, Walrand S. Feasibility of 90 Y TOF
PET-based dosimetry in liver metastasis therapy using SIR-Spheres. Eur J Nucl Med Mol Imaging. 2010;37(9):1654–62.
22. Elschot M, Nijsen JFW, Dam AJ, de Jong HWAM. Quantitative evaluation of scintillation camera imaging
characteristics of isotopes used in liver radioembolization. PLoS ONE. 2011;6(11):e26174.
23. Carlier T, Eugène T, Bodet-Milin C, Garin E, Ansquer C, Rousseau C, Ferrer L, Barbet J, Schoenahl F, Kraeber-Bodéré
F. Assessment of acquisition protocols for routine imaging of Y-90 using PET/CT. EJNMMI Res. 2013;3(1):1–12.
24. Gates VL, Esmail AA, Marshall K, Spies S, Salem R. Internal pair production of 90 Y permits hepatic localization of
microspheres using routine PET: proof of concept. J Nucl Med. 2011;52(1):72–6.
25. Kao Y, Tan E, Lim K, Ng C, Goh S. Yttrium-90 internal pair production imaging using first generation PET/CT
provides high-resolution images for qualitative diagnostic purposes. Br J Radiol. 2012;85(1015):1018–9.You can also read