Year-Round Dive Characteristics of Male Beluga Whales From the Eastern Beaufort Sea Population Indicate Seasonal Shifts in Foraging Strategies
←
→
Page content transcription
If your browser does not render page correctly, please read the page content below

ORIGINAL RESEARCH
                                                                                                                                            published: 03 January 2022
                                                                                                                                      doi: 10.3389/fmars.2021.715412

                                            Year-Round Dive Characteristics of
                                            Male Beluga Whales From the
                                            Eastern Beaufort Sea Population
                                            Indicate Seasonal Shifts in Foraging
                                            Strategies
                                            Luke Storrie 1,2* , Nigel E. Hussey 3 , Shannon A. MacPhee 2 , Greg O’Corry-Crowe 4 ,
                                            John Iacozza 1 , David G. Barber 1 , Alex Nunes 5 and Lisa L. Loseto 1,2
                                            1
                                             Centre for Earth Observation Science, Department of Environment and Geography, The University of Manitoba, Winnipeg,
                                            MB, Canada, 2 Freshwater Institute, Fisheries and Oceans Canada, Winnipeg, MB, Canada, 3 Department of Integrative
                                            Biology, University of Windsor, Windsor, ON, Canada, 4 Harbor Branch Oceanographic Institute, Florida Atlantic University,
                                            Fort Pierce, FL, United States, 5 Ocean Tracking Network, Dalhousie University, Halifax, NS, Canada

                            Edited by:
                       Phil J. Bouchet,     Dive behavior represents multiple ecological functions for marine mammals, but our
             University of St Andrews,
                      United Kingdom
                                            understanding of dive characteristics is typically limited by the resolution or longevity of
                        Reviewed by:
                                            tagging studies. Knowledge on the time-depth structures of dives can provide insight
                 William Richard Cioffi,    into the behaviors represented by vertical movements; furthering our understanding
   Southall Environmental Associates,       of the ecological importance of habitats occupied, seasonal shifts in activity, and the
                    Inc., United States
                 Kimberly Thea Goetz,       energetic consequences of targeting prey at a given depth. Given our incomplete
   National Oceanic and Atmospheric         understanding of Eastern Beaufort Sea (EBS) beluga whale behavior over an annual
        Administration, United States
                                            cycle, we aimed to characterize dives made by belugas, with a focus on analyzing shifts
                   *Correspondence:
                          Luke Storrie
                                            in foraging strategies. Objectives were to (i) characterize and classify the range of beluga-
             storriel@myumanitoba.ca        specific dive types over an annual cycle, (ii) propose dive functions based on optimal
                                            foraging theory, physiology, and association with environmental variables, and (iii) identify
                   Specialty section:
         This article was submitted to
                                            whether belugas undergo seasonal shifts in the frequency of dives associated with
                    Marine Megafauna,       variable foraging strategies. Satellite-linked time-depth-recorders (TDRs) were attached
               a section of the journal
                                            to 13 male belugas from the EBS population in 2018 and 2019, and depth data were
          Frontiers in Marine Science
                                            collected in time series at a 75 s sampling interval. Tags collected data for between
           Received: 26 May 2021
      Accepted: 25 November 2021            13 and 357 days, including three tags which collected data across all months. A total
       Published: 03 January 2022           of 90,211 dives were identified and characterized by twelve time and depth metrics
                              Citation:     and classified into eight dive types using a Gaussian mixed modeling and hierarchical
                  Storrie L, Hussey NE,
     MacPhee SA, O’Corry-Crowe G,
                                            clustering analysis approach. Dive structures identify various seasonal behaviors and
  Iacozza J, Barber DG, Nunes A and         indicate year-round foraging. Shallower and more frequent diving during winter in
    Loseto LL (2022) Year-Round Dive
                                            the Bering Sea indicate foraging may be energetically cheaper, but less rewarding
        Characteristics of Male Beluga
    Whales From the Eastern Beaufort        than deeper diving during summer in the Beaufort Sea and Arctic Archipelago, which
     Sea Population Indicate Seasonal       frequently exceeded the aerobic dive limit previously calculated for this population.
          Shifts in Foraging Strategies.
            Front. Mar. Sci. 8:715412.
                                            Structure, frequency and association with environmental variables supports the use
     doi: 10.3389/fmars.2021.715412         of other dives in recovery, transiting, and navigating through sea ice. The current

Frontiers in Marine Science | www.frontiersin.org                                  1                                          January 2022 | Volume 8 | Article 715412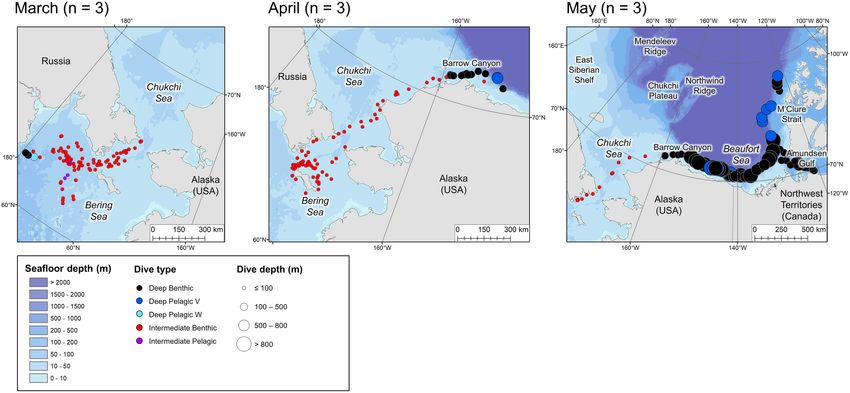
Storrie et al.                                                                                                       Year-Round Beluga Dive Characteristics

                                            study provides the first comprehensive description of the year-round dive structures of
                                            any beluga population, providing baseline information to allow improved characterization
                                            and to monitor how this population may respond to environmental change and
                                            increasing anthropogenic stressors.
                                            Keywords: Beaufort Sea, biologging, dive classification, energetics, foraging, beluga whale (Delphinapterus
                                            leucas), diving behavior

INTRODUCTION                                                                     the Bering Sea whilst their northern range is limited by pack ice,
                                                                                 they then migrate thousands of kilometers to summering grounds
Cetaceans spend the vast majority of their lives at various                      in the Beaufort Sea, Central Arctic Ocean, and into the Arctic
depths below the ocean surface, consequently vertical movement                   Archipelago (Hauser et al., 2014; Figure 1). Hence, EBS belugas
must be considered equally if not more so than horizontal                        occupy a dynamic environment ranging from shallow coastal
movement to fully understand the ecological significance of                      estuaries characterized by high turbidity and warm temperatures
animal behavior. Dive behavior of marine mammals may serve                       (Loseto et al., 2006; Hornby et al., 2016); to deep offshore waters
a number of functions depending on the structure of the dive                     over the Arctic Basin (Richard et al., 1997); and areas with
and depths targeted, including foraging (Viviant et al., 2014),                  dense pack ice within parts of the Arctic Archipelago (Loseto
transiting (McGovern et al., 2019), resting (Wright et al., 2017),               et al., 2006). However, regions inhabited by EBS belugas are
aiding digestion (Crocker et al., 1997), reproductive behaviors                  undergoing rapid alterations including declining sea ice and
(Baechler et al., 2002), predator avoidance (Aguilar de Soto et al.,             increasing sea surface temperatures (Wang and Overland, 2015;
2020), molting (Fortune et al., 2017), and possibly navigation                   Huntington et al., 2020), with possible negative consequences
(Matsumura et al., 2011).                                                        for beluga foraging opportunities (Harwood et al., 2015; Choy
   For many cetaceans, distinct temporal partitioning of                         et al., 2017; Hauser et al., 2018a). Identifying how belugas use
movement behaviors are governed by changes in seasonal                           vertical habitats, including assessing the behaviors represented
insolation and productivity, often coinciding with large scale                   by individual dives over a seasonal cycle and in the context of
migrations to more productive foraging habitats during spring                    foraging and energetic costs, will be key in monitoring responses
and summer (e.g., Zerbini et al., 2006). Among Arctic cetaceans,                 to environmental change.
the seasonal distributions of beluga whales (Delphinapterus                          The use of biotelemetry, using electronic tags attached to
leucas), narwhals (Monodon monoceros) and bowhead whales                         animals to collect data on movement, behavior, and their
(Balaena mysticetus) are often governed by the annual advance                    environment (Hussey et al., 2015), has revealed key aspects of
and retreat of sea ice (Laidre et al., 2008). Consequently,                      the ecology of EBS belugas including patterns in their movements
seasonal partitioning of behaviors is linked to accessibility to                 (Hauser et al., 2017a), seasonal ranges (Hauser et al., 2014; Citta
predictable foraging grounds and coastal regions for calving and                 et al., 2017), sexual segregation (Loseto et al., 2006), habitat
molting (Laidre and Heide-Jørgensen, 2005; Anderson et al.,                      selection (Hauser et al., 2017b), and dive behavior (Richard et al.,
2017), as well as seasonal productivity (Laidre et al., 2007).                   1997; Hauser et al., 2015). For biotelemetry (transmission of
As such, seasonal foraging intensity varies among species and                    data from a tag whilst attached to an animal) and biologging
populations depending on their geographic distribution and                       (data archived on a tag that must be recovered; Cooke et al.,
degree of interconnectedness with sea ice (Laidre and Heide-                     2021), there are inherent trade-offs between data resolution and
Jørgensen, 2005; Breton-Honeyman et al., 2016; Watt et al., 2016;                longevity of data collection (Carter et al., 2016). For example,
Castellote et al., 2020). Optimal foraging theory predicts that                  summarized histogram data that reduce battery drain have often
central place foragers, such as cetaceans which must return to the               been used to examine depth use in belugas (e.g., Heide-Jørgensen
surface to breathe, should maximize the time spent at depth as the               et al., 1998; Goetz et al., 2012; Hauser et al., 2015; note some older
foraging depth increases to offset the energetic costs associated                tags were only capable of collecting these data), but this type of
with greater travel distance (Mori, 1998). Time allocation over                  data can limit inferences on behavior. While a few studies on
a dive cycle, however, also depends on an animal’s aerobic dive                  belugas have analyzed data on individual dives, these typically
limit (ADL); the dive duration after which post-dive lactate                     cover short time periods, primarily the summer and fall (e.g.,
accumulation occurs, necessitating longer recovery times and                     Martin and Smith, 1992; Richard et al., 1997; Lefebvre et al., 2018;
less overall time spent foraging (Costa, 2007; Kooyman et al.,                   Vacquié-Garcia et al., 2019).
2021). Considering the time and depth structures and seasonal                        Given our incomplete understanding of EBS beluga dive
frequency of dives in the context of optimal foraging theory                     behavior over an annual cycle, including the paucity of data from
and ADL can provide insight on dive function (Heerah et al.,                     winter and spring, we aimed to characterize the suite of dive
2019), seasonality of behaviors (Blanchet et al., 2015), energetics              types exhibited by this population, to identify if seasonal shifts
(Arce et al., 2019; Friedlaender et al., 2020), and vertical prey                in dive behaviors occur. We use long-term time series depth
distribution (Tennessen et al., 2019).                                           data from satellite-linked time-depth recorders (TDRs) and
   The Eastern Beaufort Sea (EBS) beluga population occupies                     concurrent pop-up archival tags (MiniPATs) deployed on male
one of the greatest ranges among the species. Overwintering in                   beluga whales to address three core objectives; (i) to characterize

Frontiers in Marine Science | www.frontiersin.org                            2                                     January 2022 | Volume 8 | Article 715412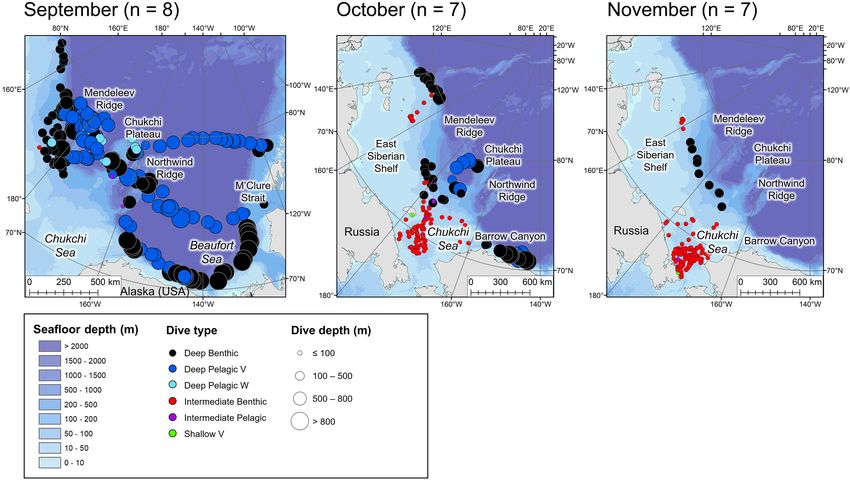
Storrie et al. Year-Round Beluga Dive Characteristics
and classify the range of beluga-specific dive types, (ii) to generate guiding the whale closer to shore for tag placement (Orr et al.,
hypotheses on the function of derived dive types based on their 2001). In terms of tag placement, SPLASH10-F-238 (WC,
time and depth structures, optimal foraging theory, life history Wildlife Computers Ltd., Redmond, WA, United States) tags
traits, and association with environmental variables (seafloor were attached via stainless steel cables and lock washers to either
depth, seafloor slope angle, and sea ice concentration) and side of three Delrin rods which were inserted through the dorsal
R
(iii) to identify whether belugas undergo seasonal shifts in the ridge and secured to lie flat on the beluga’s back. The SPLASH10-
frequency of dive types inferred to be associated with specific F-321 (Wildlife Computers) tags are specifically designed to glide
behavior. Together these data provide baseline information on to the surface as an animal surfaces; these tags were attached
the behaviors represented by dive types, allow an assessment via two 50 cm long tethers to either side of a single Delrin rod R
of the energetic costs and gains of different foraging behaviors, inserted through the dorsal ridge during live capture. A second
and identify the ecological significance of various habitats for method involved remote deployment of tags by Inuvialuit
this population. This is especially important in the context of a knowledge holders by following a beluga and deploying the tag
shifting prey assemblage (Choy et al., 2017, 2020; Loseto et al., using a custom anchor and jab-stick configuration. The jab-stick
2018), alterations in environmental conditions (Huntington et al., included a modified Wildlife Computers Domeier/Wilton
2020), and potential threats from increasing human activity Applicator Pin, with a series of rubber stoppers to limit
across the Arctic (Reeves et al., 2014; Hauser et al., 2018b). penetration depth. The new Wildlife Computers Inuvik Dart
(anchor) was tethered to each SPLASH10-F-321 tag with a
50 cm monofilament leader which was crimped, and covered in
MATERIALS AND METHODS a silicone sleeve to reduce abrasion. A total of 54 belugas were
tagged with six different tag types to address various population-
Data Collection specific questions. Due to the requirements of high-resolution
Belugas were tagged from Hendrickson Island within the depth and location data in the present study, we analyzed data
Mackenzie River estuary, Northwest Territories, Canada from 13 tagged belugas which transmitted for between 13 and
(Figure 1) during the summers of 2018 and 2019. Live-capture 357 days (Table 1), and were tagged primarily with SPLASH10-F-
tagging involved herding a whale toward a shallower area, 238 or SPLASH10-F-321 tags. Tag configurations were optimized
encircling with a net for capture and restraint, followed by for longevity whilst maximizing collection of depth time series
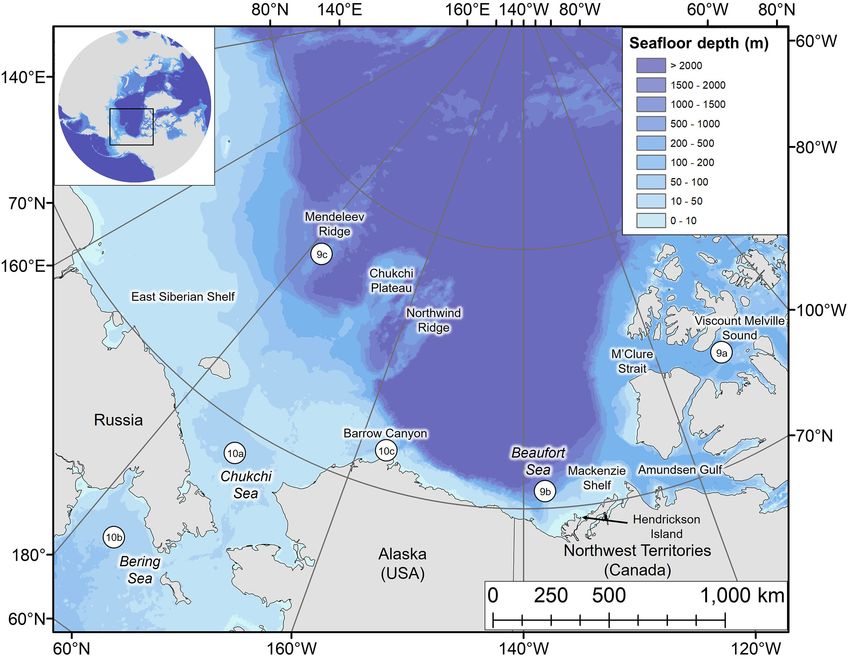
FIGURE 1 | Map of the study area with key locations labeled. Numbered circles 9a–9c and 10a–10c denote the locations of dive profiles shown in Figures 9, 10,
respectively.
Frontiers in Marine Science | www.frontiersin.org 3 January 2022 | Volume 8 | Article 715412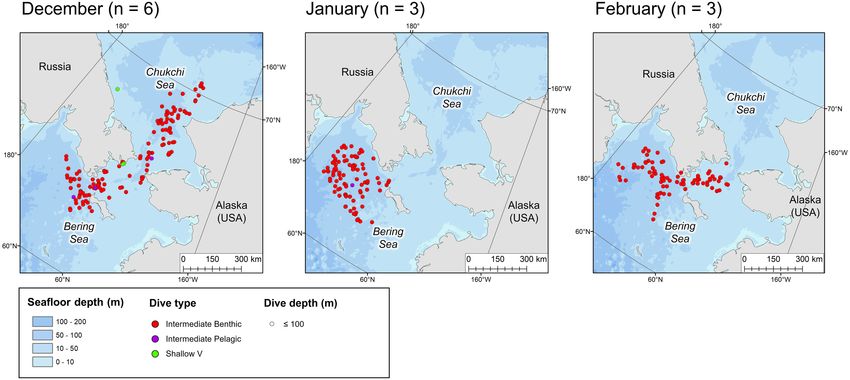
Storrie et al.                                                                                                                 Year-Round Beluga Dive Characteristics

data (Supplementary Table 1). Tags sampled depth (±0.5 m) at                          4.70 m, and molecular analyses (Rosel, 2003) confirmed that all
a 1 s interval, and transmitted time series data at 75 s intervals                    13 belugas analyzed were male (Table 1).
via hourly messages (±DRange, see Supplementary Figure 2a),
which were used in characterizing and classifying individual                          Estimating Beluga Dive Locations
dives. The maximum depth recorded in each hour from the 1 s                           Location data (Argos and Fastloc GPS) were filtered, firstly
sampled data was also transmitted, and was used to identify the                       by removing the most erroneous locations; consisting of
maximum depth reached by all tagged individuals each day.                             Argos locations with no associated ellipse error and Fastloc
Tags were programmed to collect Fastloc GPS locations every                           GPS locations with residual values ≥35 (Dujon et al., 2014).
7–30 min, and Argos locations were estimated during each                              The sdafilter function from the “argosfilter” package (Freitas
transmission. Note that the harpoon-deployed SPLASH10-F-321                           et al., 2008) in R v3.6.0 (R Core Development Team, 2019),
tags were also programmed to transmit archived data when                              was then used to remove locations based on unrealistic
the tag released from the animal and surfaced. In addition                            swimming speeds while retaining locations which result
to SPLASH tags, three belugas were double-tagged with a                               from higher swimming speeds over short distances (
Storrie et al.                                                                                              Year-Round Beluga Dive Characteristics

in R, with combined Argos and Fastloc GPS data; using                    ascending), and there are no subsequent periods where the
the ellipse errors for Argos locations. Fastloc GPS locations            animal descends below the “at depth threshold” depth. The
have greater accuracy when calculated using more satellites              surface phase begins when the animal has crossed the “surface
(Dujon et al., 2014); 81.6% of the filtered GPS locations                threshold.”
were calculated with ≥6 satellites, therefore an error                      The following parameter values were assigned; a surface
radius of 50 m was assigned to all Fastloc GPS locations                 threshold of 5 m and at depth thresholds of 0.1 and 0.5
following London and Johnson (2018). The CTCRW was fit                   for modeling dives
Storrie et al. Year-Round Beluga Dive Characteristics
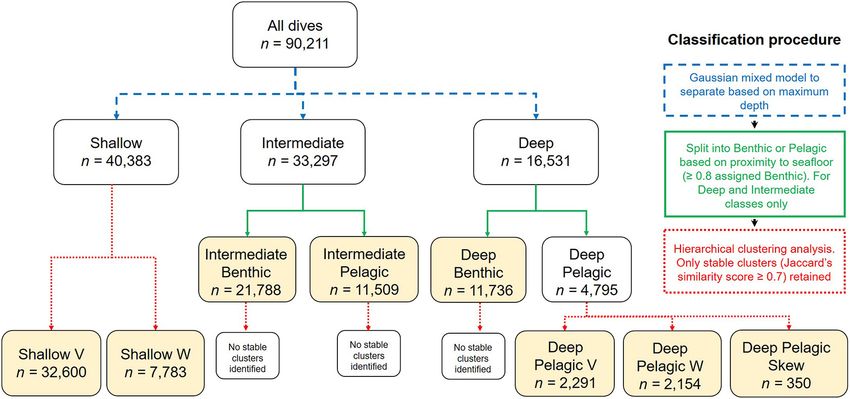
FIGURE 2 | Flow chart of the mixed classification procedure for differentiating between beluga dive types. Arrow color denotes method of classification used at each
stage; step 1 = blue, step 2 = green, step 3 = red. Yellow boxes denote the final dive types identified.
dive categories into Benthic and Pelagic categories based on the to running the models for the Deep Benthic, Deep Pelagic V, and
relative proximity of the dive to the seafloor (Benthic: maximum Deep Pelagic W dive types, winter was excluded as it contained
dive depth ≥ 80% of seafloor depth, Pelagic: maximum dive zero of these dive types across all hours of data. Models were not
depth < 80% of seafloor depth). Step 3 involved reducing the run for Deep Pelagic Skew as they were recorded infrequently
10 dive metrics (excluding maximum depth/seafloor depth) to (Table 2). Poisson regression models, suitable for count data
a set of uncorrelated principal components using a PCA with (i.e., number of dives per hour) were fit separately for the
a varimax rotation (Supplementary Tables 2a–k; Lesage et al., hourly frequency of each dive type as a function of season, with
1999; Lefebvre et al., 2018). A hierarchical clustering approach individual beluga included as a random effect. For each model we
was then undertaken for each of the above defined dive categories calculated the Pearson χ2 dispersion statistic (Zuur et al., 2009),
using the principal component scores, and cluster stability was and compared the observed and predicted number of zeros.
assessed to determine confidence in the number of clusters in the All models exhibited over-dispersion and zero-inflation, so the
data (Supplementary Table 2l). models were rerun as zero-inflated negative-binomial regression
models. The “emmeans” v1.5.2-1 package (Lenth et al., 2020) in R
was used to calculate estimated marginal means for GLMMs and
Comparing Dive Behavior by Seasons to statistically compare the frequency of dive types among pairs
and Environmental Variables of seasons using a Tukey’s test.
Following classification, the frequency of each dive type was To explore the environmental parameters associated with each
calculated for individual belugas per hour based on the dive start dive type, we ran and plotted classification and regression tree
time. Although time series data were complete for each hour (i.e., (CART) models using the “rpart” v4.1-15 (Therneau et al., 2019),
one transmitted message), dives could not be modeled correctly and “rpart.plot” v3.1.0 (Milborrow, 2021) packages, respectively,
if they crossed over 2 h data sections and the second hour was in R. The hourly frequency of each dive type (excluding Deep
missing, i.e., the transmission was not received. Hence, for each Pelagic Skew) was modeled as a function of seafloor depth,
summarized hour of data a single dive could be missing from seafloor slope angle, and sea ice concentration. Due to the a priori
that hour if the following hour was devoid of data (38.3% of discrimination of dive types by maximum dive depth and seafloor
hours had missing data); the total number of dives per hour depth during dive type classification, datasets for each model
should thus be seen as a lower estimate. The mean seafloor were first filtered to remove hours of data where it was impossible
depth, slope angle and ice concentration were calculated for each for a certain dive type to occur. These included data with a mean
hour based on the CTCRW derived locations. Each hour of data seafloor depth ≤101 m for the three Deep dive types, >101 m
was also assigned to the season in which it occurred; summer or ≤23 m for the Intermediate Benthic dive type, and ≤23 m for
(June-August), fall (September-November), winter (December- the Intermediate Pelagic dive type. To prevent the CART models
February), or spring (March-May). from overfitting the data, models were first run with pre-pruning
To identify seasonal differences in the frequency of each dive to set a minimum group size to 5% of all the observations. The
type, generalized linear mixed-effects models (GLMMs) were fit plotcp function was then used to plot the relationship between
using the “glmmTMB” v1.1.2 package (Magnusson et al., 2021) the complexity parameter and cross-validation error, and the
in R separately for each dive type as a function of season. Prior model rerun with the complexity parameter which was within
Frontiers in Marine Science | www.frontiersin.org 6 January 2022 | Volume 8 | Article 715412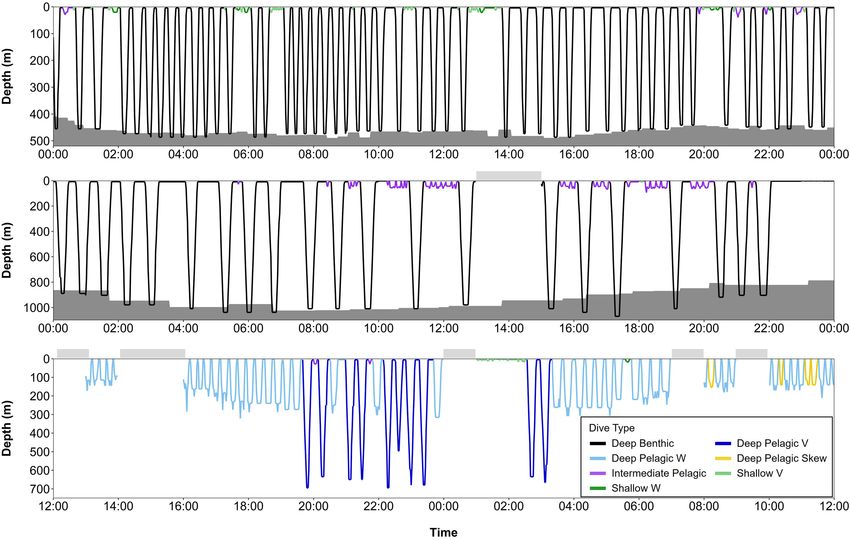
Storrie et al.                                                                                                                      Year-Round Beluga Dive Characteristics

one standard deviation of the complexity parameter with the                              in late summer/early fall (Figures 3, 4). During this period,
minimum cross-validation error.                                                          belugas spent periods of time in slope habitats off the Beaufort,
                                                                                         Chukchi, and East Siberian shelves, but core habitat was centered
                                                                                         around the Mendeleev Ridge (>1,000 m deep, Figure 4) in
RESULTS                                                                                  September, before moving into the Chukchi Sea (∼50 m deep)
                                                                                         in October and November. Belugas then occupied the northern
Seasonal Movements                                                                       Bering Sea (∼50 m deep) from winter (Figure 5) into mid-spring
Tagged EBS male belugas occurred in distinct geographical                                (Figure 6), whilst dense pack ice was present north of the Bering
regions over the seasonal cycle (Figures 3–6). During summer,                            Strait (Supplementary Figure 3b), after which they migrated
belugas occupied the shallow Mackenzie Shelf (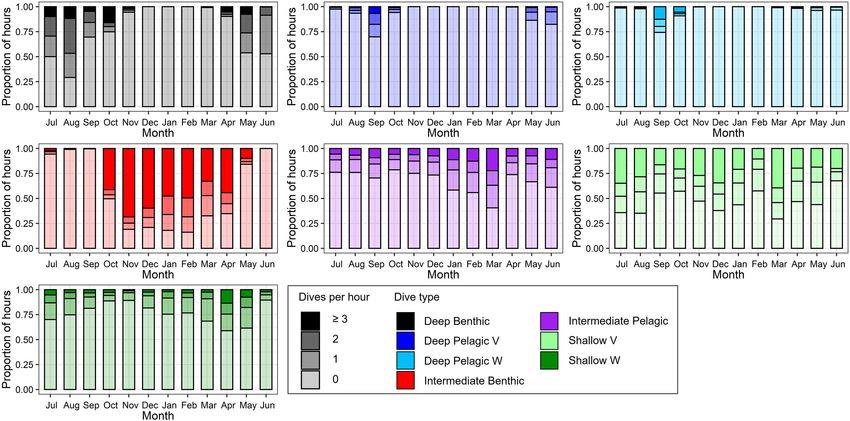
Storrie et al.                                                                                              Year-Round Beluga Dive Characteristics

Figure 3), and least complete later in the season (January through         movement (median descent rate = 0.45 vs. 1.45 m/s, median
June = 3 belugas, Table 1 and Figures 3–6).                                ascent rate = 0.37 vs. 1.38 m/s, Table 2) than Deep Benthic dives.

                                                                           Pelagic Dives
Beluga Dive Type Classification and                                        Four pelagic dive types were identified; Deep Pelagic V, Deep
Associated Characteristics                                                 Pelagic W, Deep Pelagic Skew, and Intermediate Pelagic. Due
A total of 96,984 individual dives were identified over 1,900 days         to their very low frequency of occurrence, Deep Pelagic Skew
of tracking data. Following removal of incorrectly modeled dives           dives were not analyzed in the CART models. The CART models
due to gaps in the data (6.98%), 90,211 dives were recorded by 13          identified that Deep Pelagic V dives were principally made in
male belugas between July 2018 and November 2019 (Table 1).                regions with seafloor depths ≥1,245 m (mean = 0.89 dives/hour,
    Eight dive types were identified using the Gaussian mixed              Figure 7), and with greatest frequency when seafloor depths
modeling and hierarchical clustering analyses approaches                   were ≥2,340 m (mean = 1.4 dives/hour), but rarely over
(Table 2). The Gaussian mixed modeling first categorized dives             shallower depths (mean = 0.064 dives/hour, Figure 7). Deep
according to three depth classes; Deep (max. depth > 101 m),               Pelagic V dives were the deepest of all dive types in general
Intermediate (max. depth = 23.1–101 m), and Shallow (max.                  (median max. depth = 576.0 m, Table 2), were long duration
depth ≤ 23 m). Deep and Intermediate dives were then further               (median = 17.25 min), but with a short bottom phase relative
subdivided into Benthic or Pelagic classes based on the proximity          to the total dive duration (median bottom duration/dive
of the dive to the seafloor (Figure 2, n = 4 dive categories).             duration = 0.20), and low bottom variance (median = 0.00 m),
Hierarchical clustering analysis revealed stable clusters (Jaccard’s       forming more of a V-shape than the Deep Benthic, Intermediate
similarity index ≥ 0.7, Supplementary Table 2l) within the Deep            Benthic, or Deep Pelagic W dives. Deep Pelagic W dives were also
Pelagic (n = 3) and Shallow (n = 2) dive categories, and these were        only made frequently in deeper regions (CART model seafloor
each further subdivided into dive types. Names assigned to each            depth ≥ 1,094 m, mean = 0.72 dives/hour, Figure 7). These
dive type describe the general dive structure, accepting a degree          dives were shallower (median max. depth = 205.5 m) and shorter
of variability observed within each of the eight determined dive           (median = 13.75 min) than Deep Pelagic V dives, but had
types (Table 2 and Supplementary Figures 2h–p). It should be               the longest bottom phase duration of any dive type (median
noted that due to the sampling frequency and surface threshold             bottom duration = 7.50 min, Table 2). These dives typically had
used, it was not possible to characterize the shallowest dives             a W-shape, often with one or more depth changes during the
(≤5 m) and that depth changes which may have occurred                      bottom phase of the dive (median bottom variance = 12.2 m), and
between the 75 s sampling intervals are underestimated, which              occasionally with large depth changes >50 m (Supplementary
will result in less accurate characterization of short dives.              Figure 2j). The Deep Pelagic Skew dives were infrequently
                                                                           recorded (n = 350, 0.39% of total dives), hence CART models
Benthic Dives                                                              were not used to identify environmental associations. These
Deep Benthic and Intermediate Benthic dives, U-shape in                    dives had similar structure to Deep Pelagic W dives, but
form, were typically characterized by consistent bottom depths             showed a prominent right-skew, with a slower ascent rate than
(median bottom variance = 0.0 m, Table 2), and long bottom                 descent rate (median ascent rate/descent rate = 0.66, Table 2).
durations relative to total dive duration (median bottom                   While this one skewed dive class was differentiated using the
duration/dive duration = 0.38 and 0.52, respectively, Table 2).            hierarchical clustering approach, other dive classes included
Deep Benthic dives were the most frequently recorded amongst               some level of skewed dives (see descent rate/ascent rate and
the Deep dive types (n = 11,736, 13.0% of total dives), and                ascent rate/descent rate metrics in Table 2, and Supplementary
included the deepest dive (max. depth = 1400.0 ± 15.75 m,                  Figures 2h–o). The Intermediate Pelagic dives were recorded
duration = 22.5 ± 1.25 min) and longest dive (max.                         frequently (n = 11,509, 12.8% of total dives), and tended to
depth = 432.0 ± 3.75 m, duration = 32.5 ± 1.25 min) recorded               occur more frequently under higher ice concentrations (≥35% ice
for a beluga whale. However, results of the CART model indicate            concentration, mean = 0.76 dives/hour, CART model, Figure 7)
infrequent occurrence in regions with seafloor depths ≥743 m               than lower ice concentrations (mean = 0.45 dives/hour). This
(mean = 0.22 dives/hour, Figure 7), and this dive type principally         dive type was variable in form, and included both short
occurred in regions with seafloor depths from 101 to 743 m                 V-shaped dives, and longer U- or W-shaped dives (Table 2 and
(mean = 1.5 dives/hour, Figure 7), under both high ice (≥60%,              Supplementary Figure 2m).
mean = 1.3 dives/hour), and lower ice concentrations (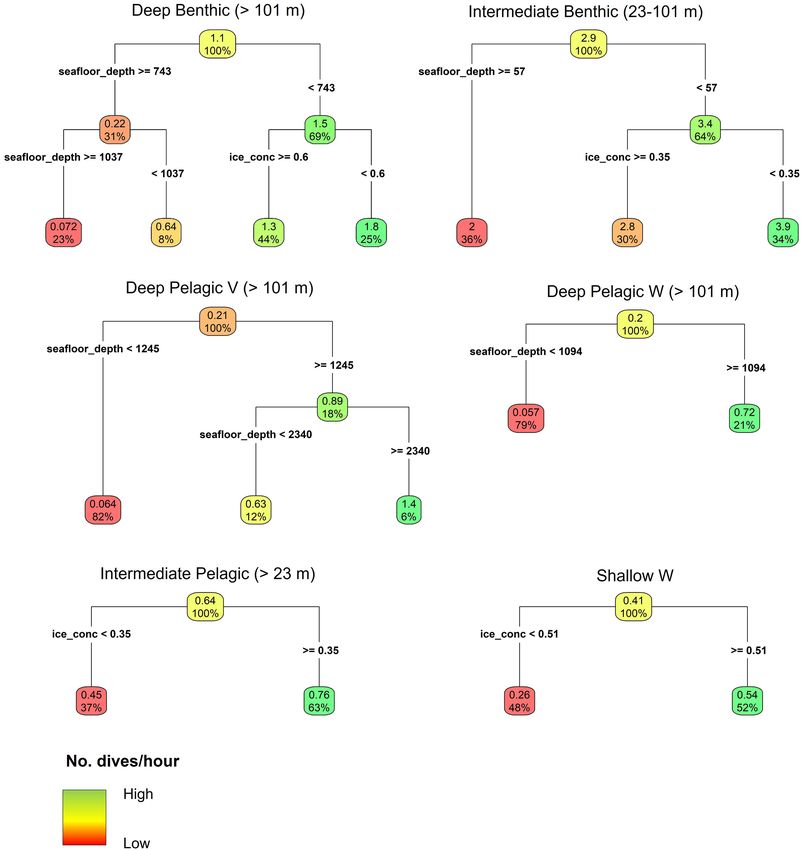
Storrie et al.                                                                                                               Year-Round Beluga Dive Characteristics

  FIGURE 3 | Locations of the daily deepest dive made by each beluga during the summer months. Symbol color represents dive type and symbol size represents the
  maximum depth reached. n in parentheses gives the number of belugas which transmitted data in the given month. Note that the panel for June denotes locations of
  dives recorded in 2019 (made by belugas which were tagged in July 2018). July and August are for 2018 and 2019.

  FIGURE 4 | Locations of the daily deepest dive made by each beluga during the fall months. Symbol color represents dive type and symbol size represents the
  maximum depth reached. n in parentheses gives the number of belugas which transmitted data in the given month.

Frontiers in Marine Science | www.frontiersin.org                                9                                         January 2022 | Volume 8 | Article 715412
Storrie et al.                                                                                                              Year-Round Beluga Dive Characteristics

  FIGURE 5 | Locations of the daily deepest dive made by each beluga during the winter months. Symbol color represents dive type and symbol size represents the
  maximum depth reached. n in parentheses gives the number of belugas which transmitted data in the given month.

  FIGURE 6 | Locations of the daily deepest dive made by each beluga during the spring months. Symbol color represents dive type and symbol size represents the
  maximum depth reached. n in parentheses gives the number of belugas which transmitted data in the given month.

forming a distinct V-shape (Table 2). Shallow W dives were made                      rates of descent and ascent than deeper dives among all dive
more frequently in regions with higher ice concentrations (≥51%,                     types (Table 2).
mean = 0.54 dives/hour, CART model, Figure 7). They were
characterized by an intermediate duration (median = 7.50 min),                       Post-dive Behavior
and a long bottom phase relative to the total dive duration                          As would be expected, the two deepest dive classes, Deep
(median bottom duration/dive duration = 0.56 m). Shallow W                           Benthic and Deep Pelagic V, had the longest post-dive surface
dives included U-shaped profiles with no bottom variance, as                         intervals (median = 3.75 and 5.0 min, respectively, Table 2,
well as W-shaped dives with some variance in depth during the                        p < 0.001, Supplementary Table 3a). The next deepest
bottom phase (median bottom variance = 0.1 m, see Table 2                            dive, Deep Pelagic W, had a significantly shorter post-dive
and Supplementary Figure 2o). Shallower dives had slower                             surface interval (median = 2.0 min, p < 0.001). Deep Pelagic

Frontiers in Marine Science | www.frontiersin.org                               10                                        January 2022 | Volume 8 | Article 715412
Storrie et al.                                                                                                                   Year-Round Beluga Dive Characteristics

  FIGURE 7 | Regression tree models for the hourly frequency of each dive type in relation to seafloor depth (seafloor_depth), sea ice concentration (ice_conc), and
  slope angle. Note that the model for the Shallow V dive type is not shown as regression trees identified no relationship between dive frequency and environmental
  parameters. The Deep Pelagic Skew dive type was not modeled due to low sample size. Parentheses next to the dive type show the range of seafloor depths over
  which the given dive type was modeled, due to prior discrimination in depth limits of certain dive types during the classification. The upper number in each node and
  leaf denotes the mean number of dives per hour given the environmental conditions above. The percentage in each node and leaf gives the proportion of the total
  number of observations conforming to the environmental conditions above. Sea ice concentration is the proportion of each 25 km2 grid cell covered by ice.

Skew, Intermediate Benthic and Intermediate Pelagic dive                                Supplementary Table 3a). All dive types except Deep Pelagic
types had the shortest post-dive surface intervals on average                           Skew were most frequently followed by a dive of the same type
(median = 1.25, 1.50, and 1.50 min, respectively, p < 0.001,                            or by a Shallow V dive type (Supplementary Figure 3a), with

Frontiers in Marine Science | www.frontiersin.org                                  11                                          January 2022 | Volume 8 | Article 715412
Storrie et al. Year-Round Beluga Dive Characteristics
Intermediate Benthic type dives having the greatest likelihood DISCUSSION
of being followed by a dive of the same type (78.0% of
Intermediate Benthic dives followed by an Intermediate Benthic Time series depth data from satellite-linked and pop-up archival
dive, Supplementary Figure 3a). Intermediate Pelagic dives tags revealed that EBS male belugas employ diverse dive profiles;
also frequently followed other dive types (Supplementary with differing time spent at various depths, descent and ascent
Figure 3a). The deepest dive types (Deep Benthic and Deep rates, vertical movements during the bottom phases of dives, and
Pelagic V) had longer post-dive surface intervals before post-dive behavior to exploit the three-dimensional habitat they
making a dive of the same type (median = 5.00 min, occupy over an annual cycle. Belugas notably altered their dive
Supplementary Table 3b) than before making a Shallow V behavior depending on seafloor depth, sea ice concentration, and
dive type (median 3.75 min) or an Intermediate Pelagic dive season; accepting that the sample size was small for winter and
type (median = 2.50 and 3.00 min, respectively, p < 0.001, spring. Here we develop hypotheses for the potential functions
Supplementary Table 3c). of dive types when considering physiological constraints and
optimal foraging theory (summarized in Table 2). Future targeted
work using ancillary data on animal acoustics and acceleration
Seasonal Dive Behavior can be used to test these hypotheses. Seasonal dive behavior is
Beluga whales exhibited distinct changes in the frequency of discussed in relation to prey distribution, and provides evidence
dive types over an annual cycle (Figure 8), identified through of year-round foraging, but with strategies varying by season. The
Tukey’s tests following zero-inflated negative binomial GLMMs dive characteristics and seasonal frequency of dive types classified
(Table 3). During summer, belugas made the greatest number here will be key for establishing baselines to determine ongoing
of Deep Benthic dives (Table 3 and Figure 8); for example impacts of climate change and human-induced disturbance
beluga LC2018#1 made 50 Deep Benthic dives to ∼450 m in on EBS beluga whales; including bioenergetics and regional
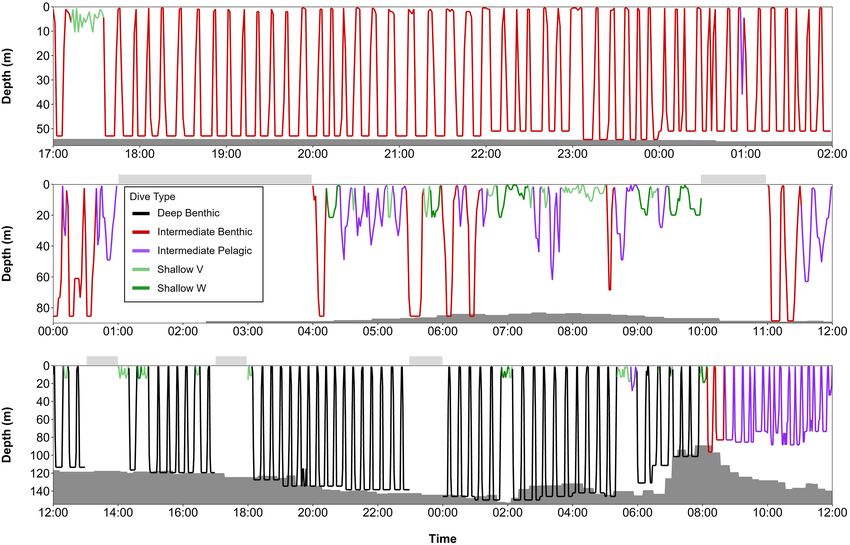
Viscount Melville Sound over a 24-h period in July (Figure 9A). impact assessments.
In June, belugas recorded fewer Deep Benthic dives (e.g., 9 vs.
47% of hours with ≥2 dives in June vs. August, Figure 8),
concomitant with their late spring/early summer distribution Dive Structure and Potential Function in
over the deeper waters of the Beaufort Slope (Figures 3, 6). Eastern Beaufort Sea Belugas
As expected, belugas made deeper Deep Benthic dives in this Foraging Dives
region than in the Arctic Archipelago regions (Figure 3); beluga In marine mammals, deep dives with rapid descent rates
LC2018#6 recorded 21 Deep benthic dives to between 890 and such as the Deep Benthic, Deep Pelagic V, Deep Pelagic W,
1,070 m along the Beaufort Slope over a 24-h period in June and Intermediate Benthic dives classified here, are primarily
(Figure 9B). During fall, belugas made significantly fewer Deep associated with foraging (e.g., Lefebvre et al., 2018; Barlow et al.,
Benthic dives (p = 0.042, Table 3), and significantly more Deep 2020). Deep diving is energetically costly, and optimal foraging
Pelagic V and W type dives (p ≤ 0.004, Table 3), both of which theory predicts that as distance required to capture and consume
were recorded in greatest numbers in September (30% of hours prey increases, diving predators should optimize the time spent
with ≥ 1 Deep Pelagic V dive, 26% of hours with ≥ 1 Deep Pelagic in the foraging patch (Mori, 1998), which has been validated with
W dive, Figure 8). Beluga LC2018#3, for example, recorded 10 ancillary data in seals (Thums et al., 2013; Viviant et al., 2014) and
Deep Pelagic V and 43 Deep Pelagic W dives over a 24-h period baleen whales (Doniol-Valcroze et al., 2011; Friedlaender et al.,
in the region around the Mendeleev Ridge during September 2020). This suggests these dives exhibited by beluga whales are
(Figure 9C). From mid-fall through winter, belugas made large most likely related to foraging behavior. Alternate explanations
numbers of Intermediate Benthic dives whilst occupying the for deep diving include predator avoidance or anthropogenic
Chukchi and then the Bering Sea (Figures 4, 5), that occurred disturbance (Miller et al., 2015; Aguilar de Soto et al., 2020). Killer
in greater frequency than any other dive type (46–75% of hours whales (Orcinus orca), represent the only fully aquatic predator
with ≥ 3 Intermediate Benthic dives from October through of EBS belugas and are present in the Bering and Chukchi Seas
February, Figure 8). Such extensive Intermediate Benthic is (Seger and Miksis-Olds, 2020), and infrequently in the Beaufort
exemplified by beluga LC2018#3, that recorded 51 dives to Sea (Higdon et al., 2013); while vessel traffic is increasing over
∼50 m over a 9-h period in the Chukchi Sea during November much of the EBS beluga’s range (Dawson et al., 2018). Belugas
(Figure 10A). Between fall and spring belugas tended to decrease may change their surface movement patterns and vocalizations
the frequency at which they made Intermediate Benthic dives, in response to killer whales and vessels (Westdal et al., 2016; Erbe
and increase the frequency of Intermediate Pelagic and Shallow et al., 2019; Seger and Miksis-Olds, 2020), however, a deep diving
W dives (p < 0.001, Table 3 and Figure 8, see series of dives by response is yet to be observed.
beluga LC2018#6; Figure 10B). The frequency of Deep Benthic The aerobic dive limit (ADL) of adult belugas with a high body
dives increased again as belugas moved northeastwards toward condition index is estimated at 17.4 min (Choy et al., 2019), which
the Beaufort Sea in late spring (Figures 6, 8), via deeper waters is close to the average dive durations of the two deepest dive
over Barrow Canyon and the Beaufort Slope. Shallow V dives classes reported here (Deep Benthic = 16.25 min and Deep Pelagic
were recorded in high numbers throughout the year (Figure 8), V = 17.25 min, Table 2). Deep Pelagic W dives were instead
but tended to occur most frequently during the summer, although shorter than the belugas’ ADL on average, and rarely exceeded
this was not significant (p ≥ 0.069, Table 3). this limit (median duration = 13.75 min, see Table 2). These long
Frontiers in Marine Science | www.frontiersin.org 12 January 2022 | Volume 8 | Article 715412Storrie et al. Year-Round Beluga Dive Characteristics
FIGURE 8 | Proportional frequency of number of each dive type per hour by month, color-coded by dive type and shaded by dive frequency. Hours with ≥3 dives of
a given dive type combined into a single group for display.
dive durations (maximum = 32.5 ± 1.25 min, and see Table 2) (median = 2.00 min, and see Figure 9C), suggesting that belugas
indicate that EBS belugas sometimes exceed their ADL, a finding were diving well within their ADL for this dive type. Conversely,
previously reported for belugas in the eastern Canadian Arctic the Deep Benthic and Deep Pelagic V dive types typically did
(Martin and Smith, 1999). There is uncertainty as to how some not include vertical movements during the bottom phase. This
species may continuously exceed their ADL, however, ADL is may suggest that prey biomass outweighs the energetic costs of
variable and depends on how oxygen stores are used during a making these two deep dive types, which frequently exceeded
dive (Kooyman et al., 2021). Conservation of energy in repetitive the ADL of 17.4 min (Choy et al., 2017), and were associated
deep diving (e.g., Figure 9), may be facilitated by a decrease in with the longest post-dive surface intervals among all dive types
animal buoyancy with depth (Aoki et al., 2017), or use of slower (3.75 and 5.00 min, respectively, Table 2). We suggest that these
movements or stroke and glide motions as observed in other dives involved feeding on prey which is aggregated at a consistent
marine mammals (Costa, 1991; Williams, 2001; Arranz et al., depth and/or of higher quality than for shallower dive types.
2019). Feeding kinematics may also vary between dive types; Deep Benthic dives are comparable to “square” shaped dives
belugas can undertake both ram and suction feeding, with the previously identified for EBS belugas (Richard et al., 1997), and
latter likely to play a more important role during benthic dives those from the Eastern High Arctic (Martin et al., 1998), which
(Kane and Marshall, 2009). Such a strategy could require a lower were also proposed as benthic foraging dives. Deep dives with
metabolic rate than ram feeding, and enable conservation of a distinct V-shape (short bottom duration), comparable to Deep
oxygen stores for longer dives. Pelagic V dives here, have instead been proposed as exploratory
Differences between the time-depth structures of the dive or aborted dives (Martin et al., 1998). In shallow dives there may
types agree with time allocation models (Houston and Carbone, be a net energetic benefit for an animal to prematurely return
1992). As the vertical distance to and from a foraging patch to the surface before reaching its ADL if no prey is encountered
increases, the time spent in the foraging patch should increase up early in the dive (Thompson and Fedak, 2001). For deeper dives,
to a point, and then decrease when the travel duration becomes however, the physiological benefit of prematurely returning to the
large. This supports the longer bottom phase of the Deep Pelagic surface is reduced (Jouma’a et al., 2016), hence we propose that
W dive type than the shallower dive types; and the shorter the Deep Pelagic V dive type represents a pelagic foraging dive
bottom phases of Deep Benthic and Deep Pelagic V dive types with a bottom phase constrained by depth and beluga physiology.
relative to Deep Pelagic W dives. Vertical movements during Alternatively, bottom phase duration may be shortened due
the bottom phases of Deep Pelagic W dives could represent to recent ingestion of prey (Favilla and Costa, 2020); beluga
searching or pursuit of prey, as has been suggested in other stomach temperature may drop by 22.3◦ C after an ingestion event
studies on belugas and narwhals (Martin et al., 1994, 1998). (Gallagher et al., 2021), and diversion of blood to the stomach to
Despite possible lowering of the ADL due to the increased diving facilitate digestion may result in a return to the surface before
metabolic rate associated with pursuing prey (Thums et al., 2013), ADL is reached (Thompson and Fedak, 2001), or a decrease
these dives were followed by short post-dive surface intervals in their ADL for subsequent foraging due to the metabolism
Frontiers in Marine Science | www.frontiersin.org 13 January 2022 | Volume 8 | Article 715412Storrie et al. Year-Round Beluga Dive Characteristics
required for digestion (Rosen et al., 2007). A short bottom phase
Estimate Standard p-value Estimate Standard p-value Estimate Standard p-value Estimate Standard p-value Estimate Standard p-value Estimate Standard p-value Estimate Standard p-valueStorrie et al. Year-Round Beluga Dive Characteristics
rapid descent rate of these dives represented searching the water Amundsen Gulf; as well as the Beaufort Slope, have previously
column for prey patches. Such behavior may be represented been identified as hotspots for the EBS beluga population from
by some of the Intermediate Pelagic dives here, however, the mid to late summer (Loseto et al., 2006; Hauser et al., 2014). In the
much slower average rate of descent in this study compared to current study, deep dives in these regions were almost exclusively
Lefebvre et al. (2018) (0.21 vs. 0.87 m/s), provides support for benthic, with dives averaging 16.25 min and frequently reaching
their use in recovery or transiting. Alternatively, Intermediate depths over 400 m (Figures 3, 9A). These results contrast those
Pelagic dives could represent some social function, as suggested of Hauser et al. (2015), where maximum dive durations recorded
for the comparable “state 1” dives in short-finned pilot whales in the Beaufort Sea and Amundsen Gulf were typically 6–9 min,
(Globicephala macrorhynchus) (Quick et al., 2017). and targeted the mid-water column at depths of 200–300 m.
This may be a result of sex differences; three of the four tagged
Diving to Navigate Sea Ice EBS belugas examined in Hauser et al. (2015) were females. EBS
Both Shallow W and Intermediate Pelagic type dives occurred belugas are known to segregate by sex and age classes during
more frequently in regions with greater ice concentrations, and late summer, with females using shallower open water habitat,
Shallow W dives occurred more frequently in spring when EBS and large males using deeper ice-covered habitat (Loseto et al.,
belugas migrate into the Beaufort Sea through leads in the sea ice 2006). Mature males are larger than females, and differential
(Hornby et al., 2016). EBS belugas encounter dense sea ice over habitat use may support distinct foraging strategies and dietary
much of their range, including closed sea ice during summer in composition among age and sex classes (Loseto et al., 2006, 2008).
Viscount Melville Sound (Barber et al., 2001; Loseto et al., 2006), In sexually dimorphic marine mammals, larger individuals often
implying that they must undertake some subsurface activity have a greater physiological capacity to dive for longer and to
to locate breathing holes. Richard et al. (1997) suggested that greater depths which may enable targeting of prey patches which
V-shaped dives reaching 700–900 m could be used in locating are of higher quality or greater density (Michaud, 2005; Newland
breathing holes in ice-covered regions, as they were only made et al., 2009). Adult male belugas from the EBS population are
in deep waters of the Arctic Basin with heavy ice cover; however, thought to rely more on large offshore Arctic cod (Boreogadus
the energetic costs and often long recovery times associated with saida) during summer than females and younger males (Loseto
reaching such depths raise questions on whether this is their et al., 2009; Choy et al., 2020), which is found in high abundance
primary function, and we instead propose that belugas use the and dominates the demersal fish assemblage during summer
shallower dive types to locate breathing holes. along the Canadian Beaufort slope and in Viscount Melville
Sound (Majewski et al., 2013, 2017; Bouchard et al., 2018). In the
Drift Dives Amundsen Gulf, deep aggregations of Arctic cod may disperse
The Deep Pelagic Skew dive was the only dive characterized by summer (Geoffroy et al., 2011), however, their abundance
by having unequal phases of descent and ascent to and from was highest near the sea floor during surveys conducted in
the bottom phase, and was the least frequently recorded dive 2018 and 2019 (Andrew Majewski, Fisheries and Oceans Canada,
type. Skewed dives have been commonly identified as drift unpublished data). Arctic cod have been identified down to
dives in pinnipeds, whereby the animal’s buoyancy assists in 1,000 m along the Beaufort Slope and remain near the seafloor
travel efficiency and may enable partitioning of metabolism from February to September (Geoffroy et al., 2016; Majewski
toward digestion (Crocker et al., 1997; Arce et al., 2019). Such et al., 2016), which could explain the benthic dives made by EBS
dives have been identified less frequently in cetaceans, but belugas in May and June (Figures 3, 6, 9B). Inuvialuit hunters
have been proposed as energetically efficient drift dives (Simon report that belugas harvested during summer sink, whereas those
et al., 2009), or exploratory dives with an active searching harvested during fall float due to their thicker blubber and the
or foraging component (Lefebvre et al., 2018). Dives with higher salinity of the water (Dennis Arey, Aklavik, personal
unequal descent and ascent rates were present in other dive communication). Together, this suggests that deep foraging close
types (see Supplementary Figures 2h–o and Table 2), but to the seafloor during summer could be critical for male belugas
were not classified into skewed types as the ascent/descent and to rebuild their blubber layer after the spring migration and
descent/ascent metrics had weaker loadings with the first two summer estuarine molting periods. The prevalence of Arctic
principal components than the other metrics (Supplementary cod in the summer diet of EBS male belugas and the overlap
Tables 2g–k). EBS belugas undergo seasonal changes in blubber between beluga dive depth and the vertical distribution of Arctic
thickness (Harwood et al., 2014), which would support the cod identify that belugas were primarily targeting this species.
potential use of drift diving. Such behaviors were likely Other fish species found in this region including Greenland
underrepresented in this study and future work should examine halibut (Reinhardtius hippoglossoides), capelin (Mallotus villosus),
changes in rates of vertical movement during the descent and and Canadian eelpout (Lycodes polaris) (Majewski et al., 2017)
ascent phases (Arce et al., 2019) to identify whether this is an contribute to the male beluga diet (Choy et al., 2020), and are
important component of beluga behavior. likely targeted when there is a lower abundance of Arctic cod.
The observation of a small number of Deep Pelagic V dives in
Seasonal Variation in Dive Behavior summer (Figures 3, 8) could be linked to EBS belugas targeting
Summer fronts or stratified layers as noted for the Eastern Chukchi Sea
Areas within the western Arctic Archipelago including the deep beluga population (Citta et al., 2020). However, the principal use
trench within Viscount Melville Sound, the M’Clure Strait, and of Deep Benthic dives indicates that feeding close to benthos,
Frontiers in Marine Science | www.frontiersin.org 15 January 2022 | Volume 8 | Article 715412Storrie et al. Year-Round Beluga Dive Characteristics
FIGURE 9 | Series of dives over 24-h periods from summer and early fall, color-coded by dive type: (A) beluga LC2018#1 on 23rd July 2018 (74.30◦ N, 110.68◦ W,
Viscount Melville Sound), (B) beluga LC2018#6 on 18th June 2019 (70.55◦ N, 137.81◦ W, Beaufort slope), and (C) beluga LC2018#3 on 27th September 2018
(77.10◦ N, 178.12◦ W, Mendeleev Ridge). Gray shaded areas denote seafloor depth; dive depth sometimes exceeds the estimated seafloor depth due to error in the
bathymetric maps, CTCRW-modeled locations, and dive depth. Horizontal bars above each plot denote periods with missing data. All times in UTC. Note the
different y-axes scales. Locations of dive profiles shown in Figure 1.
including at depths ≥1,000 m, is more important for EBS observe such behavior in EBS belugas; the Eastern Chukchi
belugas. While belugas are known to undertake other behaviors Sea population recorded a higher proportion of modal depths
in shallow coastal regions during the summer, including molting in the 100–200 m and >400 m depth bins than in the 50–
(at 2–4 m depth; Smith et al., 1992; Whalen et al., 2020), the 100 or 300–400 m depth bins, suggestive of similar behaviors.
depth sampling frequency and dive threshold used here would The diet of EBS belugas during this period is not well-known
have underrepresented this behavior. as dietary studies have only been undertaken during spring
and summer (Quakenbush et al., 2015; Loseto et al., 2018;
Early Fall Choy et al., 2020). There is also a paucity of information
Eastern Beaufort Sea belugas occupied diverse bathymetric on the distribution and assemblage of fishes in the Central
habitats during fall, from deep waters of the Arctic Basin to Arctic Ocean, although Arctic cod are known to inhabit the
the shallow Chukchi Sea, explaining large variation in dive region (Snoeijs-Leijonmalm et al., 2020). The greater energetic
behavior observed during this period (Figures 4, 8). Benthic costs associated with Deep Pelagic V dives could require a
diving to >800 m along the Beaufort, Chukchi, and East Siberian higher biomass of prey to be targeted than in the Deep
slopes (Figure 4) could represent feeding on Greenland halibut, Pelagic W dives, suggesting vertical segregation among prey
which is found in greatest abundance at seafloor depths ≥500 m species, or among size classes within a prey species (e.g.,
(Majewski et al., 2017), when Arctic cod in the Beaufort Sea Geoffroy et al., 2016). Alternatively, prey may undertake diel
redistribute into the mesopelagic layer in fall (Geoffroy et al., vertical migrations leading to the formation of aggregations
2016; Pettitt-Wade et al., 2021). EBS belugas principally made at certain times of day whereby belugas would benefit from
two deep dive types in the Arctic Basin: deeper Deep Pelagic V switching between the depth layers targeted to optimize food
and shallower Deep Pelagic W dives (Figures 8, 9C), suggesting intake. This strategy has previously been observed in other
that two different depth layers were targeted at ∼100–300 m cetaceans (Friedlaender et al., 2015; Arranz et al., 2019).
and >500 m (Table 2). Whilst Hauser et al. (2015) did not Further studies are needed on diel patterns in dive behavior
Frontiers in Marine Science | www.frontiersin.org 16 January 2022 | Volume 8 | Article 715412Storrie et al. Year-Round Beluga Dive Characteristics
FIGURE 10 | Series of dives from late fall and spring, color-coded by dive type: (A) beluga LC2018#3 on 17th November 2018 (68.94◦ N, 171.82◦ W, Chukchi Sea)
over a 9-h period, (B) beluga LC2018#6 on 21st March 2019 (63.48◦ N, 176.50◦ W, Bering Sea) over a 12-h period, and (C) beluga LC2018#2 on 17th May 2019
(71.48◦ N, 157.16◦ W, Barrow Canyon) over a 24-h period. Gray shaded areas denote seafloor depth; dive depth sometimes exceeds the estimated seafloor depth
due to error in the bathymetric maps, CTCRW-modeled locations, and dive depth. Horizontal bars above each plot denote periods with missing data. All times in
UTC. Note the different x and y axes scales used due to missing data in surrounding hours and/or to improve visualization of dive structure. Locations of dive profiles
shown in Figure 1.
in EBS belugas, and on the assemblage and distribution of shown that a higher number of dives per unit time may be
prey in the region. indicative of lower foraging success, or feeding on lower quality
prey (Viviant et al., 2014), hence extensive use of lower quality
Late Fall Through Spring prey cannot be ruled out. Energetic gains may still be substantial
From late-fall to mid-spring, the advance of fast ice limits the during this time due to the lower costs of shallower foraging, with
EBS beluga distribution to the Chukchi, then the Bering Sea implications for the timing of migration toward deeper summer
(Hauser et al., 2017a; Supplementary Figure 3b). Belugas made habitats which may be more energetically costly, but more
Intermediate Benthic dives with great frequency (Figure 8), nutritious. Future work is required to analyze horizontal and
suggesting that foraging occurs throughout this period. The vertical movement data in relation to environmental covariates
durations of these dives were well within the ADL of belugas to address this question.
(Choy et al., 2019), precluding the need to rest for long periods on Eastern Beaufort Sea belugas typically mate during winter
the surface and enabling belugas to dive frequently (Figure 10A). and spring (Suydam, 2009), and likely in the Bering Sea. Beluga
This could enable belugas to be less selective over prey consumed socio-sexual behaviors have been observed at the surface (Lomac-
than on deeper dives made in summer and early fall. The Macnair et al., 2015), and sexual dimorphism in this species
northern Bering and southern Chukchi Seas contain a large suggests male-male competition occurs (Kelley et al., 2015).
and diverse benthic biomass (Grebmeier et al., 2018), and the Reproductive behaviors, however, have only been characterized in
large number of invertebrate and fish taxa, including greater captive animals (Hill et al., 2015), and are not well-documented
prevalence of octopus and shrimp than Arctic cod identified in wild belugas. The increase in frequency of Intermediate Pelagic
in the stomachs of EBS belugas harvested during their spring dives in March (Figures 8, 10B) indicates a distinct change in
migration (Quakenbush et al., 2015), support a more generalist behavior at this time. Belugas are highly social, forming multi-
feeding strategy in this region than in the Beaufort Sea during scale societies with related and un-related individuals of different
summer. Moreover, studies on other marine mammals have ages and sexes (O’Corry-Crowe et al., 2020), and have the capacity
Frontiers in Marine Science | www.frontiersin.org 17 January 2022 | Volume 8 | Article 715412Storrie et al. Year-Round Beluga Dive Characteristics
to produce social calls at depths up to 300 m (Ridgway et al., targeted ancillary data on acoustics, video, and/or acceleration to
2001). As such, the possibility that certain dive types represent advance our understanding of EBS beluga dive functions.
social behaviors in belugas cannot be excluded. The observed The variable dive strategies observed in male EBS belugas
increase in Intermediate Pelagic dives could alternatively suggest and their potential for targeting different prey types and/or
a seasonal shift toward more pelagic feeding on fish ascending prey occurrence at different depth zones support flexibility
to shallower depths after the ice-edge break up and increase within this population. The lack of historically comparable
in surface productivity (Geoffroy et al., 2011; Supplementary data limits interpretation related to climate change impacts or
Figure 3b). Barrow Canyon is an important summer habitat for effects, however, these dive types provide a baseline to monitor
the Eastern Chukchi Sea beluga population, where they tend to changes in beluga dive behavior over time, and a foundation
make pelagic dives targeting fronts and stratified layers (Stafford for bioenergetics modeling to examine the costs and gains
et al., 2018; Citta et al., 2020), however, the three EBS belugas of dive behavior.
which transmitted through spring all passed via this region
and principally made benthic dives (Figures 6, 10C), implying
important benthic foraging grounds for EBS belugas during DATA AVAILABILITY STATEMENT
their northward migration. It should be noted that few belugas
transmitted during late winter and spring (n = 3), hence there The datasets presented in this article are available upon
may be more variability in the population than was represented reasonable request. Requests should be directed to LL
by these individuals. (Lisa.Loseto@dfo-mpo.gc.ca) and will be reviewed by the
Inuvialuit Game Council and Fisheries and Oceans Canada.
CONCLUSION
ETHICS STATEMENT
Understanding the vertical movement behavior of marine
mammals, especially those inhabiting the extremes of the Arctic The following approvals were required for whale capture and
environment is key for establishing baselines on the energetic handling procedures: DFO License to Fish for Scientific Purposes
costs and gains of specific behaviors, and for determining ongoing (S-18/19-3020-YK and S-19/20-3020-YK), Freshwater Institute
impacts of climate change and human-induced disturbance. Animal Care Committee permit (FWI-ACC-2018-24 and FWI-
We provide the first comprehensive analysis of the time-depth ACC-2019-29), and Letter(s) of Support from Inuvialuit Hunters
structures of dives for any beluga population throughout an and Trappers Committees.
annual cycle and across their entire range, and present hypotheses
on dive functions. Despite undertaking long migrations and
having seasonal distributions constrained by sea ice, EBS male AUTHOR CONTRIBUTIONS
belugas exhibit dive characteristics which suggest year-round
foraging with the strategies used dependent on region and season. LS performed all data analyses, wrote the manuscript, and created
Likely foraging dives in the Chukchi Sea and Bering Sea from all figures and tables. LL and SM led on program implementation
late fall through winter were shallow (∼50 m), were within and secured the funding and partnerships. LS, LL, NH, SM,
the calculated aerobic dive limit and required short recovery and GO’C-C conceptualized the study and collected the data.
times between dives, suggesting they are energetically cheap. LL, NH, SM, and GO’C-C planned the field programs. LL and
In contrast, dives from late spring through early fall along the NH were involved in critical discussions of the manuscript
Beaufort slope, Arctic Archipelago and Arctic Basin regions with LS throughout the process. LL, NH, SM, GO’C-C, JI, and
were deeper and longer, often exceeding the aerobic dive limit. DB supported early discussions with LS regarding objectives
Diving during this period is likely more energetically costly, but and methods, and revised the manuscript. AN developed and
diet and prey distribution data suggest they may provide high adapted the divebomb package. All authors approved the final
energetic gains due to the prevalence of Arctic cod in the diet submitted version.
during summer compared to a more generalist diet during early
spring. Male belugas primarily targeted the seafloor for foraging
in all regions except the Arctic Basin; where they undertook FUNDING
two deep pelagic dive types, potentially to optimize targeting
of prey which is vertically segregated by species or size class, Funding was provided by the Crown-Indigenous Relations
or undertakes diel vertical migrations. The high frequency of and Northern Affairs Canada (Beaufort Regional Strategic
shallow V-shaped dives in all regions and seasons, as well as the Environmental Assessment), the Fisheries and Oceans Canada
shorter recovery times associated with deeper dive types if they (Intergovernmental Strategy, Strategic Program for Ecosystem-
were followed by this dive type supports their use in recovery based Research and Advice, National Conservation Plan), the
and transiting. Two dive types (Shallow W and Intermediate Fisheries Joint Management Committee (Tarium Niryuitait
Pelagic) were made more frequently in regions with higher ice Marine Protected Area Funds, Anguniaqvia niqiqyuam Marine
concentrations, suggesting their use in navigating through sea ice. Protected Area Funds, FJMC Core Funds), and the Natural
Future studies can now focus in certain regions and incorporate Resources Canada (Polar Continental Shelf Program).
Frontiers in Marine Science | www.frontiersin.org 18 January 2022 | Volume 8 | Article 715412You can also read