Work-From-Home Productivity and Job Satisfaction: A Double-Layered Moderated Mediation Model - MDPI
←
→
Page content transcription
If your browser does not render page correctly, please read the page content below
sustainability

Article
Work-From-Home Productivity and Job Satisfaction:
A Double-Layered Moderated Mediation Model
Kellyann Berube Kowalski 1 , Alex Aruldoss 2 , Bhuvaneswari Gurumurthy 3                              and Satyanarayana Parayitam 1, *

                                          1   Department of Management and Marketing, Charlton College of Business University of Massachusetts
                                              Dartmouth, North Dartmouth, MA 02747-2300, USA
                                          2   Department of Commerce (Bank Management) and Business Administration (Computer Applications),
                                              St. Joseph’s College of Arts & Science (Autonomous), Cuddalore 607001, India
                                          3   Department of Commerce (Bank Management), St. Joseph’s College of Arts & Science (Autonomous),
                                              Cuddalore 607001, India
                                          *   Correspondence: sparayitam@umassd.edu

                                          Abstract: This study was conducted against the backdrop of the global-pandemic-induced change in
                                          work climate resulting in employees working from home (WFH). The current study investigated the
                                          relationship between work-from-home productivity (WFHP) and job satisfaction. Using a structured
                                          survey instrument, data were collected from 1158 respondents from a developing country, India.
                                          After checking the psychometric properties of the measures using the LISREL software of structural
                                          equation modeling (SEM), data were analyzed using Hayes’s PROCESS macros. The findings indicate
                                          that: (i) WFHP positively predicts (a) job satisfaction and (b) work–life balance (WLB), (ii) WLB
                                          positively predicts job satisfaction, and (iii) WLB mediates the relationship between WFHP and job
                                          satisfaction. The results also support that (i) work stress moderates the relationship between WFHP
                                          and WLB, (ii) work–personal life enhancement (WPLE) (second moderator) moderates the moderated
                                          relationship between WFHP and work stress (first moderator) in influencing WLB, (iii) emotional
Citation: Kowalski, K.B.; Aruldoss,       exhaustion moderates the relationship between WLB and job satisfaction, and (iv) WPLE (second
A.; Gurumurthy, B.; Parayitam, S.         moderator) moderates the relationship between WLB and emotional exhaustion (first moderator) in
Work-From-Home Productivity and           influencing job satisfaction. The first three-way interaction between WFHP, work stress, and WLB
Job Satisfaction: A Double-Layered        and the second three-way interaction between WLB, emotional exhaustion, and job satisfaction have
Moderated Mediation Model.                been investigated for the first time, to the best of our knowledge. The conceptual double-layered
Sustainability 2022, 14, 11179.
                                          moderated mediation model is a novel idea, and the results significantly contribute to the literature
https://doi.org/10.3390/
                                          on WLB and job satisfaction. The implications for theory and practice are discussed.
su141811179

Academic Editor: Delia Vîrgă              Keywords: work–life balance; job satisfaction; work from home; emotional exhaustion; work stress;
                                          moderated mediation; India
Received: 2 August 2022
Accepted: 31 August 2022
Published: 7 September 2022

Publisher’s Note: MDPI stays neutral      1. Introduction
with regard to jurisdictional claims in
                                               The unprecedented COVID-19 global pandemic has resulted in a phenomenal meta-
published maps and institutional affil-
                                          morphosis in the lives of people and organizations worldwide [1–3]. To prevent the spread
iations.
                                          of the virus, governments imposed frequent lockdowns and social distancing. Organi-
                                          zations did not have any alternative but to request employees to work remotely [4,5].
                                          This study was conducted against the backdrop of this global-pandemic-induced WFH of
Copyright: © 2022 by the authors.         employees in a developing country, India.
Licensee MDPI, Basel, Switzerland.             The separation of work from family has remained an exciting topic for organizational
This article is an open access article    behavior and psychology researchers for over three decades [6–10]. Often, employees
distributed under the terms and           struggle to balance their work demands and personal priorities and preferences, resulting
conditions of the Creative Commons        in a work–life imbalance. To help employees effectively balance work and life, organizations
Attribution (CC BY) license (https://     offer flexible working hours, remote working, or work from home (WFH) [11–13]. Several
creativecommons.org/licenses/by/          researchers documented that, in order to maintain a work–life balance (WLB), remote
4.0/).

Sustainability 2022, 14, 11179. https://doi.org/10.3390/su141811179                                  https://www.mdpi.com/journal/sustainability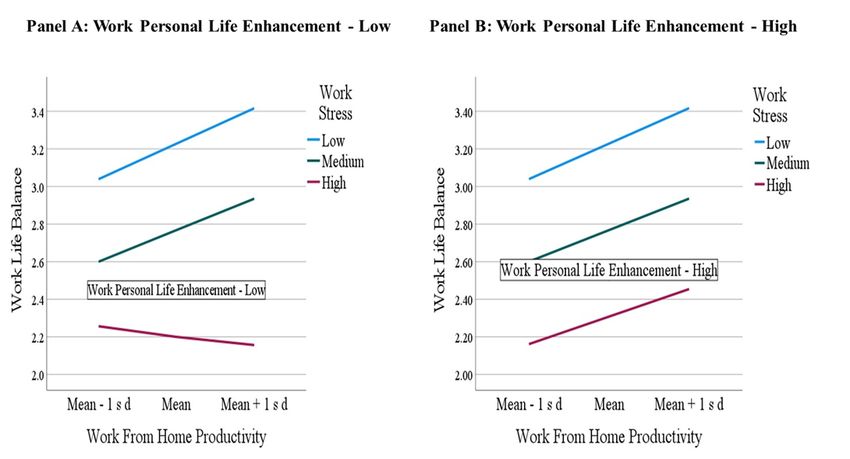
Sustainability 2022, 14, 11179                                                                                           2 of 29

                                 working or WFH is one of the essential tools where individuals can effectively balance
                                 office work and homework [14,15].
                                       The COVID-19 global pandemic (COVID-19) has made WFH a rule worldwide [16,17].
                                 Even before the pandemic, employees in developed countries were fully aware of the
                                 concept of remote working. However, in developing countries such as India, WFH was a
                                 rare phenomenon. In addition, organizations in developing countries were not equipped
                                 with adequate infrastructure to facilitate remote working. The global pandemic has forced
                                 almost all of the institutions to switch to WFH, though the infrastructure does not facilitate
                                 such a sudden shift.
                                       This research investigates the effect of work-from-home productivity (WFHP) on
                                 employees’ job satisfaction, especially considering the global-pandemic-imposed work
                                 climate in organizations. During the COVID-19 period, several articles were published
                                 documenting the problems associated with the pandemic in various sectors (manufacturing
                                 and services), changes in consumer behavior, the supply chain, ways of operating in
                                 educational institutions, etc. [5,18,19]. Therefore, our intent in this paper is to unfold the
                                 relationships between the variables that the scar of the pandemic left on organizations. As
                                 the first step in that direction, we examine the boundary conditions of WFHP leading to
                                 employees’ job satisfaction.
                                       Most importantly, we dwell on some of the most researched areas: work–life balance
                                 (WLB), work stress, emotional exhaustion, and work–personal life enhancement (WPLE).
                                 As the pandemic resulted in many organizations shifting to the work-from-home mode
                                 of operations, the psychological stress employees have experienced increased in alarming
                                 proportions [17,20]. Furthermore, to compensate for the loss of working days because of
                                 mandatory lockdowns and social distancing, employees were required to stretch their work,
                                 resulting in stress and emotional exhaustion [3,21]. Therefore, organizations embarked on
                                 resilient strategies to cope with the changes in the work climate [22,23].
                                       This study is aimed at investigating the relationship between WFHP and WLB. Fur-
                                 ther, this research focuses on explaining how WFHP results in job satisfaction. Since the
                                 employees during the post-pandemic period experience stress and emotional exhaustion,
                                 this study aims to see how emotional exhaustion influences the relationships between
                                 WFHP, WLB, and job satisfaction. Most importantly, in this research, we explain how
                                 WPLE alleviates the adverse effects of work stress and emotional exhaustion and how it
                                 helps to enhance job satisfaction.
                                       This study makes five contributions to the literature on WFH and WLB. First, the study
                                 indicates that WFH productivity positively predicts WLB and job satisfaction. Thus, the
                                 results extend the growing mountain of research in organizational behavior and psychology
                                 related to employee satisfaction. Second, global-pandemic-induced telecommuting and
                                 remote working has increased both work stress and emotional exhaustion, thus adversely
                                 affecting job satisfaction and disturbing the WLB of employees. In this study, we found that
                                 employees who feel more stressed at work had a low level of WLB. Further, the emotional
                                 exhaustion faced by employees adversely affected their job satisfaction. Third, in order
                                 to alleviate the adverse effects of work stress, this study found that WPLE can be used
                                 as a strategy.
                                       When employees can take positive experiences of work to home and positive feelings
                                 of home to work, they are able to maintain work–personal life enhancement, which would
                                 reduce the negative impact of work stress on WLB. Fourth, this study found that WPLE
                                 also counters the negative effect of emotional exhaustion on job satisfaction. Finally,
                                 the conceptual model presented, and the hypotheses tested are the first of their kind to
                                 investigate the global-pandemic-induced work environment in the context of a developing
                                 country. It is a novel contribution to the literature on WLB and WFH. To sum up, this study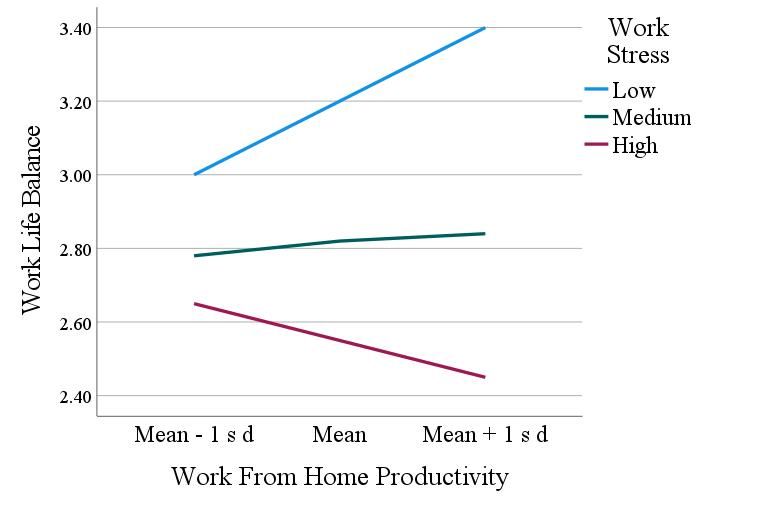
Sustainability 2022, 14, 11179                                                                                          3 of 29

                                 offers some suggestions for increasing the job satisfaction of the employees who work
                                 from home.

                                 2. Literature Review and Variables in the Study
                                       The variables used in this study are work from home productivity (WFHP), work-
                                 life balance (WLB), work stress, emotional exhaustion, work personal life enhancement
                                 (WPLE), and job satisfaction. We cover the literature review about each of the variables in
                                 the following sub-sections.

                                 2.1. WFHP
                                      When organizations implement WFH strategies in the present-day context of the
                                 global pandemic, employees’ productivity plays a vital role in organizational performance.
                                 Work-from-home productivity (WFHP) refers to the quality of work of employees and the
                                 extent of the motivation to perform better. Employee productivity also depends on the
                                 amount of technical knowledge and authority to complete given tasks at home. Further,
                                 productive workers tend to clear the targets set by the employer and, if necessary, obtain
                                 instructions from the employer to complete the given tasks. As documented in the literature,
                                 WFH enhances worker productivity [24], and it is essential to see the effect of productivity
                                 on satisfaction [25,26]. Some researchers contend that working at home allows employees to
                                 avoid workplace stress and politics in offices [11,27], thus increasing productivity. During
                                 the global pandemic, as employees are forced to WFH, they save commuting time, which
                                 can be used productively to complete given tasks. Further, employees feel psychologically
                                 safe at home because they are not exposed to the virus-driven physical environment during
                                 the pandemic. Though some scholars evidenced that WFH may decrease productivity
                                 and result in an increase in work–family conflicts (WFC), a lack of options compels the
                                 employees to show productivity to maintain their job status [28].

                                 2.2. WLB
                                      WLB is concerned with how individuals can maintain the balance between the de-
                                 mands from work and non-work activities and promote their priorities at both work and
                                 home without sacrificing. The studies in [29,30] contend that it is not easy to maintain
                                 WLB. Furthermore, WLB is a self-determined and self-defined state that may differ across
                                 individuals. Some can manage multiple demands from work and also at home, whereas
                                 some may not be able to achieve a happy balance between these [31]. An increase in family
                                 demands may hurt WLB [32].
                                      Research on WLB is very exhaustive [30,33–38]. It was found that WLB is positively
                                 associated with organizational commitment [39], job satisfaction [40], societal demands [41],
                                 and increased productivity [42].

                                 2.3. Emotional Exhaustion
                                       The pioneers of the construct [43], contend that emotional exhaustion is an essential
                                 component of burnout. When employees are overburdened by work, they feel exhausted
                                 and realize that their energies are burning out. There has been substantial evidence that
                                 emotional exhaustion has deleterious consequences: a low performance, high turnover,
                                 and low commitment [44–47]. There is consensus among organizational scholars that the
                                 urgency of performance and pressures results in emotional exhaustion, adversely affecting
                                 satisfaction [48–51].

                                 2.4. Work Stress
                                      Also known as job stress, workplace stress comes from the psychosocial work environment,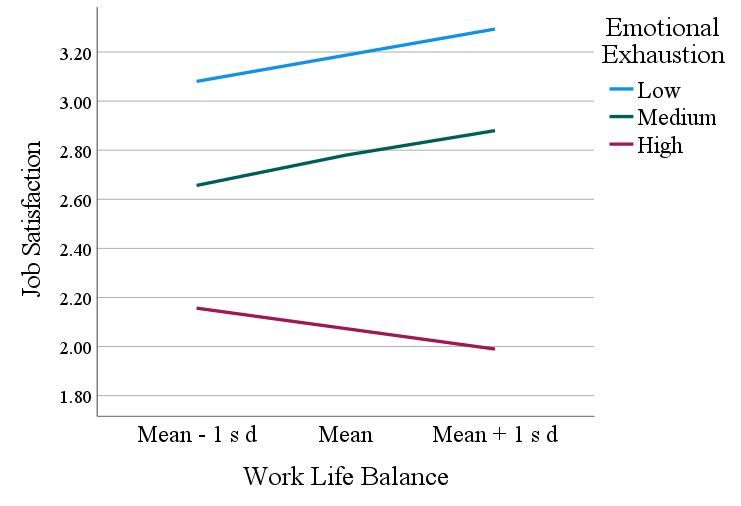
Sustainability 2022, 14, 11179                                                                                             4 of 29

                                 increased workload, role ambiguity, role conflict, and lack of supervisor support [52–54].
                                 Stress also may stem from incompatibility of the worker ability and work demands, known
                                 as a person–environment misfit [22]. Sometimes, stressful situations from the environment
                                 or uncertainties do not allow employees to perform their duties [55,56]. An example of
                                 stress created by the environment is the global-pandemic-induced stress, where individuals
                                 undergo psychological stress to maintain health and keep themselves from contacting
                                 the virus.
                                       Extant research has identified the antecedents of work stress: job conflict, role con-
                                 flict [57,58], and non-collegiality and increasing demands from the supervisors [59]. A
                                 majority of researchers reported that work stress is negatively related to the physical health
                                 of employees and WLB [14,60,61].

                                 2.5. WPLE
                                       Also labeled as work–life enrichment, work–personal life enhancement (WPLE) is
                                 related to “how positive experiences in work and non-work (home) lives interact to produc-
                                 tivity gains in satisfaction, health, and performance” [62]. While a supportive organizational
                                 climate, social support from the peers, and family-friendly human resources management
                                 strategies are the antecedents to WPLE, outcomes include work engagement, performance,
                                 commitment, and job and family satisfaction [63–65].

                                 2.6. Job Satisfaction
                                      One of the widely studied dependent variables in the literature on organizational
                                 behavior and personnel psychology is ‘job satisfaction’ [66]. Job satisfaction is defined as
                                 a “pleasurable or positive emotional state resulting from the appraisal of one’s job or job
                                 experiences” [67] (p. 1304). Job satisfaction is a global measure that involves an individual’s
                                 evaluation of the job situation and various aspects of the job [68–70]. In this research, the
                                 primary dependent variable is job satisfaction, which was studied in connection with the
                                 productivity of employees performing work from home.

                                 3. Theoretical Background and Hypotheses Development
                                        The happy-productive worker thesis (HPWT) [71,72] provides a theoretical back-
                                 ground for this research. The basic tenet of HPWT is that employees who are happier or
                                 more satisfied with their jobs likely perform better in the jobs [73]. There is compelling evi-
                                 dence that the productivity–satisfaction relationship is bi-directional, as revealed by a meta-
                                 analysis conducted by [68], and that productivity is likely to lead to satisfaction [74–77].
                                 Further, [72] demonstrated that the productivity–satisfaction relationship would be stronger
                                 if it is operationalized more broadly than job satisfaction. The employee well-being and
                                 work–life balance would boost the performance of employees on the job. When individuals
                                 can assess their satisfaction with work and life and maintain a balance between these
                                 two [34], it is more likely that WLB leads to job satisfaction. As documented by [77], em-
                                 ployees maintaining WLB are more motivated and productive and less stressed, and an
                                 increased productivity results in higher levels of job satisfaction. This research uses the con-
                                 structs productivity (WFHP), work stress, emotional exhaustion, and job satisfaction. The
                                 HPWT framework would help to explain the relationship between these variables [78,79].
                                        Using the HPWT framework, we developed a double-layered moderated mediation
                                 model (Figure 1) to explain the relationship between work-from-home productivity and
                                 job satisfaction. We will now discuss each connection in the model. The conceptual model
                                 is presented in Figure 1.
Sustainability 2022, 14, x FOR PEER REVIEW 5 of 29
Sustainability 2022, 14, 11179 5 of 29
Figure 1. Conceptual model.
Figure 1. Conceptual model.
3.1. WFHP and Job Satisfaction
3.1. WFHP and Job Satisfaction
Organizations implement WFH policies to give the employees more flexibility in
Organizations
performing work andimplement WFH
to increase policies to give
productivity the employees
[80–82]. moredocumented
Extant research flexibility in per-
sev-
forming work and to increase productivity [80–82]. Extant research
eral benefits of WFH, including an improved performance, reduced employee turnover, documented several
benefits of WFH,
and increased jobincluding an[24,26,27].
satisfaction improved Since
performance, reduced employee turnover,
the productivity–satisfaction and
relationship
increased
has been welljob satisfaction
established in[24,26,27]. Since the productivity–satisfaction
the organizational relationship
behavior and industrial psychology has
litera-
been well established
ture [66,83], it is morein the organizational
likely that WFHP leads behavior
to joband industrialThough
satisfaction. psychology
someliterature
scholars
[66,83], it isthe
argue that more likely that WFHP leads and
productivity/performance to job satisfaction.
satisfaction Though some
relationship scholars
is spurious andargue
that
that the productivity/performance
a definite cause-and-effect is unknown and satisfaction relationship
[84,85], a majority is spurious
of the and that a that,
studies evidenced def-
inite
whencause-and-effect is unknownthey
employees are productive, [84,85], a majority
are likely of the studies
to be satisfied evidencedwe
[57]. Therefore, that, when
offer the
employees are productive,
following hypothesis basedthey are likelyempirical
on abundant to be satisfied [57]. Therefore, we offer the fol-
evidence.
lowing hypothesis based on abundant empirical evidence.
Hypothesis 1 (H1): WFHP positively predicts job satisfaction.
Hypothesis
3.2. WFHP and 1 (H1):
WLBWFHP positively predicts job satisfaction.
Ever since
3.2. WFHP and WLBthe concepts of telecommuting (or WFH) and flexible working hours have
been introduced in organizations, there has been resounding evidence that employees are
happy,Ever since the and
productive, concepts of telecommuting
maintain a healthy WLB(or WFH)Earlier,
[86–88]. and flexible workingused
organizations hours tohave
give
been introduced
employees in organizations,
the option there has been
of using telecommuting or resounding
remote working evidence that days
on some employees are
in a week
happy, productive, and maintain a healthy WLB [86–88]. Earlier,
so that they maintain a happy balance between their work and life. Now, considering the organizations used to
give employees the option of using telecommuting or remote
global pandemic, remote working has become a rule rather than an exception because of working on some days in a
week so that they maintain a happy balance between their work
periodical lockdowns and social distancing practices worldwide [16,17]. As a flexible workand life. Now, consider-
ing the globalteleworking
arrangement, pandemic, remote has been working
recognizedhas become
as a viablea rule ratherinthan
solution crisisansituations,
exceptionsuch
be-
cause of periodical
as a global pandemic. lockdowns
Though, inand social distancing
developing countries practices worldwide
such as India, WFH as[16,17]. As is
a concept a
flexible work arrangement, teleworking has been recognized as a viable
relatively new and not regularly practiced, individuals and families are getting adjusted to solution in crisis
situations,
the change suchin work as culture.
a globalScant
pandemic.
research Though, in developing
that focused countriesbetween
on the relationship such as WFHP
India,
WFH as a concept is relatively new and not regularly practiced,
and WLB indicates that employees are happy because they are able to protect their health individuals and families
are
from getting adjustedby
being affected tothe
thedeadly
changepandemic
in work culture.
and alsoScant
remain research that in
productive focused onget
order to thepaid
re-
lationship
(instead of between
being laidWFHP andlogic
off). The WLB indicates
behind that employees
a positive association areofhappy
WFHPbecause
with WLB they are
stems
able
fromtothe protect theirwhen
fact that, health from being
employees areaffected by the deadly
more productive, the pandemic
pressures andfromalso remain
employers
productive
will be low in andorder
hence to workers
get paid (instead
will be ableof being laid off).
to devote theirThe
timelogic behind athe
to meeting positive
demands as-
sociation of WFHP with WLB stems from the fact that, when employees
from life. On the contrary, when the productivity is low, demands from employers will are more produc-
tive, the and
be high pressures
thus will from notemployers
allow the will be low
workers and hence
to focus workers will
on life-related be ableAnecdotal
demands. to devote
their timereveals
evidence to meeting the demands
that employees who from
show life. Onproductivity
high the contrary,inwhen theable
jobs are productivity
to maintain is
low, demands
a balance betweenfromtheir employers
work and willlives.
be high andbased
Thus, thus onwillthe
not allow the
available workersevidence
empirical to focus
on life-related
before and during demands.
the global Anecdotal
pandemic, evidence
we offerreveals that employees
the following hypothesis: who show high
productivity in jobs are able to maintain a balance between their work and lives. Thus,Sustainability 2022, 14, 11179 6 of 29
Hypothesis 2 (H2): WFHP positively predicts WLB.
3.3. WLB and Job Satisfaction
Though challenging, balancing work and life with individuals is indispensable to main-
taining job and life satisfaction [89]. In a large study conducted by [37] on 1416 employees
from seven distinct populations (Malaysian, Chinese, New Zealand Maori, New Zealand
European, Spanish, French, and Italian), WLB is strongly and positively associated with job
satisfaction and life satisfaction. Past researchers documented that happy individuals at
home also tend to be satisfied at work [13,90]. In one of the recent studies conducted in
Indonesia, researchers reported that WLB strongly and positively influenced job satisfac-
tion [91]. Abundant research provided evidence that employees who are high on balancing
life and work tend to derive more job satisfaction. The literature reviews of [10,40,42,92]
advocated that WLB has positive outcomes: job satisfaction, job performance, organiza-
tional commitment, and life satisfaction. Based on available abundant empirical support,
we offer the following hypothesis:
Hypothesis 3 (H3): WLB positively predicts job satisfaction.
3.4. WLB as a Mediator
Organizational psychologists contend that employee productivity is related to hedonic
and eudaimonic satisfaction [93,94]. However, most importantly, productivity indirectly
affects satisfaction through employee well-being, which can be seen in terms of WLB.
In other words, WFH enables the employees to attend to the demands stemming from
non-work activities while meeting the employer’s demands. This WLB is essential for the
well-being of individuals, which, in turn, results in job satisfaction. That is to say, WFHP
may have both direct and indirect effects through WLB on job satisfaction.
When employees can distribute time to be spent on work and their personal lives,
work–family conflicts will be low, and satisfaction will be high [24,95–97]. In this study, we
contend that WFH increases productivity and performance. At the same time, it will enable
the employees to balance the demands of life and work, contributing to satisfaction. Based
on the logos and intuitive appeal, we offer the following exploratory hypothesis:
Hypothesis 4 (H4): WLB mediates between WFHP and job satisfaction.
3.5. First Stage Moderation of Work Stress
Work stress, also known as job stress or occupational stress, occurs when there is a
mismatch between an individual’s capabilities and requirements and resources for complet-
ing a task [98,99]. Work stress is related to the psychological and physiological reactions to
the conditions that employees face in the workplace and has adverse effects on employee
well-being and health [100]. Researchers report that some of the antecedents of work stress
include job conflict, role conflict [57,58], non-collegiality, and increasing demands from the
supervisors [59]. In addition, extant research reported that work stress is negatively related
to the physical health of employees and WLB [14,61].
Direct effects of work stress on job satisfaction and commitment aside, in this study,
we argue that work stress changes the strength of the relationship between WFHP and
WLB. Since the negative relationship between work stress and WLB has been established in
some studies [57,61], it would be interesting to study the role of work stress as a moderator.
In a recent study conducted on 369 employees working in banking and high-tech industries
in Taiwan, researchers found that long working hours resulted in work stress adversely
affecting the WLB and satisfaction [101]. As some studies during the global pandemic
found that work stress adversely affected the performance of employees [3,102], we contend
that work stress would significantly alter the positive association between WFHP and
WLB. Abundant literature on the stress and mental health of the healthcare and frontline
workers during the global pandemic reveals adverse consequences on anxiety [103] and
WLB [104]. This study investigates work stress as a boundary condition influencingSustainability 2022, 14, 11179 7 of 29
the relationship between WFHP. Based on the above, we offer the following exploratory
moderation hypothesis:
Hypothesis 2a (H2a): Work stress moderates between WFTP and WLB such that low (high) level
work stress strengthens (weakens) the relationship.
3.6. Second Stage Moderation of WPLE
As work interfering with life (WIL) and life interfering with work (LIW) are inherent
phenomena, these effects on WLB largely depend on how the employees work towards
enhancing both work and life. Work’s role in individuals’ lives plays a crucial role because
work is the source of income. Hence, employees generally consider work as essential
and derive energy and motivation by performing work satisfactorily. At the same time,
individuals tend to enjoy life because the goal of work is to spend life happily. Therefore,
the spillover from work to life and life to work should be understood in order to see the
effect of spillover on WLB. When a job gives energy to life and vice versa, employees
tend to move towards enhancing both work and life. In a recent study conducted among
283 employees working in the information technology sector in India, WLB positively
predicted employee retention and psychological empowerment [105].
Employees differ in managing their work and life domains [106]. However, some can
effectively navigate by employing strategies to combat imbalance by focusing on the energy
that they obtain from work and life. For example, though there is resounding evidence that
working long hours increases work stress, employees feel that it is necessary to complete the
demanding tasks in order to succeed professionally. Therefore, they attempt to rationalize
their work and maintain sustainable WLB, which is rewarding. In other words, individuals
may implement strategies to enhance the work–life interface to counter the negative effect
of work stress on WLB. Following this logic, it would be interesting to see the impact
of WPLE (second moderator) on the relationship between WFTP and work stress (first
moderator) influencing WLB. Thus, we offer the following exploratory hypothesis:
Hypothesis 2b (H2b): WPLE moderates the relationship between WFTP and work stress to
influence WLB.
3.7. Third Stage Moderation of Emotional Exhaustion
It was evidenced by previous researchers, as discussed in the earlier sections, that WLB
was positively associated with job satisfaction [74,107]. From the viewpoint of employees,
it is essential to see how emotional exhaustion, which is related to physical fatigue and
a personal drain of energy, affects job satisfaction [43]. Extant research reported that an
unreasonable workload and time pressure in completing work might result in emotional
exhaustion [108]. Previous studies examined the adverse effects of emotional exhaustion on
employee turnover, commitment, and performance [44,46,109]. In a recent study conducted
on Norwegian school principals, [110] found that emotional exhaustion was negatively
related to job satisfaction.
While the adverse effects of emotional exhaustion on performance and satisfaction
were well documented [111,112], some scholars studied the moderating role of emotional
exhaustion in the relationship between role ambiguity and workload and performance [51].
During the global pandemic, employees worldwide have undergone severe emotional
exhaustion, as has been reported by several scholars [113,114]. Exploring the moderating
role of emotional exhaustion in the WLB–job satisfaction relationship would be interesting.
Tying emotional exhaustion to the consequences of WLB is another study objective.
Individuals differ in how they feel exhausted at work; hence, the effect of WLB on job
satisfaction depends on the strength of the emotional exhaustion that they experience. Since
emotional exhaustion is a part of work-related stress, the greater the emotional exhaustion
employees feel because of overburdened work, the more likely the positive relationship
between WLB and job satisfaction would be affected. Conversely, under lower emotional
exhaustion, the effect of WLB on job satisfaction would be lesser when compared to higherSustainability 2022, 14, 11179 8 of 29
levels of emotional exhaustion. Though previous studies did not dwell on the moderating
effect of emotional exhaustion, we offer the following exploratory hypothesis:
Hypothesis 3a (H3a): Emotional exhaustion moderates between WLB and job satisfaction such
that lower (higher) levels of emotional exhaustion interacting with WLB would result in higher
(lower) job satisfaction.
3.8. Fourth Stage Moderation of WPLE
Past researchers documented that the spillover between work and personal life plays
an important role [115,116]. To counter the negative effect of emotional exhaustion, we
contend that positive energy derived from work and life helps to alleviate the negative
impact of emotional exhaustion on job satisfaction. Over a decade ago, [117] empirically
demonstrated that work–family enrichment was a mediator in the relationship between
WLB and job outcomes. Sometimes, organizational interventions such as supportive work
culture, human resource policies promoting family-friendly relations, and social support
at the workplace contribute to WPLE. Previous researchers have established a positive
relationship between organizational interventions and work–family enrichment [62,118].
Though positive outcomes of WPLE are understandable, it would be interesting
to explore how WPLE helps to alleviate the ill effects of emotional exhaustion on job
satisfaction. To the best of our knowledge, the moderating role of WPLE in influencing
individual outcomes in terms of job commitment, performance, and satisfaction has not
been extensively studied by past researchers. In the context of employees working from
the home because of the global pandemic, WPLE plays a vital role in smoothening the
relationship between WLB and job satisfaction by reducing the negative effect of emotional
exhaustion. The three-way interaction between WLB, emotional exhaustion, and WPLE
is not simply an academic exercise, and we argue that it would benefit the individuals by
enhancing job satisfaction. Based on the positive effects of WLB on job satisfaction, adverse
effects of emotional exhaustion on job satisfaction, and positive influence of WPLE, we
offer the following exploratory moderated moderated-mediation hypothesis:
Hypothesis 3b (H3b): WPLE moderates the relationship between WLB and emotional exhaustion
to influence job satisfaction.
4. Method
4.1. Sample
Since the focus of this research is to investigate the impact of productivity of employees
working remotely, especially during the COVID-19 pandemic, the respondents consisted
of employees working from home. In India, as in other countries worldwide, many
organizations resorted to work from home (WFH) to avoid spreading the virus. Therefore,
we preferred to use Google forms to collect the data because of social distancing norms and
periodical lockdowns. This has been followed by several researchers collecting surveys
during the global pandemic [119,120].
According to the sample size tables prescribed by [121], the minimum required sample
size when the population is over 100,000 is 384. Further, [122] recommends that a sample
size of over 500 is considered very good (100 = poor; 200 = fair; 300 = good; 500 = very
good; 1000 or more = excellent). Considering the post-pandemic scenario, we contacted the
respondents personally and asked them to fill out the surveys using Google forms to collect
the data. It took nearly six months to collect completed surveys from 1158 respondents.
Thus, the final analysis consisted of 1158 completed surveys, considered ‘excellent’.
4.2. Data Collection
The respondents were from the southern part of India. Four research students were
involved in collecting data, and visited the houses of these respondents, following the
COVID-19 restrictions of wearing face masks and taking necessary precautions. First, we
contacted the supervisors of organizations and secured information about the employees.Sustainability 2022, 14, 11179 9 of 29
We made sure that the organizations asked the employees to work from home. We asked a
qualifying question, “Did you work from home during the global pandemic?”, and sug-
gested that they proceed only if the answer was ‘Yes’. We followed convenience sampling,
as some respondents were not filling out surveys, and, during the global pandemic, it was
challenging to have a probability-based sample. Many researchers use snowball sampling
to collect data by submitting Google forms [16,123,124]. In order to have representativeness,
we concentrated on obtaining as many respondents as possible. We tested for non-response
bias by comparing the first 100 responses to the final 100 responses and found no statistically
significant difference between these groups.
4.3. Demographic Profile
The respondents were 529 (45.68%) males and 629 (54.32%) females. As far as age is
concerned, 286 (24.78%) were less than 25 years old, 598 (51.64%) were between 25–30 years
old, 132 (11.4%) were between 30–40 years old, 93 (8.03%) were between 40 and 50 years
old, and 49 (4.23%) were over 50 years old. Regarding education, 196 (16.93%) had a high
school diploma, 129 (11.14%) had an undergraduate (bachelors) degree, 159 (13.73%) had a
professional degree, 533 (46.03%) had a post-graduate (masters’ degree), and 141 (12.18%)
had vocational education.
With regard to annual income, 235 (20.29%) had less than INR (Indian Rupees)
300,000 (USD 4000), 710 (61.31%) had income between INR 300,000–600,000 (USD 4000–USD
8000), 105 (9.07%) had income between INR 600,000–900,000 (USD 8000–USD 12000), 57
(4.92%) had income between INR 900,000–1,200,000 (USD 12,000–USD 16,000), and 51
(4.40%) had income over INR 1,200,000 (USD 16,000). As far as family type is concerned,
437 (37.74%) had a joint family system, and 721 (62.26%) had a nuclear family system. As far
as the number of dependents is concerned, 308 (26.60%) had 2 dependents, 531 (45.85%) had
2–4 dependents, 223 (19.26%) had 4–6 dependents, and 96 (8.29%) had over 6 dependents.
4.4. Measures
This study used six constructs, and the measures were adapted from the previously
tested and validated sources. A five-point Likert scale (‘5’ = strongly agree; ‘1’ = strongly
disagree) was used to measure the constructs. The constructs, indicators, and sources of
these constructs are presented in Table 1.Sustainability 2022, 14, 11179 10 of 29
Table 1. Confirmatory factor analysis.
Average
Variance-
Standardized
Reliability Variance Extracted
Constructs and the Sources of the Measures Alpha CR Loadings
(λ2 yi ) (Var(εi )) Estimate
(λyi )
Σ (λ2 yi )/
2
[(λ yi ) + (Var(εi ))]
WFHP [125] 0.93 0.94 0.60
I am very productive while working from home. 0.76 0.58 0.42
I feel that the quality of the work I carry out during working from home is better. 0.79 0.62 0.38
Working from home is personally beneficial for me at work. 0.81 0.66 0.34
Working from home motivates me to work better. 0.77 0.59 0.41
I have sufficient technical knowledge in completing work during working from home. 0.77 0.59 0.41
I have sufficient authority in carrying out work during working from home. 0.78 0.60 0.40
I have clear work targets when working from home. 0.80 0.64 0.36
My boss is concerned about my well-being during working from home. 0.77 0.59 0.41
I receive technical assistance from my workplace in completing work during working from home. 0.74 0.55 0.45
I can concentrate on getting work done even when there are distractions from family members during
0.76 0.57 0.43
working from home.
WLB [126–128] 0.91 0.91 0.56
I have adequate time to spend with the family even if I work in the organization or at home. 0.74 0.55 0.45
I have sufficient time to take care of my children even if I work in the organization or at home. 0.76 0.58 0.42
I have enough time to take care of elderly dependents even if I work in the organization or at home. 0.76 0.58 0.42
I am not missing important social occasions even if I work in the organization or at home. 0.74 0.54 0.46
I can maintain my work and family with a proper schedule even if I work in the organization or at home. 0.77 0.59 0.41
I have enough time to take medical health checkups even if I work in the organization or at home. 0.75 0.56 0.44
My personal life does not suffer because of work. 0.70 0.49 0.51
I do not neglect personal needs because of work. 0.75 0.57 0.43
Work Stress [129] 0.89 0.89 0.57
I am discouraged about my work. 0.70 0.49 0.51
I feel many things are beyond my control and ability while working from home. 0.76 0.57 0.43
I feel overwhelmed by completing work during working from home. 0.77 0.60 0.40
I feel like giving up on work during working from home. 0.74 0.54 0.46
I feel unable to get out from my work during working from home. 0.78 0.61 0.39Sustainability 2022, 14, 11179 11 of 29
Table 1. Cont.
Average
Variance-
Standardized
Reliability Variance Extracted
Constructs and the Sources of the Measures Alpha CR Loadings
(λ2 yi ) (Var(εi )) Estimate
(λyi )
Σ (λ2 yi )/
[(λ2 yi ) + (Var(εi ))]
I feel frustrated with my work-from-home job. 0.79 0.62 0.38
Job Satisfaction [130] 0.88 0.88 0.59
I am satisfied with my current job. 0.78 0.61 0.39
I am satisfied with my current co-workers. 0.78 0.60 0.40
I am satisfied and feel happy with my current boss. 0.81 0.65 0.35
I am satisfied with my current salary. 0.67 0.44 0.56
Overall, I am satisfied with my current job. 0.81 0.66 0.34
WPLE [96] 0.84 0.85 0.58
Personal life gives me energy for my job. 0.77 0.59 0.41
My job gives me energy to pursue personal activities. 0.76 0.57 0.43
I have a better mood at work because of personal life. 0.78 0.61 0.39
I have a better mood because of my job. 0.74 0.55 0.45
Emotional Exhaustion [131] 0.85 0.85 0.60
I have felt emotionally drained from my work. 0.77 0.59 0.41
I have felt used up at the end of the workday. 0.77 0.59 0.41
I have felt fatigued when getting up in the morning and having to face another day on the job. 0.81 0.66 0.34
I have felt burned out from my work. 0.74 0.54 0.46Sustainability 2022, 14, 11179 12 of 29
WFHP was measured with ten items adapted from [125]. The sample items read as: “I
am very productive while working from home” and “I feel that the quality of the work I do
during working from home is better”. The reliability coefficient of WFHP was 0.93.
WLB was measured with eight items adapted from [126–128]. The sample items read
as: “I have an adequate time to spend with the family even if I work in the organization or at
home” and “I have sufficient time to take care of my children even if I work in organization
or at home”. The reliability coefficient Cronbach’s alpha of WLB was 0.91.
Work stress was measured with six items adapted from [129]. The sample items read
as: “I am discouraged about my work” and “I feel many things are beyond my control and
ability while working from home”. The reliability coefficient Cronbach’s alpha of work
stress was 0.89.
Job satisfaction was measured with five items adapted from [130]. The sample items
read as “I am satisfied with my current job”, and “I am satisfied with my current co-
workers”. The reliability coefficient of job satisfaction was 0.88.
WPLE was measured with four items adapted from [96]. The sample item reads as:
“Personal life gives me energy for my job” and the reliability coefficient of WPLE was 0.84.
Emotional exhaustion was measured with four items adapted from [131]. The sample
item reads as: “I have felt emotionally drained from my work”, and the reliability coefficient
of emotional exhaustion was 0.85.
5. Analysis and Findings
5.1. Measurement Model and Confirmatory Factor Analysis (CFA)
As [132] suggested, we followed a two-step approach to checking the measurement
and structural models. We used the LISREL software of structural equation modeling (SEM)
to check the measurement model and performed a confirmatory factor analysis (CFA). The
results of CFA are presented in Table 1.
As shown in Table 1, the factor loadings for all of the indicators are over 0.70, except
for one indicator for job satisfaction, which is 0.67. Since this is a well-established measure,
we retained this indicator in the analysis. The reliability coefficient (Cronbach’s alpha) for
all six constructs was over 0.70, and the composite reliability (CR) values were over 0.70.
Further, the average variance-extracted (AVE) estimates for all of the six constructs was
greater than 0.50, and these statistics vouch for the measures’ reliability, convergent validity,
and internal consistency [133,134].
5.2. Convergent Validity, Discriminant Validity, and Common Method Bias
To establish discriminant validity, the square root of AVEs of the variables must exceed
the correlations between the variables [135]. In this research, discriminant validity is said
to be established when the square root of AVEs of the variables exceeds the correlations
between the variables [136,137].
The correlation between WFHP and WLB is 0.56, and the square root values of AVE
are 0.77 and 0.75, respectively. Similarly, the correlation between emotional exhaustion and
WLPE is −0.60, and the square roots of AVE are 0.77 and 0.76, respectively. For all other
variables, the correlations between the variables were less than the square root of AVEs,
thus providing support for discriminant validity between the variables.
We also compared the baseline six-factor model with five other alternative models,
and the results are presented in Table 2.
A comparison of measurement models reveals that the six-factor model fit the data
well (χ2 = 2160.36; df = 650; χ2 /df = 3.32; root mean square error of approximation (RMSEA)
= 0.045; root mean square residual (RMR) = 0.042; standardized RMR = 0.030; comparative
fit index (CFI) = 0.946; goodness of fit index (GFI) = 0.942). A comparison of five alternative
models with the baseline model (see Table 2) shows that the goodness of fit indices (RMSEA
< 0.08; CFI > 0.90; and other indices) provided a good fit of the model to the data [138].Sustainability 2022, 14, 11179 13 of 29
Table 2. Comparison of measurement models.
Standardized TLI =
Factors χ2 df ∆χ2 RMSEA RMR CFI GFI
RMR NNFI
Null 28,719.23 703
Six Factors: WFHP, WLB, WS, JSAT,
Baselinemodel 2160.36 650 0.045 0.042 0.030 0.946 0.942 0.904
WLPE, EMOEX
Five-Factor Model: WFHP, +WLB;
Model 1 5418.44 655 3258.08 * 0.079 0.103 0.075 0.830 0.818 0.663
WS; JSAT; WLPE; EMOEX
Four-Factor Model: WFHP, +WLB +
Model 2 6692.27 659 4531.91 * 0.089 0.107 0.076 0.785 0.770 0.599
WS; JSAT; WLPE; EMOEX
Three-Factor Model: WFHP, +WLB + WS
Model 3 8194.41 662 6034.05 * 0.099 0.118 0.085 0.731 0.714 0.558
+JSAT; WLPE; EMOEX
Two-Factor Model: WFHP, +WLB +
Model 4 8825.12 664 6664.76 * 0.103 0.121 0.087 0.709 0.692 0.544
WS + JSAT + WLPE; EMOEX
One-Factor Model: WFHP, +WLB+
Model 5 9562.98 665 7402.62 * 0.107 0.123 0.089 0.682 0.664 0.528
WS + JSAT + WLPE + EMOEX
* p < 0.01. WFHP = work-from-home productivity; WLB = work–life balance; WS = work stress; JSAT = job
satisfaction; WLPE = work–personal life enhancement; EMOEX = emotional exhaustion.
5.3. Descriptive Statistics and Multicollinearity
The descriptive statistics consisting of means, standard deviations, and zero-order
correlations are presented in Table 3.
Table 3. Descriptive statistics: means, standard deviations, and zero-order correlations.
Standard
Mean 1 2 3 4 5 6 Alpha CI AVE
Deviation
1. WFHP 3.94 0.96 0.77 0.93 0.94 0.60
2. WLB 3.76 0.90 0.56 *** 0.75 0.91 0.91 0.56
3. Work Stress 4.30 0.93 −0.53 *** −0.74 *** 0.75 0.89 0.89 0.57
4. Emotional Exhaustion 4.25 0.92 −0.52 *** −0.60 *** 0.64 *** 0.77 0.85 0.85 0.60
5. WPLE 3.99 0.95 0.64 *** 0.56 *** −0.52 *** −0.60 *** 0.76 0.84 0.85 0.58
6. Job Satisfaction 4.09 0.98 0.61 *** 0.49 *** −0.47 *** −0.50 *** 0.66 *** 0.77 0.88 0.89 0.59
*** p < 0.01. CI = composite reliability; AVE = average variance extracted; numbers in the diagonals are square
root of AVE.
An assessment of multicollinearity requires observing correlations between the vari-
ables because correlations exceeding 0.75 signify the presence of multicollinearity [139]. The
highest correlation was −0.74 (between WLB and work stress) and the lowest correlation
was −0.47 (between work stress and job satisfaction). As an additional check, we verified
the variance inflation factor (VIF) and noted that the values were less than 5 for all of the
variables, suggesting that multicollinearity is not a problem with the data [140].
5.4. Common Method Variance
We checked the common method variance (CMV) in three ways. First, we performed
Harman’s single-factor test, as suggested by [141], and found that a single factor accounted
for less than a 25% variance (less than 50%), signifying that CMV is not a problem with
the data. Second, we compared the goodness of statistics of the one-factor model with
the six-factor model (see Table 3) and found that the one-factor model was a poor fit of
the data (χ2 = 9562.98; df= 665; χ2 /df = 14.38; RMSEA = 0.107; RMR = 0.123; standardized
RMR = 0.089; CFI = 0.682; GFI = 0.528). Third, we performed a latent-factor method wherein
all of the indicators were loaded into a single factor each time and checked the VIF values
and found that these values were less than 3.3. If the VIF values are more than 3.3 the
data indicate the existence of pathological collinearity and the model is inferred to be
contaminated by common method variance [142]. All three tests indicate that CMV is not a
problem in this research.
5.5. Hypotheses Testing
The structural model was tested using [143] PROCESS macros. We used model #4 for
testing H1–H4 and present the results in Table 4.Sustainability 2022, 14, 11179 14 of 29
Table 4. Testing H1, H2, and H3.
DV = Job Satisfaction DV = WLB H2 DV = Job Satisfaction
Step 1 Step 2 Step 3
Coeff se T p Coeff se t p Coeff se t p
Constant 1.2766 0.0732 17.4467 0.0000 1.2304 0.0708 17.3859 0.0000 0.9852 0.0800 12.3096 0.0000
WFHP H1 0.6191 0.0237 26.1420 0.0000 0.5194 0.0229 22.6764 0.0000 0.4961 0.0277 17.8951 0.0000
WLB H3 0.2369 0.0296 7.9985 0.0000
R-square 0.371 0.308 0.404
F 683.40 514.21 392.30
df1 1 1 2
df2 1156 1156 1155
p 0.0000 0.0000 0.0000
Total Effect
Total Effect se t p LLCI ULCI
0.6191 0.0237 26.1420 0.0000 0.5726 0.6656
Direct
Effect
Direct Effect se t p LLCI ULCI
WFHP → Job Satisfaction 0.4961 0.0277 17.8951 0.0000 0.4417 0.5505
Bootstrapping Indirect Effect (H4)
BOOT BOOT BOOT
Indirect Effect
se LLCI ULCI
WFHP → WLB → Job 0.1230 (0.5194 ×
0.0221 0.0829 0.1692
Satisfaction 0.2369 = 0.1230)
Notes: N = 1158, Boot LLCI = bootstrapping lower limit confidence interval, Boot ULCI = bootstrapping upper
limit confidence interval. The results were based on 20,000 bootstrapping samples [p < 0.05]. It is recommended to
use four decimal digits because some values may be very close to zero.
Step 1 from Table 4 shows that the regression coefficient of WFHP on job satisfac-
tion was positive and significant (β = 0.619, t = 26.14; p < 0.001). The results based on
20,000 bootstrap samples show that the 95 percent bias-corrected confidence interval (BCCI)
was 0.5726 (LLCI) and 0.6566 (ULCI). These results support H1 in that WFHP positively
predicts job satisfaction.
Hypothesis 2 proposes that WFHP positively impacts WLB. The regression coefficient
of WFHP on WLB (step 2, Table 4) was positive and significant (β = 0.519; t = 22.67;
p < 0.001). The 95 percent (BCCI), i.e., LLCI and ULCI, was 0.4745 and 0.5644, respectively,
thus supporting H2.
Hypothesis 3 posits that WLB positively predicts job satisfaction. Step 3 (Table 4)
shows that the regression coefficient of WLB on job satisfaction was positive and significant
(β = 0.236; t = 7.99; pSustainability 2022, 14, 11179 15 of 29
of WLB on job satisfaction (0.2369) [i.e., (0.5194 × 0.2369 = 0.2369). The indirect effect of
WFHP WLB job satisfaction was significant, thus corroborating support of H4.
5.5.1. Testing the Moderated and Moderated Mediation Hypotheses (H2a and H2b)
We used Model #11 of [143] PROCESS macros to check the two-way and three-way
interactions and present the results in Table 5.
Table 5. Testing of H2a (two-way interaction) and hypothesis 2b (three-way interaction) [R2 = 0.599].
DV = WLB
Variables Coeff se t p LLCI ULCI
Constant 3.4084 0.6905 4.9360 0.0000 2.0536 4.7632
WFHP 0.0341 0.2131 0.1598 0.8731 −0.3841 0.4523
Work Stress −0.6502 0.1548 −4.1991 0.0000 −0.9540 −0.3464
WPLE 0.0823 0.2061 0.3993 0.6897 −0.3221 0.4868
WFHP × Work Stress H2a 0.1164 0.0507 2.2956 0.0219 0.0169 0.2160
WFHP × WPLE 0.0729 0.0561 1.3005 0.1937 −0.0371 0.1829
WPLE × Work Stress 0.0757 0.0502 1.5089 0.1316 −0.0227 0.1742
WFHP × Work Stress × WPLE H2b −0.0468 0.0137 −3.4221 0.0006 −0.0737 −0.0200
R-square 0.599
F 246.11
df1 7
df2 1150
p 0.0000
Conditional effects of the focal predictor (WLB) at values of moderators (Work Stress × WPLE)
Work Stress WPLE Effect se T p LLCI ULCI
Low Low 0.2315 0.0532 4.3514 0.0000 0.1271 0.3359
Low Medium 0.1963 0.0365 5.3788 0.0000 0.1247 0.2679
Low High 0.1611 0.0354 4.5485 0.0000 0.0916 0.2305
Medium Low 0.2502 0.0355 7.0508 0.0000 0.1805 0.3198
Medium Medium 0.1743 0.0250 6.9842 0.0000 0.1253 0.2233
Medium High 0.0984 0.0287 3.4328 0.0006 0.0422 0.1547
High Low 0.2688 0.0345 7.7871 0.0000 0.2011 0.3365
High Medium 0.1523 0.0313 4.8601 0.0000 0.0908 0.2138
High High 0.0358 0.0398 0.8990 0.3688 −0.0423 0.1139
Moderator value(s) defining Johnson–Neyman significance region(s)
Value % below % above
3.5264 75.1295 24.8705
As shown in Table 5, the regression coefficient of the interaction term (WFHP × work
stress) was significant (βWFHP × work stress = 0.1164; t = 2.2956; p < 0.05; Boot LLCI (0.0169);
Boot ULCI (0.2160). These results support H2a. The two-way interaction is presented
in Figure 2.
As shown in Figure 2, at high levels of work stress, WFHP is associated with low WLB.
Further, the slope of the line representing high work stress is negative and the slope of the
line representing low work stress is positive, thus supporting the hypothesis that work
stress moderates the relationship between WFHP and work stress (H2a).Sustainability 2022, 14, 11179 16 of 29
Hypothesis 2b posits that WPLE (second moderator) and work stress (first moder-
ator) interact with WFHP to influence WLB. The regression coefficient of the three-way
interaction was significant (β WHFP × work stress × WPLE =−0.047; t = −3.42; p < 0.01). The
conditional effects of the WLB at values of moderators work stress and WPLE are presented
at the bottom of Table 5. The indirect effect of WFHP on job satisfaction is mentioned
in Table 6.
Table 6. Indirect effect (WFHP → WLB → Job Satisfaction).
Work Stress WPLE Effect Boot SE Boot LLCI Boot ULCI
2.3663 (Low) 2.0601 (Low) 0.0548 0.0158 0.0257 0.0876
2.3663 (Low) 2.9899 (Medium) 0.0465 0.0120 0.0248 0.0717
2.3663 (Low) 3.9196 (High) 0.0381 0.0115 0.0177 0.0630
3.2995 (Medium) 2.0601 (Low) 0.0593 0.0134 0.0356 0.0877
3.2995 (Medium) 2.9899 (Medium) 0.0413 0.0098 0.0246 0.0625
3.2995 (Medium) 3.9196 (High) 0.0233 0.0095 0.0071 0.0444
4.2327 (High) 2.0601 (Low) 0.0637 0.0169 0.0351 0.1012
4.2327 (High) 2.9899 (Medium) 0.0361 0.0129 0.0145 0.0648
4.2327 (High) 3.9196 (High) 0.0085 0.0124 −0.0139 0.0352
Index of moderated moderated-mediation
Index BOOT SE BOOT LLCI BOOT ULCI
−0.0111 0.0038 −0.0191 −0.0043
Indices of moderated moderated-mediation by work stress
WPLE Index BOOT SE BOOT LLCI BOOT ULCI
Low 0.0047 0.0100 −0.0132 0.0260
Medium −0.0056 0.0083 −0.0212 0.0114
High −0.0159 0.0078
Sustainability 2022, 14, x FOR PEER REVIEW
−0.0317 −0.0008 16 of 29
Figure 2. Work stress moderating
Figure between
2. Work stress work-from-home
moderating productivity
between work-from-home and work–life
productivity balance.
and work–life balance.
As shown in Figure 2, at high levels of work stress, WFHP is associated with low
WLB. Further, the slope of the line representing high work stress is negative and the slope
of the line representing low work stress is positive, thus supporting the hypothesis that
work stress moderates the relationship between WFHP and work stress (H2a).
Hypothesis 2b posits that WPLE (second moderator) and work stress (first modera-WPLE Index BOOT SE BOOT LLCI BOOT ULCI
Low 0.0047 0.0100 −0.0132 0.0260
Medium −0.0056 0.0083 −0.0212 0.0114
High −0.0159 0.0078 −0.0317 −0.0008
Sustainability 2022, 14, 11179 17 of 29
The index of moderated moderated-mediation from 20,000 bootstrap samples was
−0.0111. Boot SE (0.0038), Boot LLCI (−0.0191), and BOOT UL (−0.0043) present significant
The index of moderated moderated-mediation from 20,000 bootstrap samples was
values, thus supporting H2b.
−0.0111. Boot SE (0.0038), Boot LLCI (−0.0191), and BOOT UL (−0.0043) present significant
Thethus
values, visual presentation
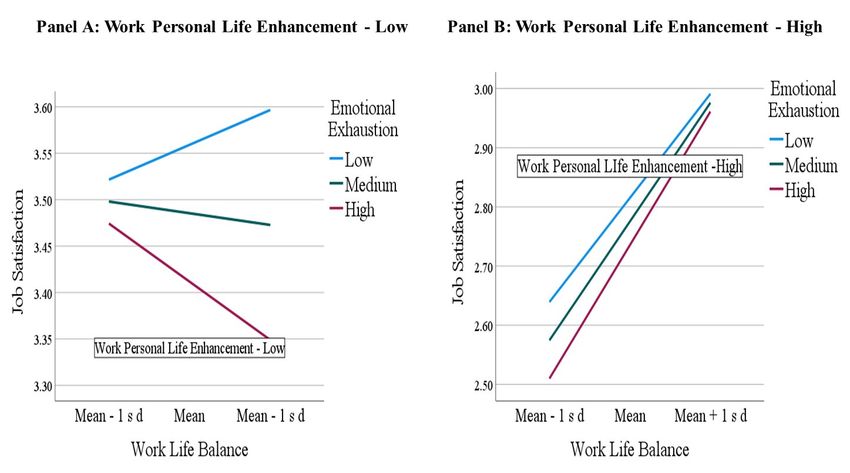
supporting H2b. of the three-way interaction is shown in two panels of Figure
3. TheThe
relationship betweenofWFHP,
visual presentation work interaction
the three-way stress, andisWLB
shown atin
low
twolevels
panelsofofWPLE
Figure (in
3. Panel
A), and at high levels of WPLE (Panel B) is shown. When WPLE is low,
The relationship between WFHP, work stress, and WLB at low levels of WPLE (in Panel A), an increase in
work
and atstress decreases
high levels WLB
of WPLE as the
(Panel B) iscurve
shown.has a negative
When WPLE isslope.
low, anOn the contrary,
increase in work when
WPLE is high, even
stress decreases WLBwhen
as the at higher
curve has alevels of work
negative slope.stress,
On theWLB increases,
contrary, as theiscurve is
when WPLE
positively
high, evensloped.
when atThese
higherresults
levels ofcorroborate
work stress,the
WLBsupport for as
increases, H2b.
the curve is positively
sloped. These results corroborate the support for H2b.
Figure 3. (A): the moderating effect of work stress and work-from-home productivity at low lev-
Figure 3. (Panel A): the moderating effect of work stress and work-from-home productivity at low
els of personal life enhancement. (B): the moderating effect of work stress and work-from-home
levels of personal life enhancement. (Panel B): the moderating effect of work stress and work-from-
productivity at high levels of personal life enhancement.
home productivity at high levels of personal life enhancement.
5.5.2. Testing the Second Moderated Moderated-Mediation Hypotheses (H3a and H3b)
5.5.2. In
Testing thetest
order to Second Moderated
H3a and H3b, weModerated-Mediation
used model #18 of [143]Hypotheses (H3a and
PROCESS macros and H3b)
In order
present to test
the results in H3a
Tableand
7. H3b, we used model #18 of [143] PROCESS macros and pre-
sent the results in Table 7. emotional exhaustion moderates the relationship between
Hypothesis 3a posits that
WOB and job satisfaction. The regression coefficient of the two-way interaction term was
significant
Table (β WLB
7. Testing of ×H3a (two-way
emotional = 0.131; and
interaction)
exhaustion t = 1.99; p < 0.05).
hypothesis 3b The bootstrapping
(three-way results
interaction) [R2 =
were
0.525]. based on 20,000 bootstrap samples and 95% Boot LLCI (0.0019) and BOOT ULCI
(0.2595), and since ‘zero’ was not contained in the lower and upper limits, H3b is supported.
The visual presentation of the interaction effect is shown inDV= Figure Job
4. Satisfaction
As shown Variables Coeff
in Figure 4, lower levels of emotional se
exhaustion t interacting
p LLCI
and low ULCI
levels of WLB are associated with a higher job satisfaction than higher levels of emotional
Constant 1.1338 0.8658 1.3095 0.1906 −0.5650 2.8326
exhaustion and lower levels of WLB. Further, when WLB increases from ‘low’ to ‘high’,
WFHP
job satisfaction falls when emotional exhaustion 0.2367 0.0295
is high, as the8.0300 0.0000 0.1789
curve representing high 0.2945
emotional exhaustion WLBis negative. On the contrary,0.0609 0.2780
high levels 0.2192
of WLB 0.8265with
combined −0.4846
lower 0.6064
level of emotional exhaustion results in a higher job satisfaction, as the curve representing
a low level of exhaustion is positive. These results corroborate the support for H3a.You can also read